North America
North America
APAC
EMEA
LATAM
Support
Contact Us
Support
Contact Us
Support
Contact Us
Support
Contact Us
Solution Suite
Core Subscription
Planning
Reporting
Consolidation
Dashboards
Data Warehouse
Additional Functionality
Integrations
Industries
Template Marketplace
On-Demand Training
Support
Options
Rapid Deployment
Consulting
Instructor-Led Training
Pricing
About
Partners
Find a Partner
Becoming a Partner
Technology Partners
Partner Portal
Resources
Events
ASCEND Conference
Customer Stories
Community
Resources
Glossary
Blog
Watch Demo
Template Library Glossary
Recent Posts
Workforce Efficiency Dashboard for SaaS Companies using Dynamics 365 Business Central
Subscription Billing Auto Forecast for SaaS Companies using Dynamics 365 Business Central
Pipeline Win Loss Dashboard for SaaS Companies using Dynamics 365 Business Central
Filter Posts
Analysis
Budgeting
CPM
CRM
Compare CPM
Consolidation
Dashboards
Data warehouse
ERP
Events
FP&A
Financial Reporting
Forecasting
Industry
KPIs
Partners
Planning
Reporting
Template Library
Thought Leadership
Subscribe Today
VIEW SHOWCASE EXAMPLES
REQUEST A DEMO
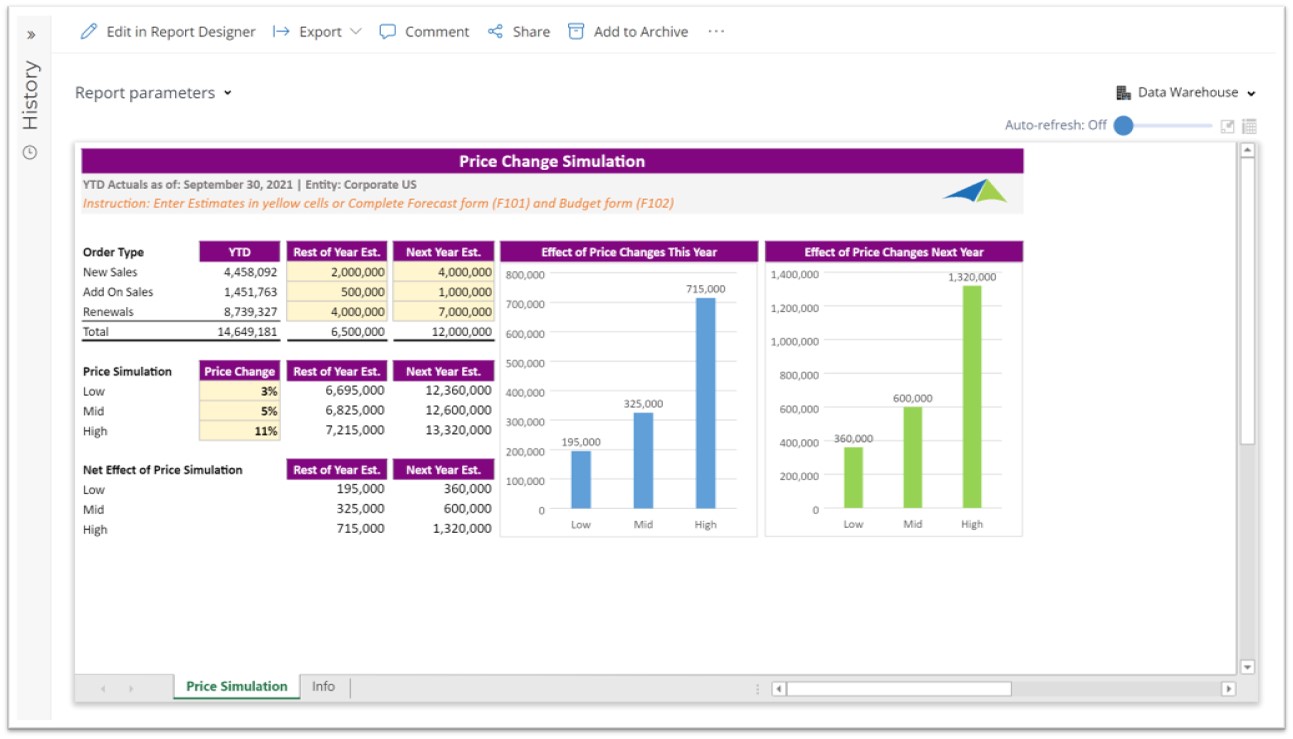
Price Change Simulation Dashboard for SaaS Companies using Dynamics 365 Business Central
This article describes the Price Change Simulation Dashboard that is included with Solver's SaaS ...
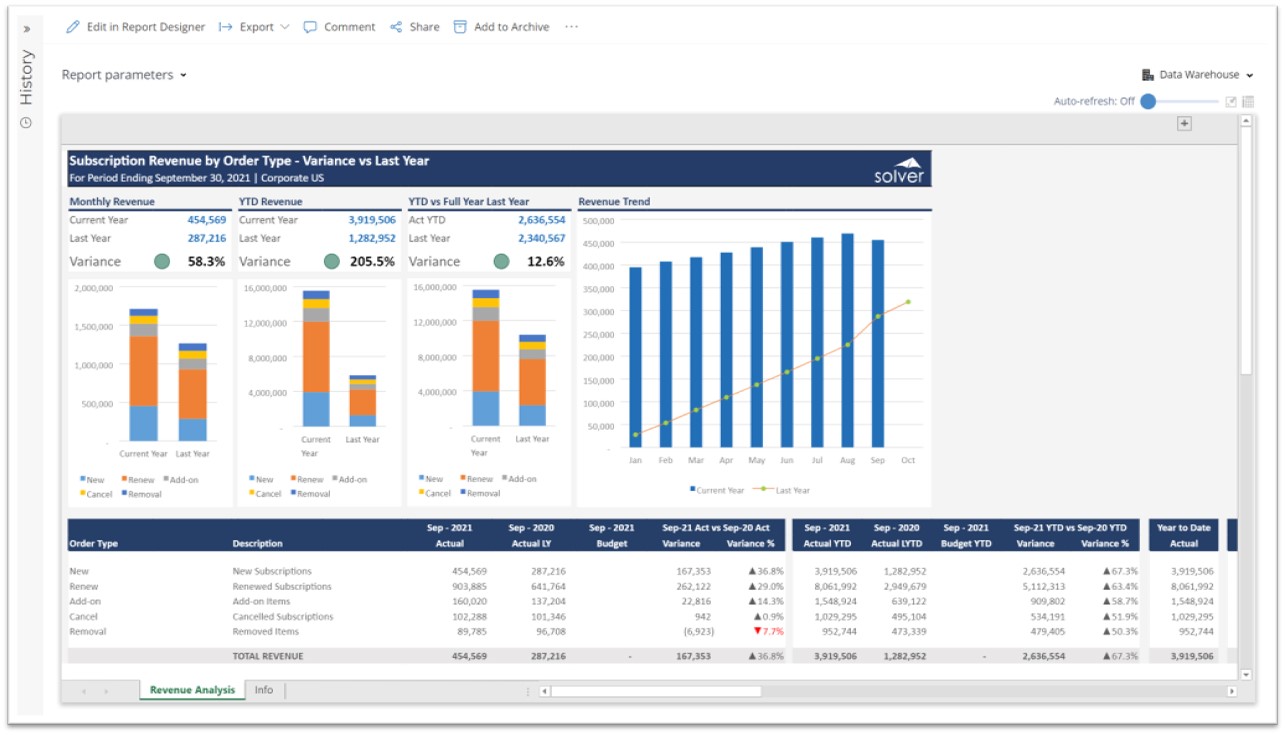
Subscription Revenue by Order Type Report for SaaS Companies using Dynamics 365 Business Central
This article describes the Subscription Revenue by Order Type Report that is included with Solver's ...
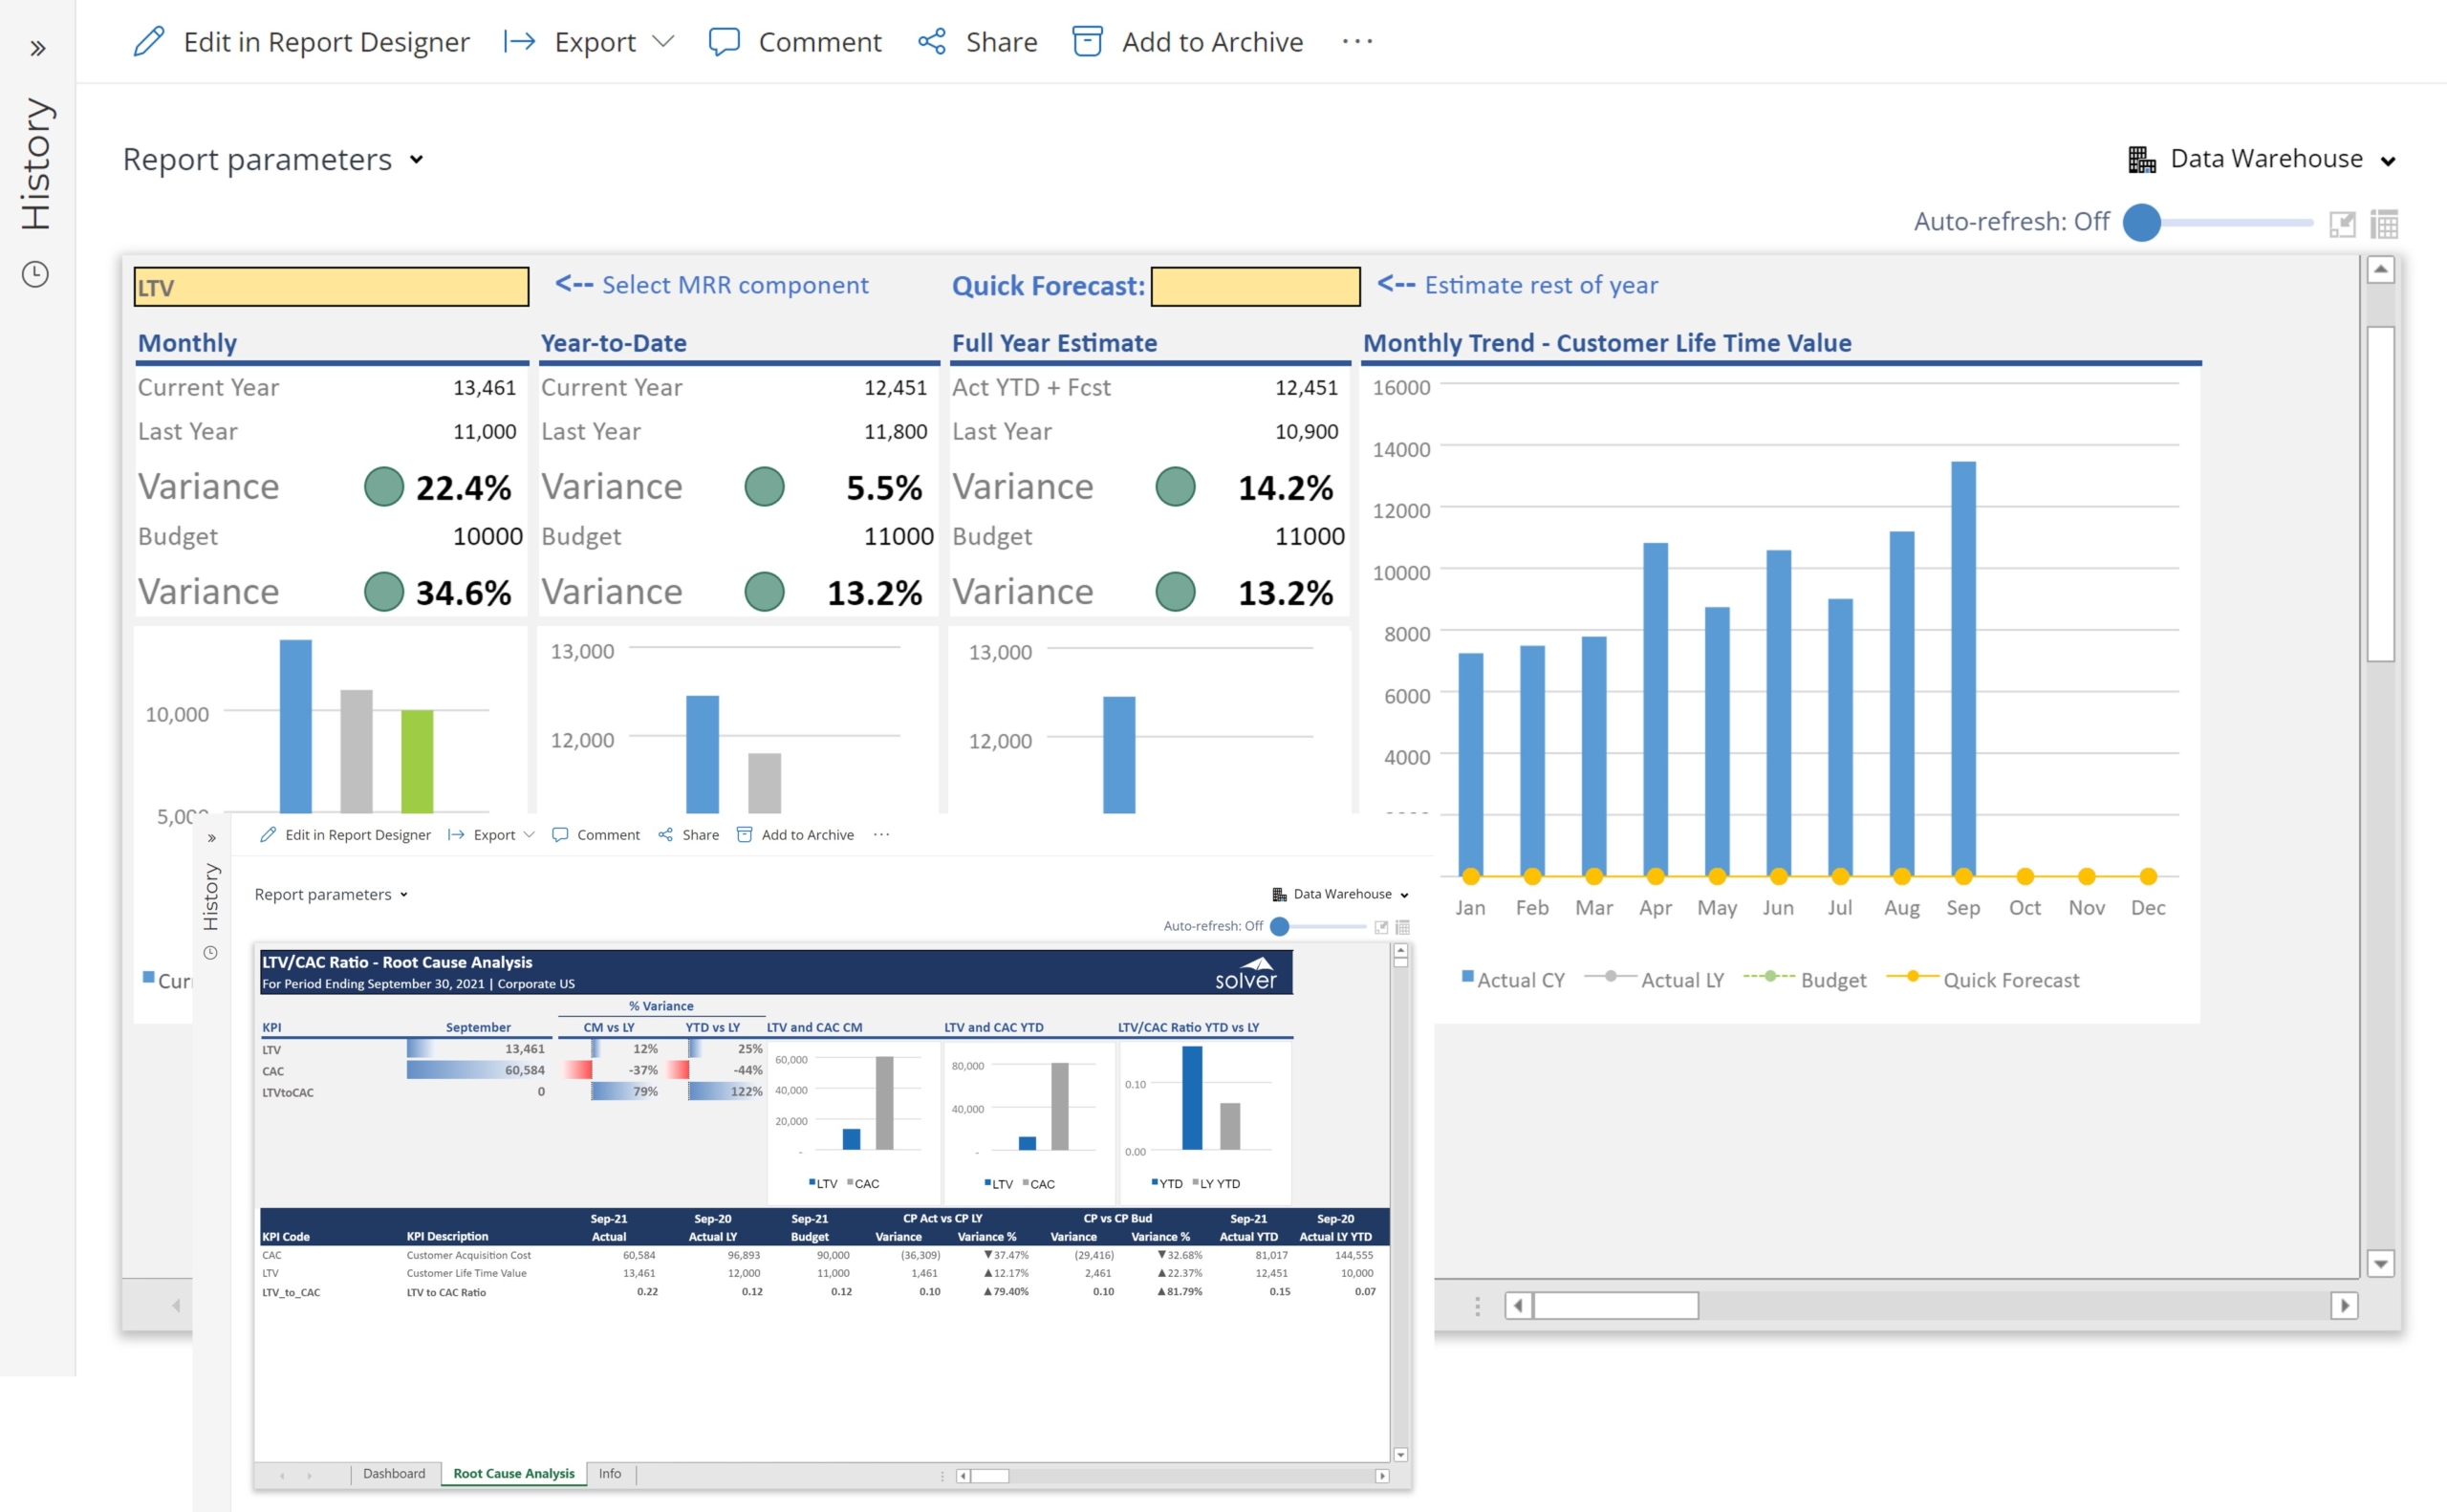
LTV to CAC Ratio Dashboard for SaaS Companies using Dynamics 365 Business Central
This article describes the Lifetime Value (LTV) to Customer Acquisition Cost (CAC) Ratio Dashboard ...
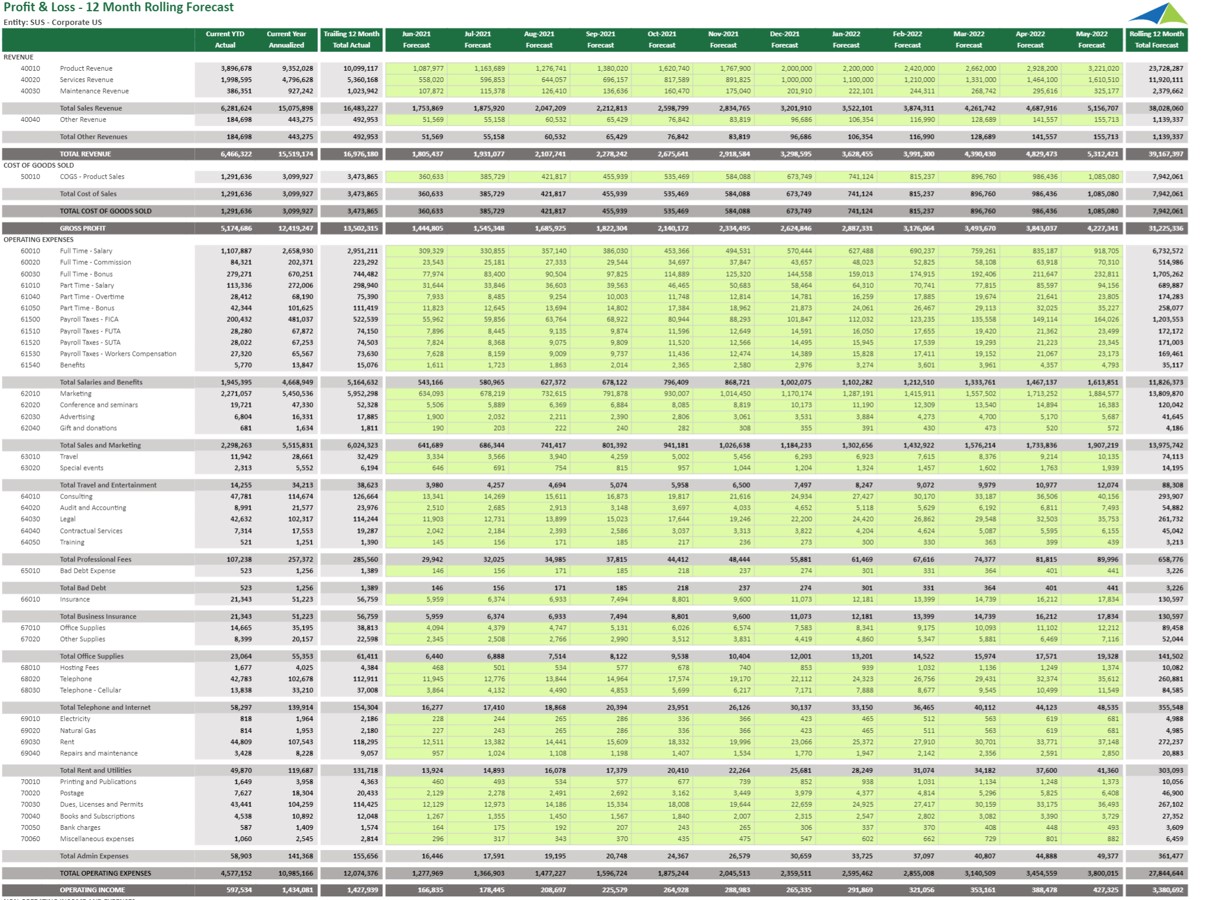
Using 12 Month Rolling P&L Forecasts to Streamline the Planning Process
How can Forecast Input Form s Drive Faster and Better Decisions? As Budget Managers increasingly ...
Using 5 Year P&L Forecasts to Streamline the Planning Process
How can Forecast Input Form s Drive Faster and Better Decisions? As Budget Managers increasingly ...
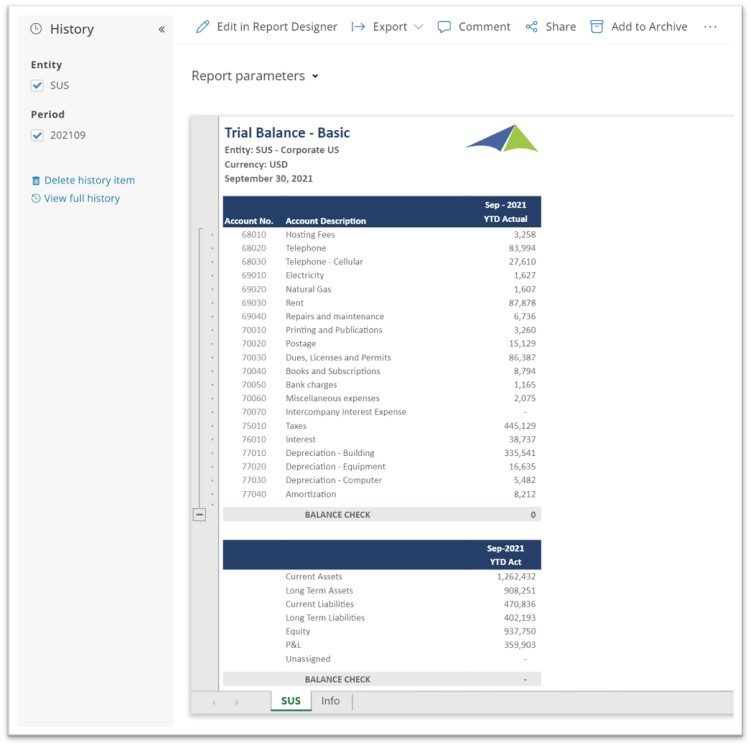
Using Basic Year-to-Date Trial Balance Reports to Streamline the Monthly Reporting Process
How can Control Report s Drive Faster and Better Decisions? As Corporate Controllers increasingly ...
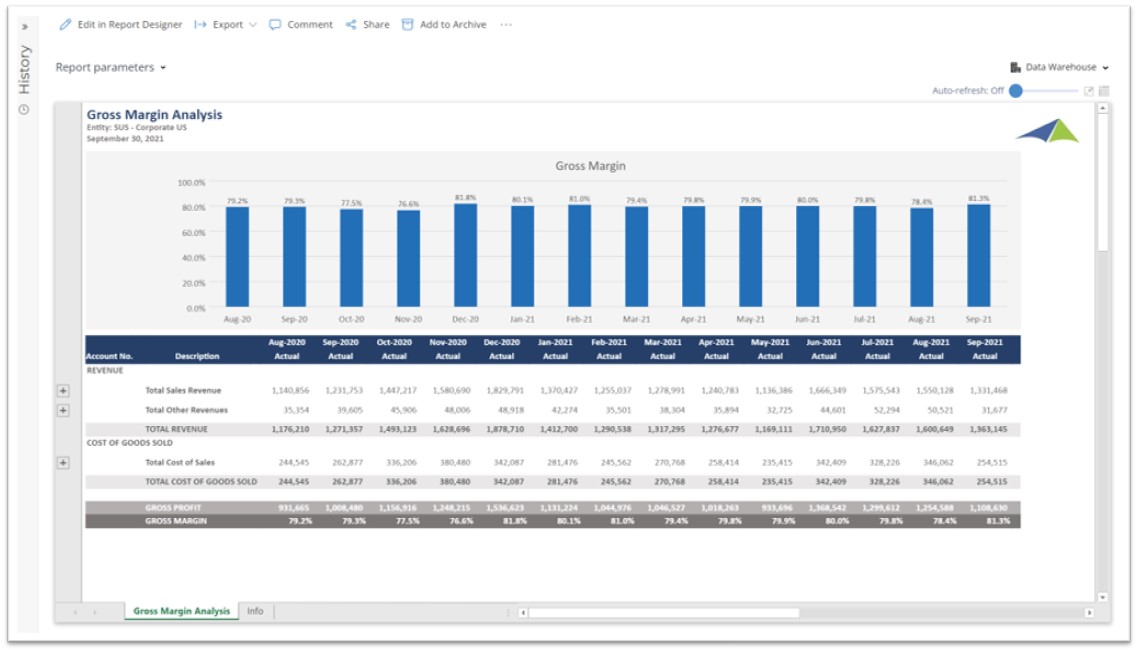
Using Gross Margin Trend Analysis Reports to Streamline the Monthly Reporting Process
How can Profitability Analysis Drive Faster and Better Decisions? As CFOs increasingly become key ...
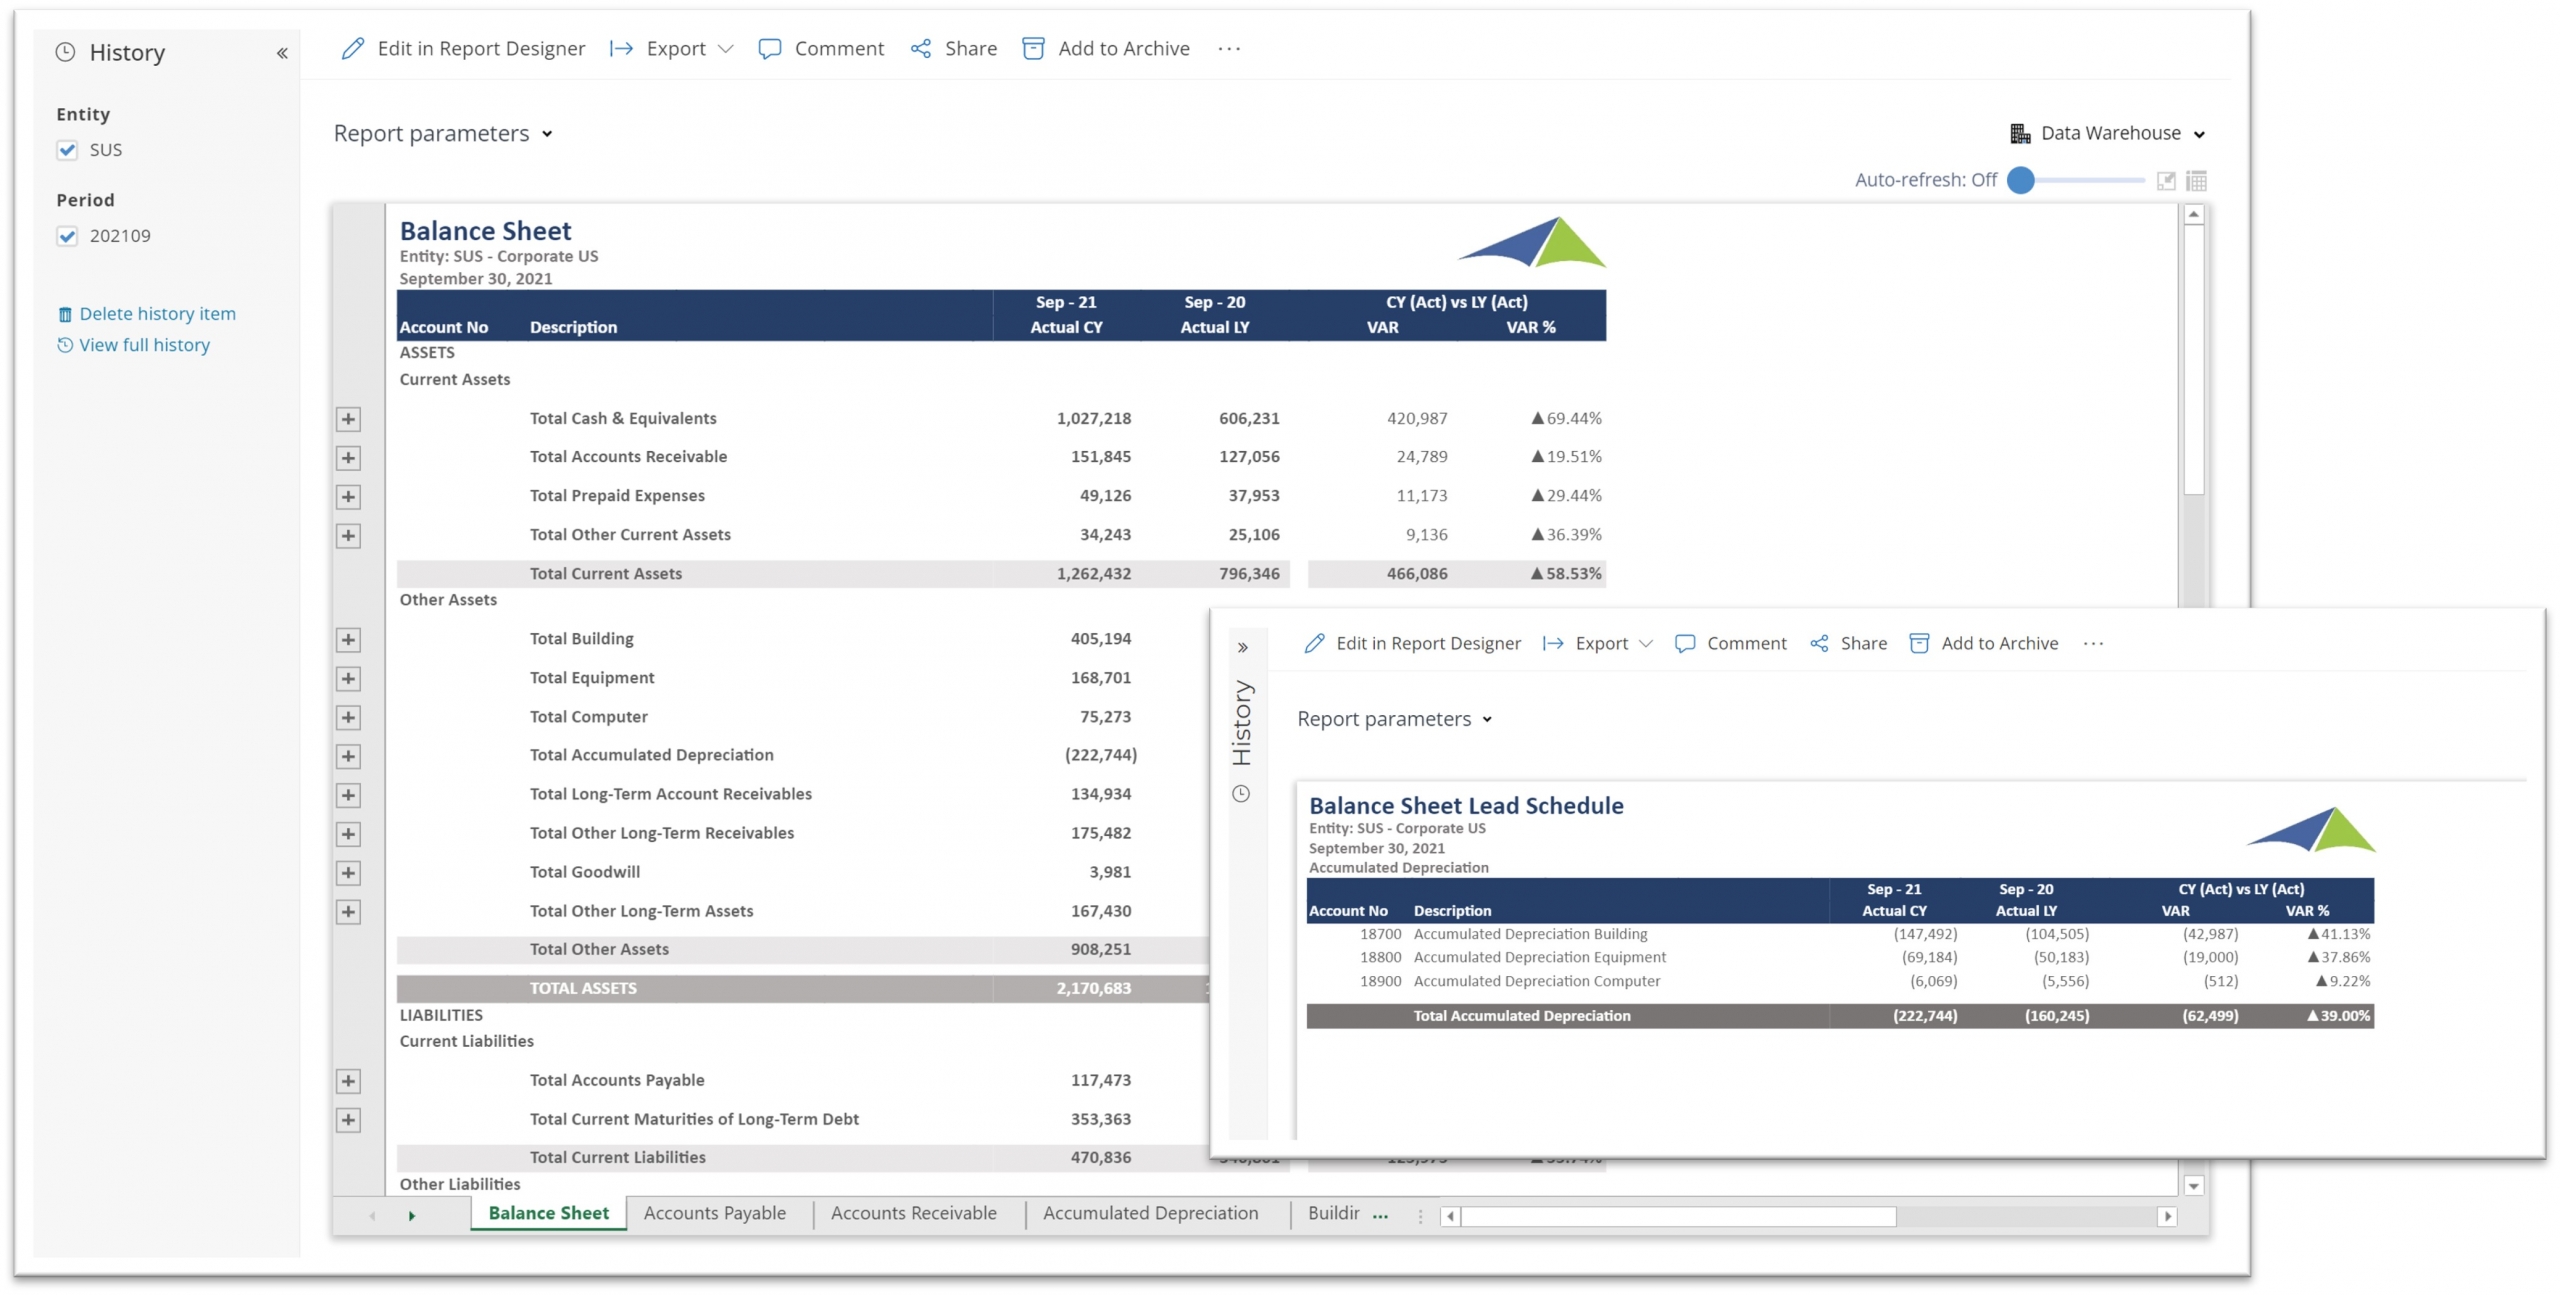
Using Balance Sheet Lead Schedule Reports to Streamline the Month End Close Process
How can Reconciliation Report s Drive Faster and Better Decisions? As Controllers increasingly ...
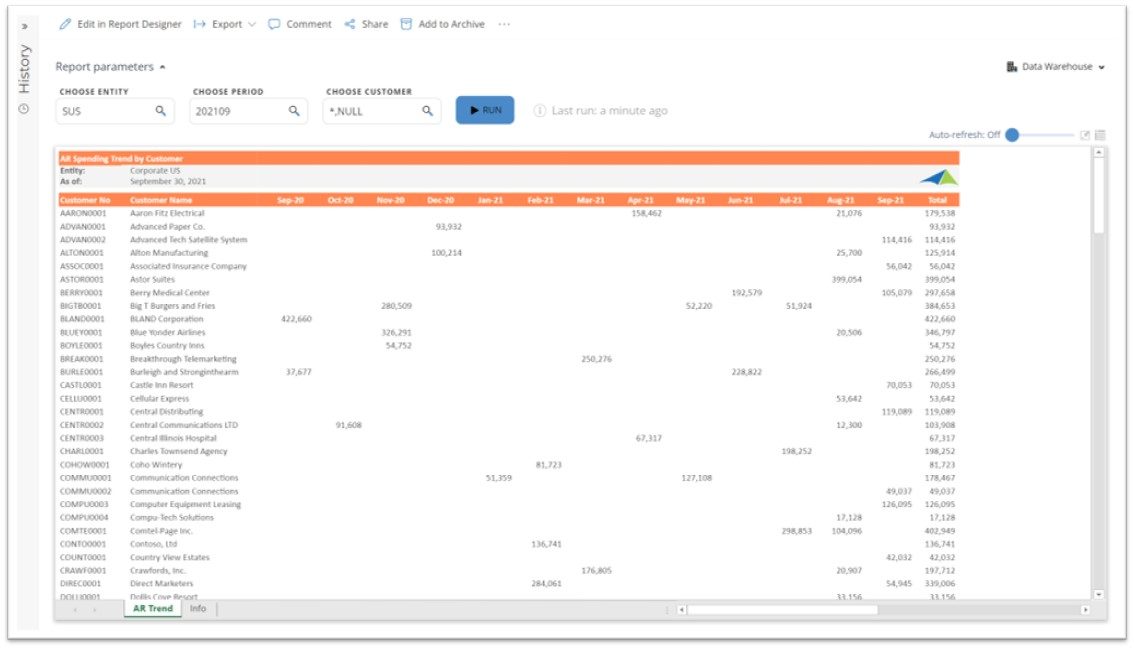
Using Accounts Receivable Spending Trend By Customer Reports to Streamline the AR Process
How can AR Report s Drive Faster and Better Decisions? As AR Managers increasingly become key ...
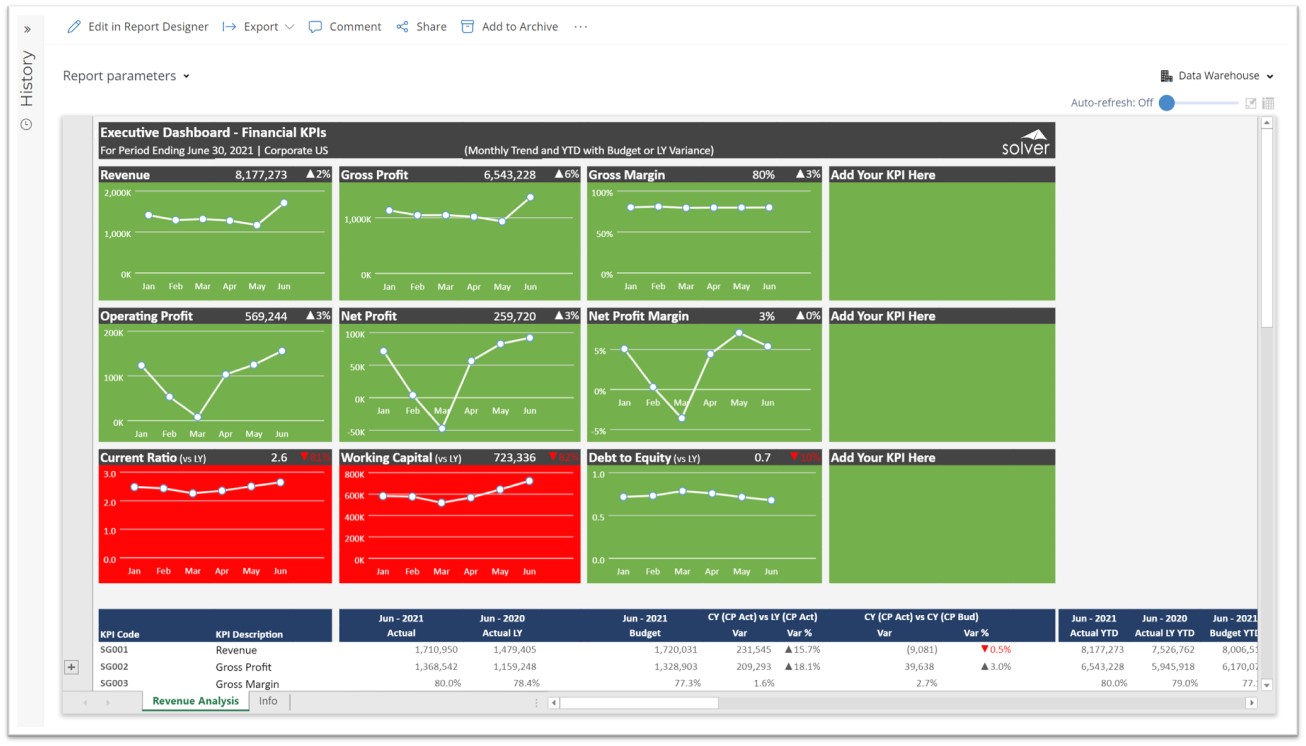
Using Executive Dashboards with Financial KPIs to Streamline the Monthly Analysis Process
How can Dashboards and Scorecards Drive Faster and Better Decisions? As CFOs increasingly become ...
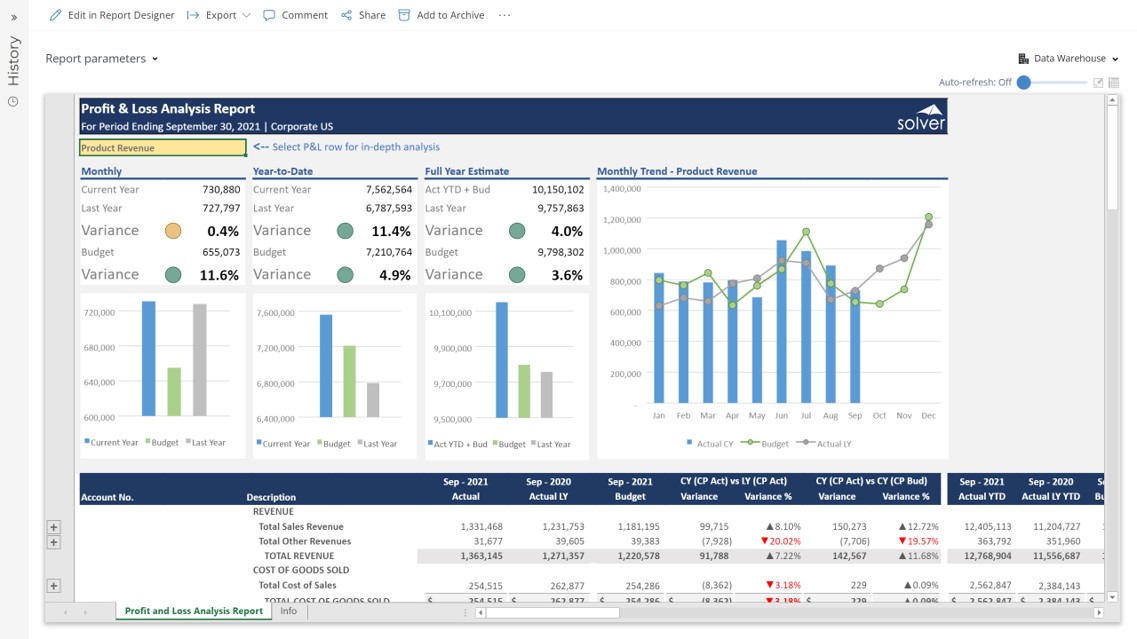
Using Profit & Loss Reports with Interactive Analysis to Streamline the Monthly Reporting Process
How can Profitability Analysis Drive Faster and Better Decisions? As CFOs increasingly become key ...
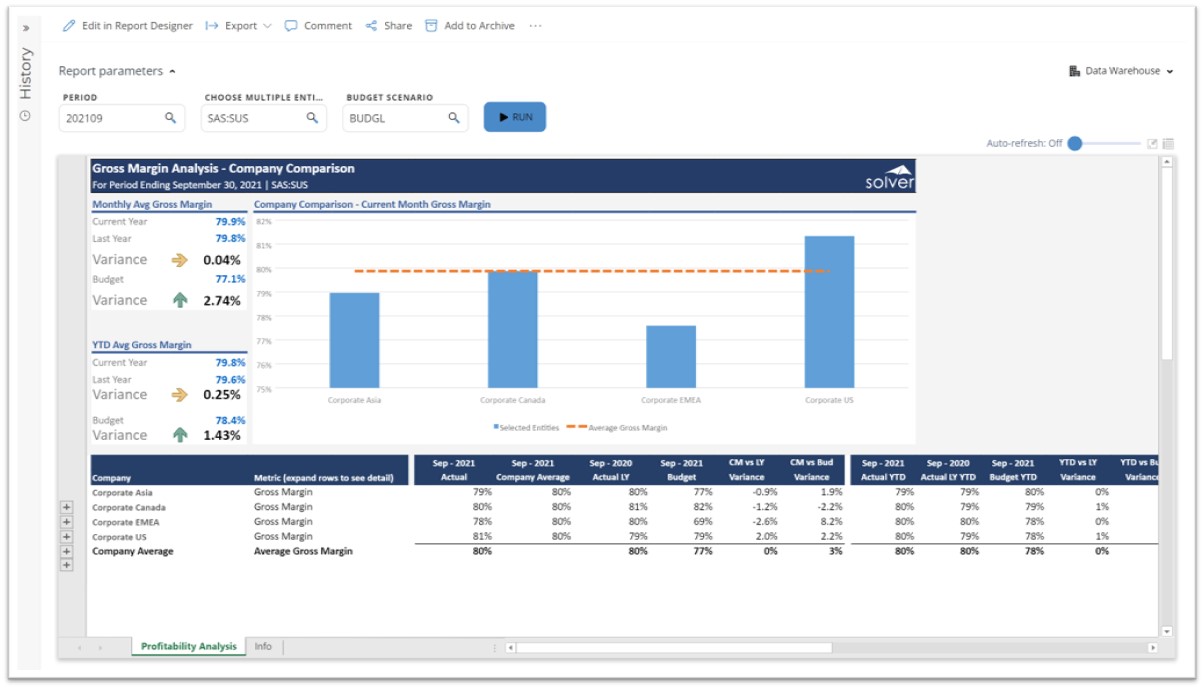
Using Gross Margin Analysis Reports with Benchmarking to Streamline the Monthly Reporting Process
How can Profitability Analysis Drive Faster and Better Decisions? As CFOs increasingly become key ...
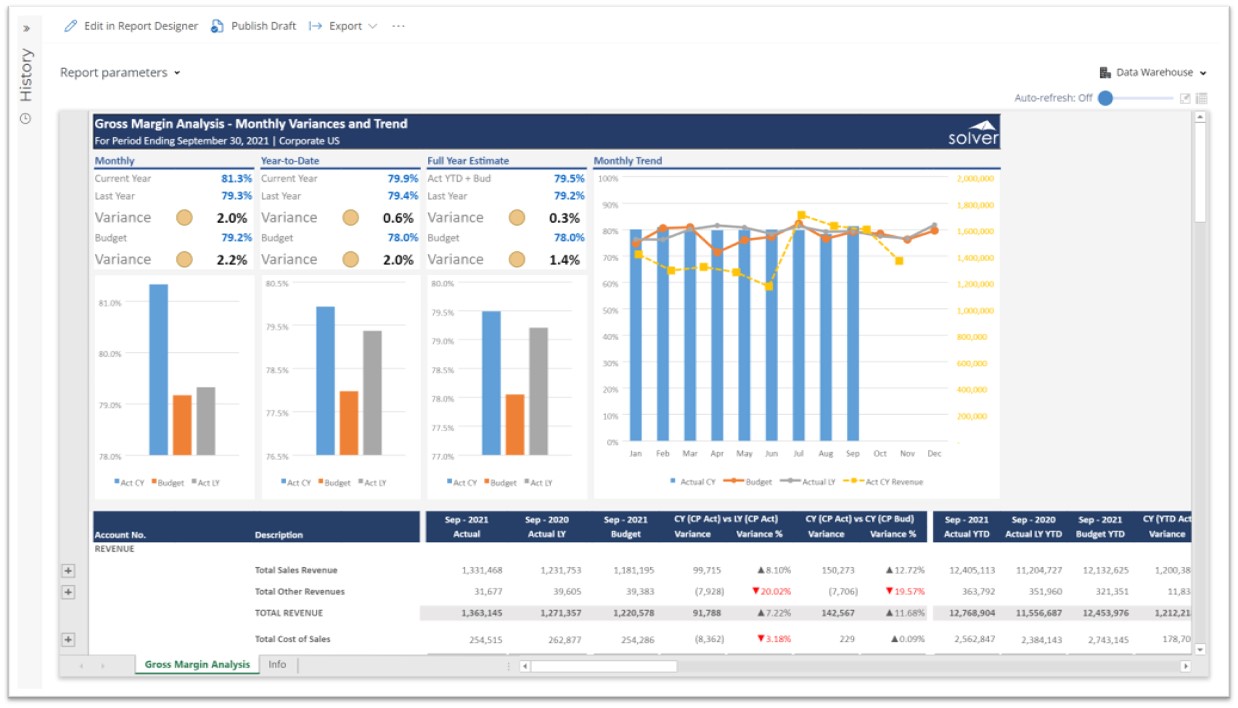
Using Gross Margin Analysis Reports with Monthly Variances and Trends to Streamline the Monthly Reporting Process
How can Profitability Analysis Drive Faster and Better Decisions? As CFOs increasingly become key ...
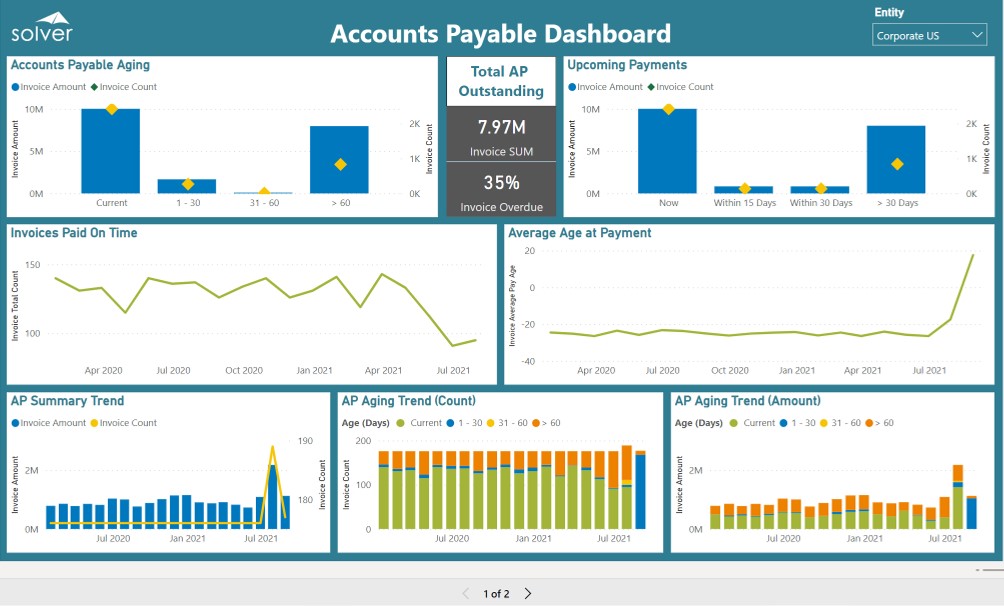
Using Accounts Payable Summary Dashboards to Streamline Processes
How can Accounts Payable ( AP) Dashboard s Drive Faster and Better Decisions? As Controllers and ...
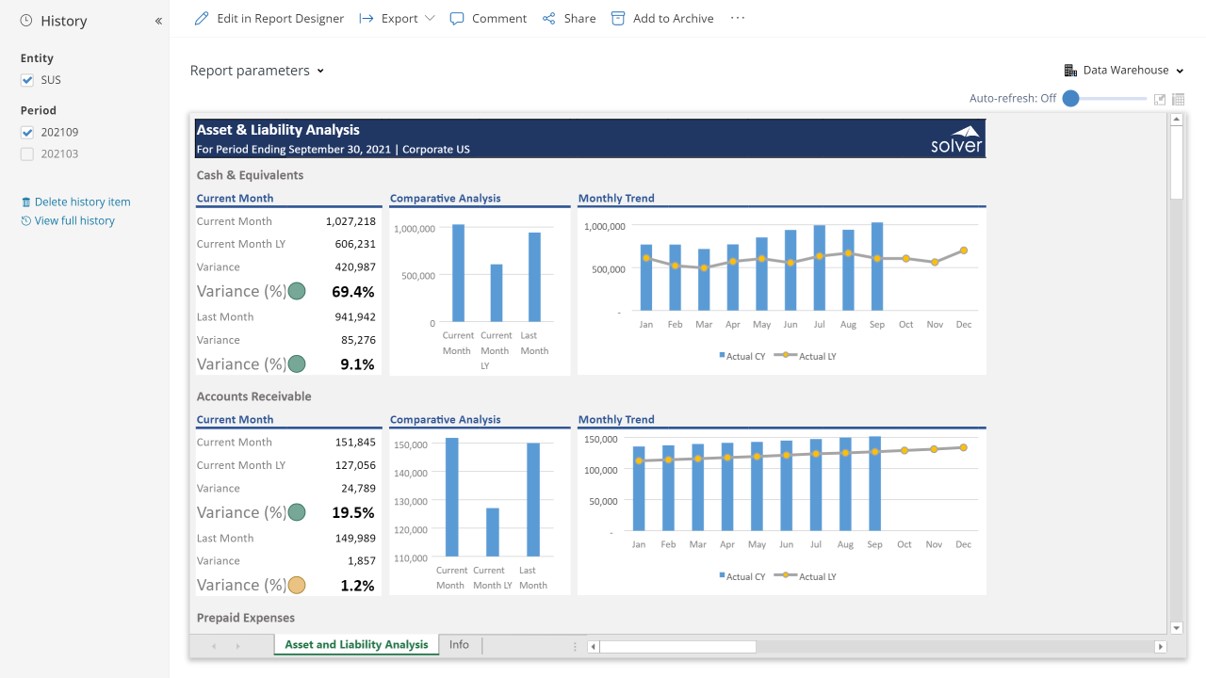
Using Asset & Liability Analysis with Variances and Trends to Streamline the Monthly Reporting Process
How can Balance Sheet KPI Analysis Drive Faster and Better Decisions? As CFOs increasingly become ...
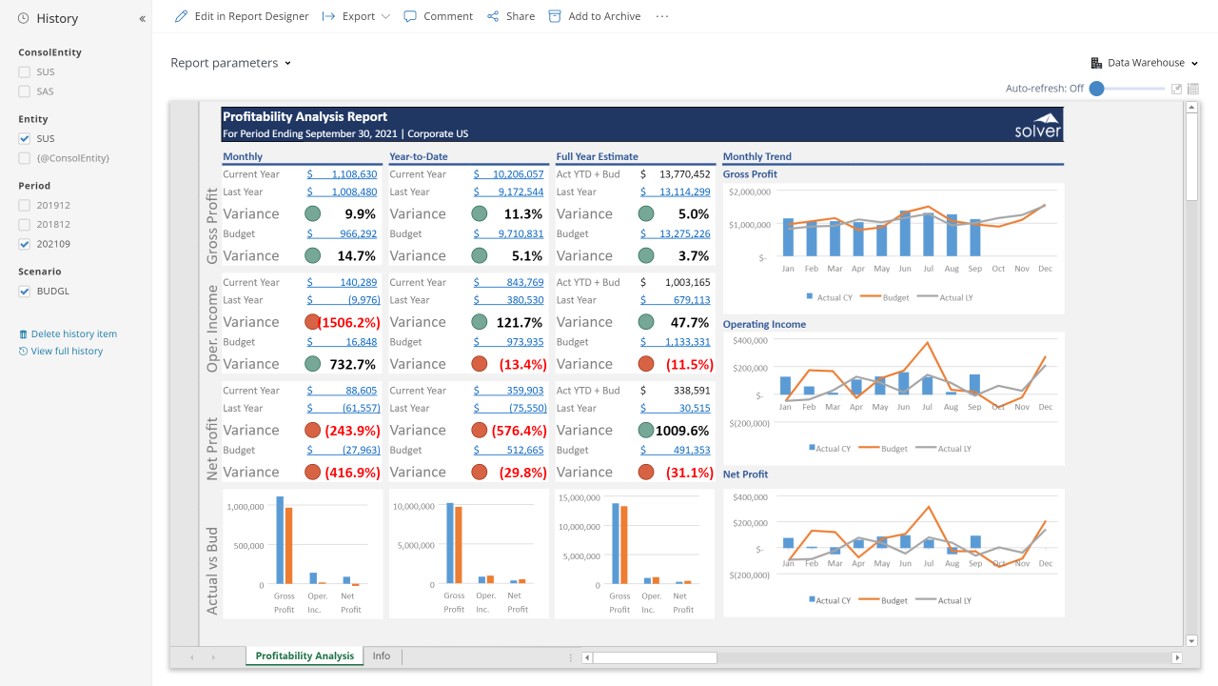
Using Profitability Analysis to Streamline the Monthly Reporting Process
How can Gross Profit and Net Profit Analysis Reports Drive Faster and Better Decisions? As CFOs ...
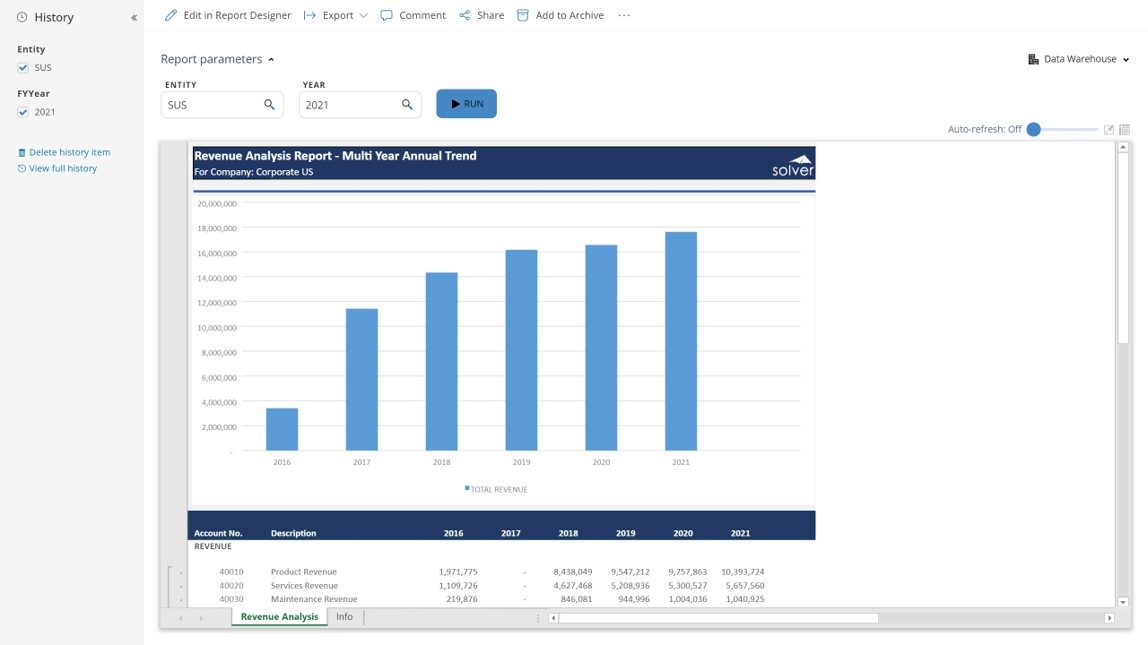
Using Multi-year Revenue Trend Analysis to Streamline the Annual Reporting and Budgeting Process
How can Revenue Trend Analysis Drive Faster and Better Decisions? As CFOs increasingly become key ...
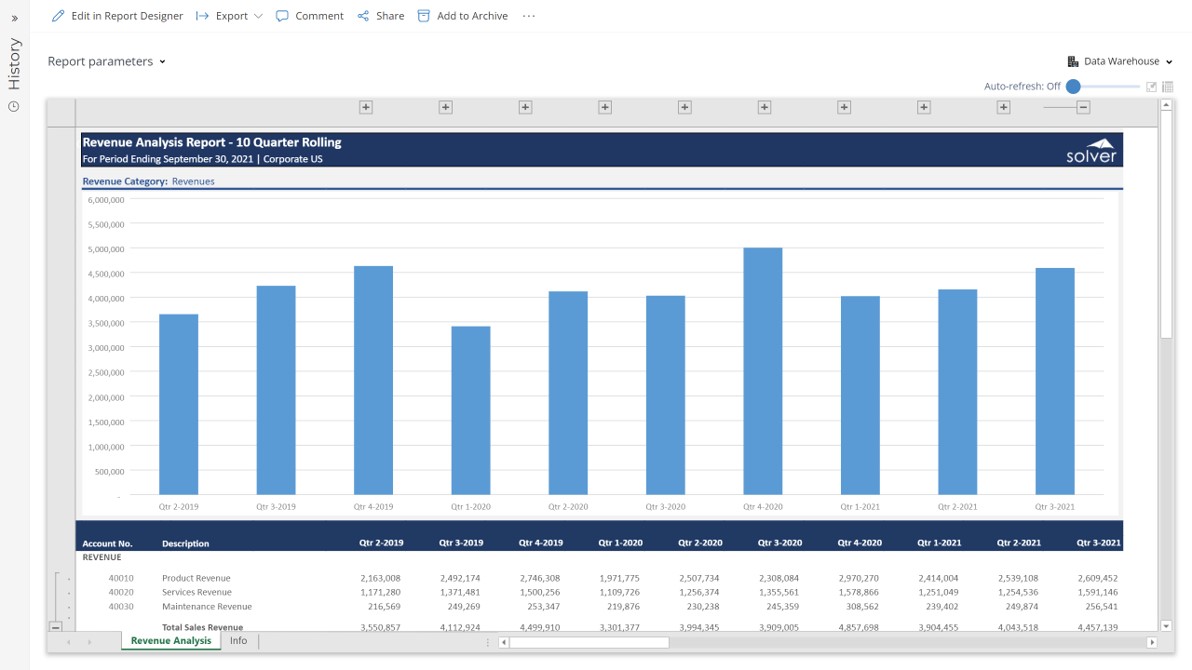
Using Rolling 10 Quarter Revenue Analysis to Streamline the Quarterly Reporting Process
How can Quarterly Rolling Revenue Analysis Drive Faster and Better Decisions? As CFOs increasingly ...
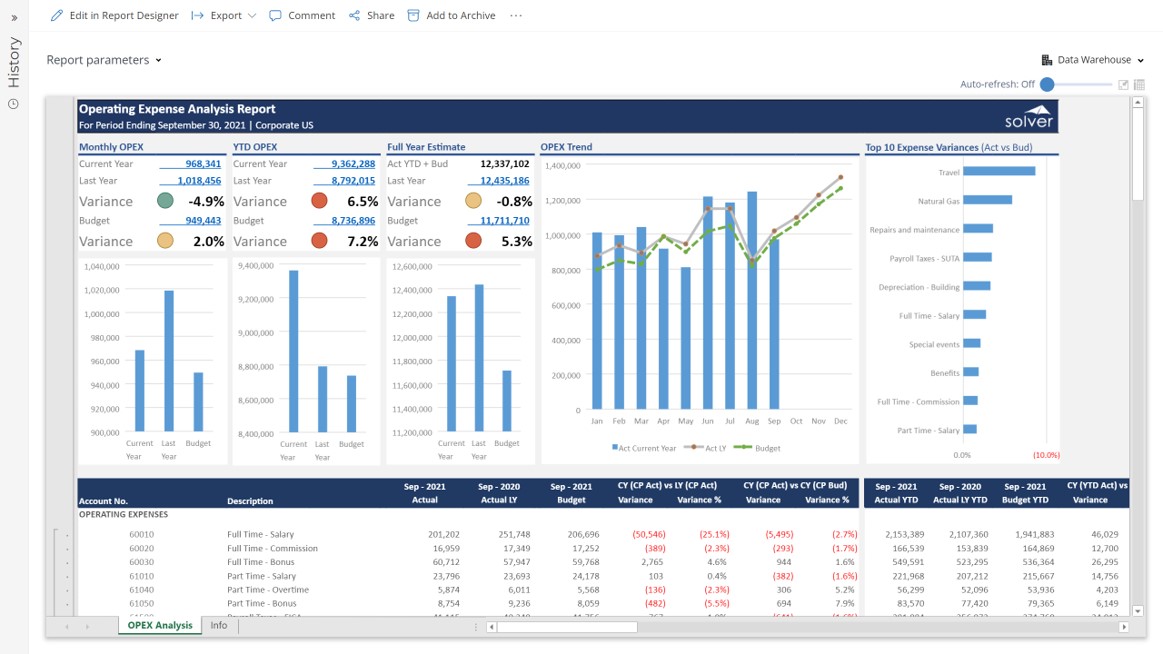
Using Operating Expense Analysis to Streamline the Monthly Reporting and Analysis Process
How can Operating Expense Analysis Report s Drive Faster and Better Decisions? As Controllers ...
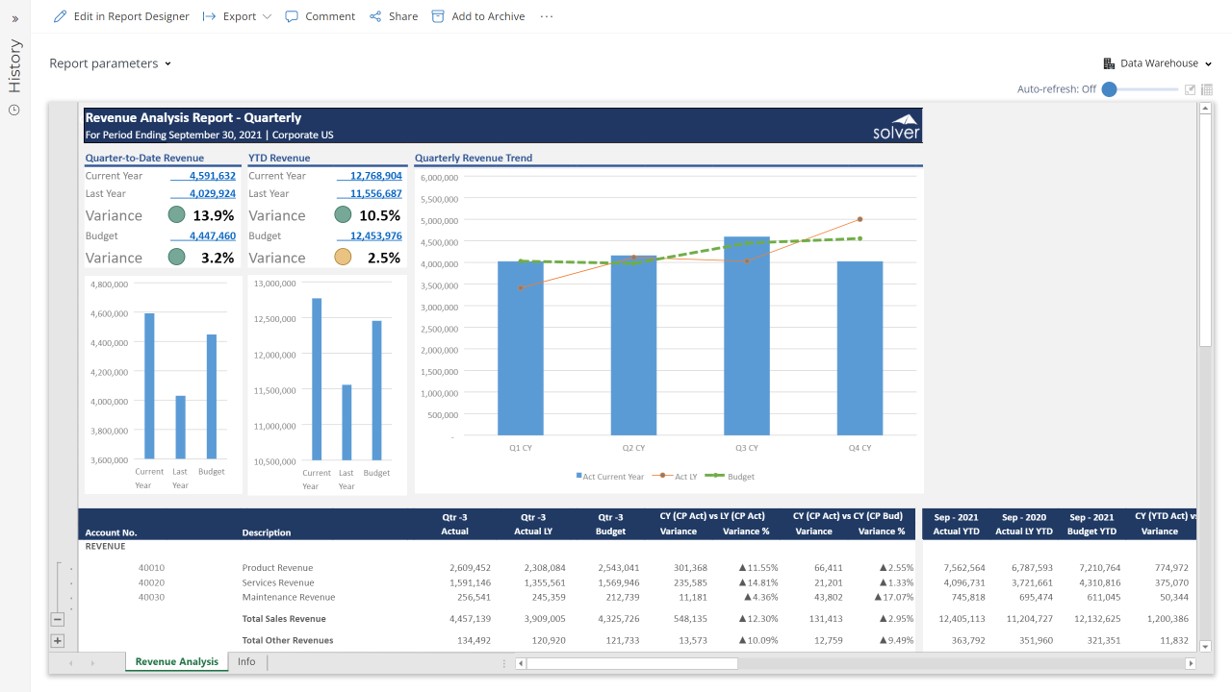
Using Revenue Analysis with Quarterly Actual and Budget Comparisons to Streamline the Quarterly Reporting Process
How can Quarterly Revenue Analysis Drive Faster and Better Decisions? As CFOs increasingly become ...
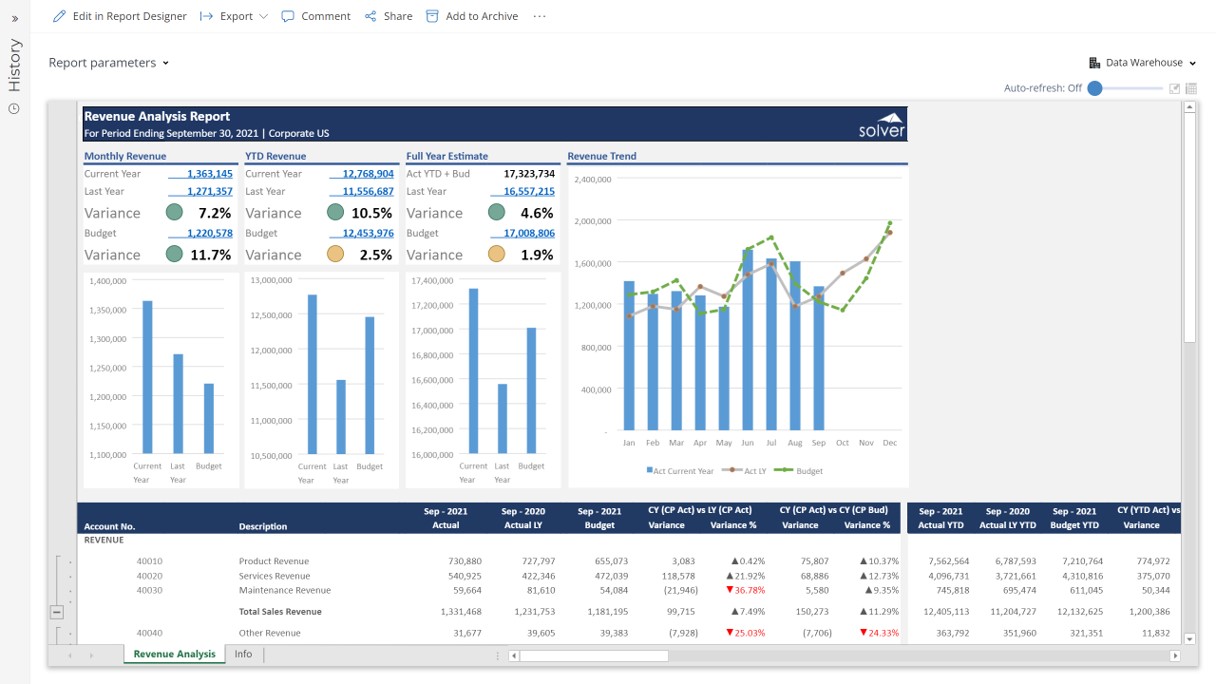
Using Graphical Revenue Reports with Actual and Budget Comparisons to Streamline the Monthly Analysis Process
How can Graphical Revenue Analysis Drive Faster and Better Decisions? As CFOs increasingly become ...
Using Opening Balance Roll Forward Profit & Loss Reports to Streamline the Year-end Close Process
How can Reconciliation Report s Drive Faster and Better Decisions? As Controllers increasingly ...
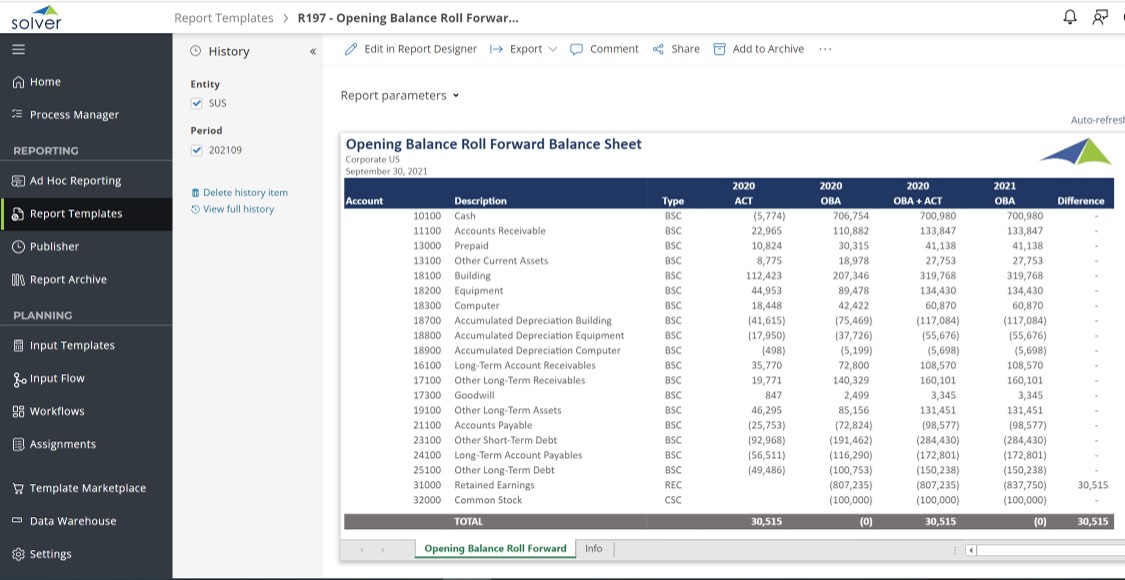
Using Opening Balance Roll Forward Balance Sheet Reports to Streamline the Year-end Close Process
How can Reconciliation Report s Drive Faster and Better Decisions? As Controllers increasingly ...
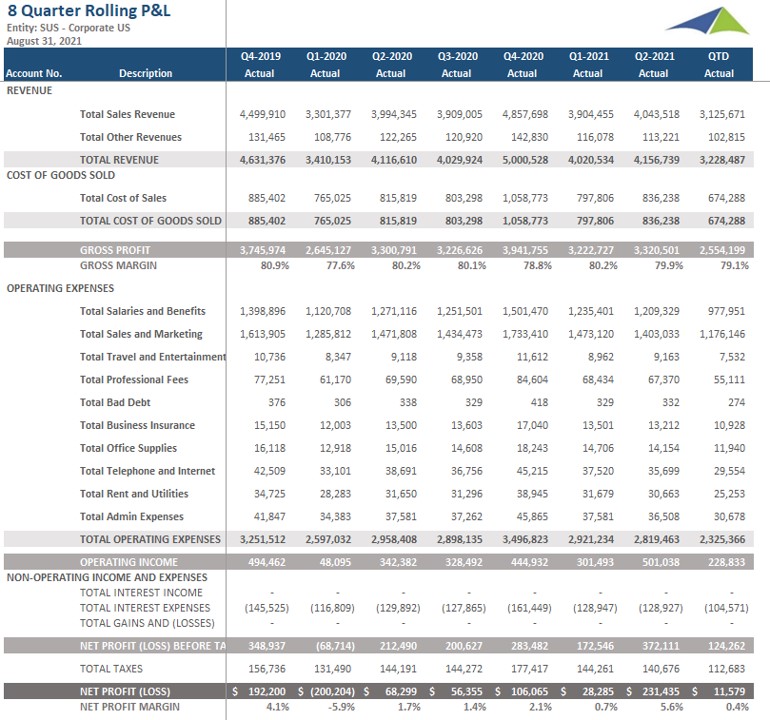
Using 8 Quarter Rolling Profit & Loss Reports to Streamline the Monthly Reporting Process
How can Trended Financial Statement s Drive Faster and Better Decisions? As CFOs increasingly ...
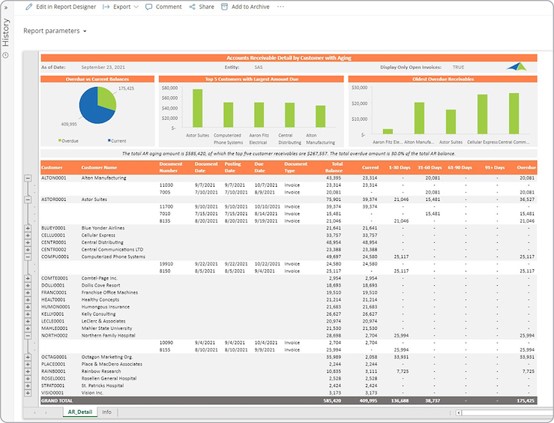
Using Accounts Receivable Detail Reports to Streamline the AR Aging Analysis Process
How can Accounts Receivable Report s Drive Faster and Better Decisions? As Accounting and ...
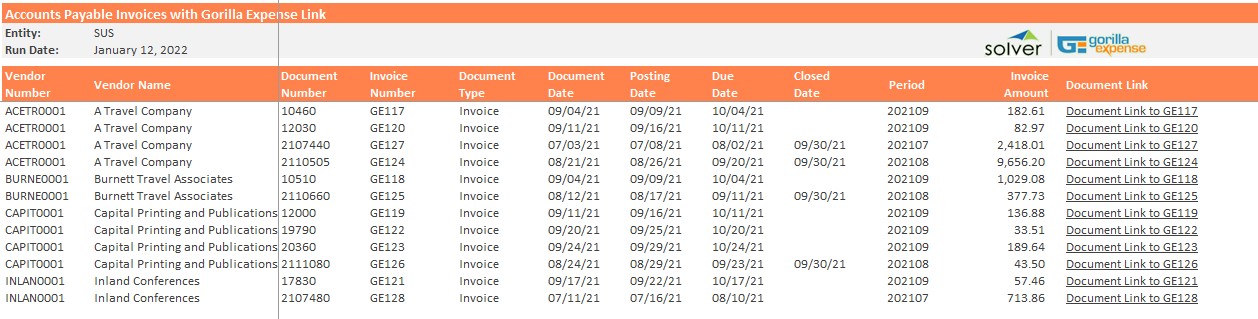
Using AP Detail Reports with Drill-down to Gorilla Expense to Streamline the Vendor Expense Analysis Process
How can Accounts Payable Reports with Drill-down Drive Faster and Better Decisions? As Accounting ...
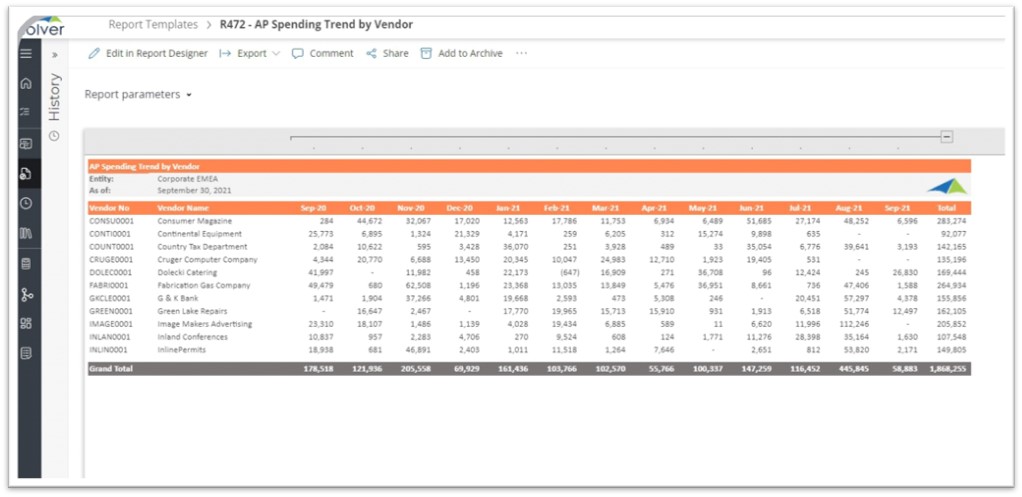
Using AP Trend Reports by Vendor to Streamline the Vendor Expense Analysis Process
How can Accounts Payable Reports Drive Faster and Better Decisions? As Accounting Managers ...
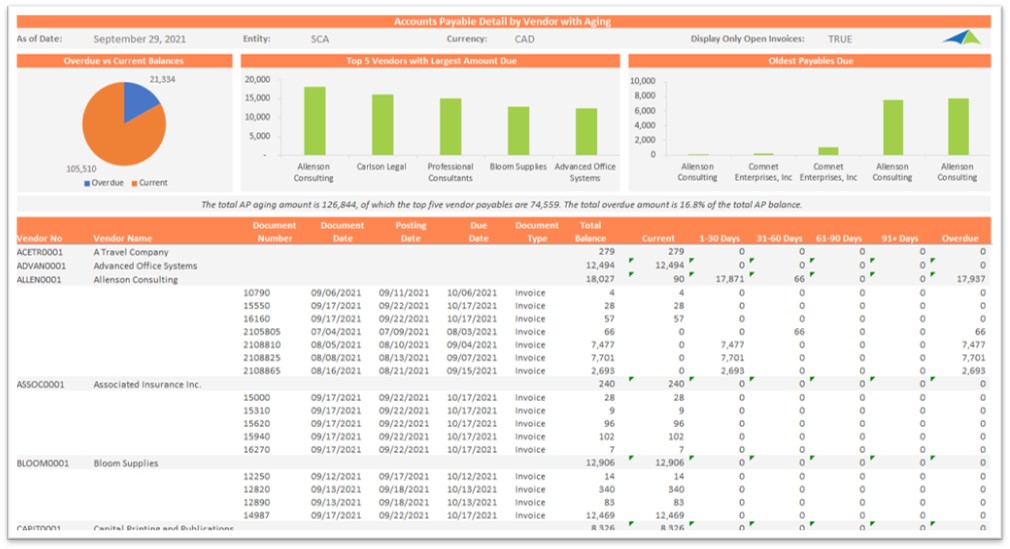
Using AP Detail by Vendor Reports to Streamline the Expense Analysis Process
How can Accounts Payable Reports Drive Faster and Better Decisions? As Accounting Managers ...
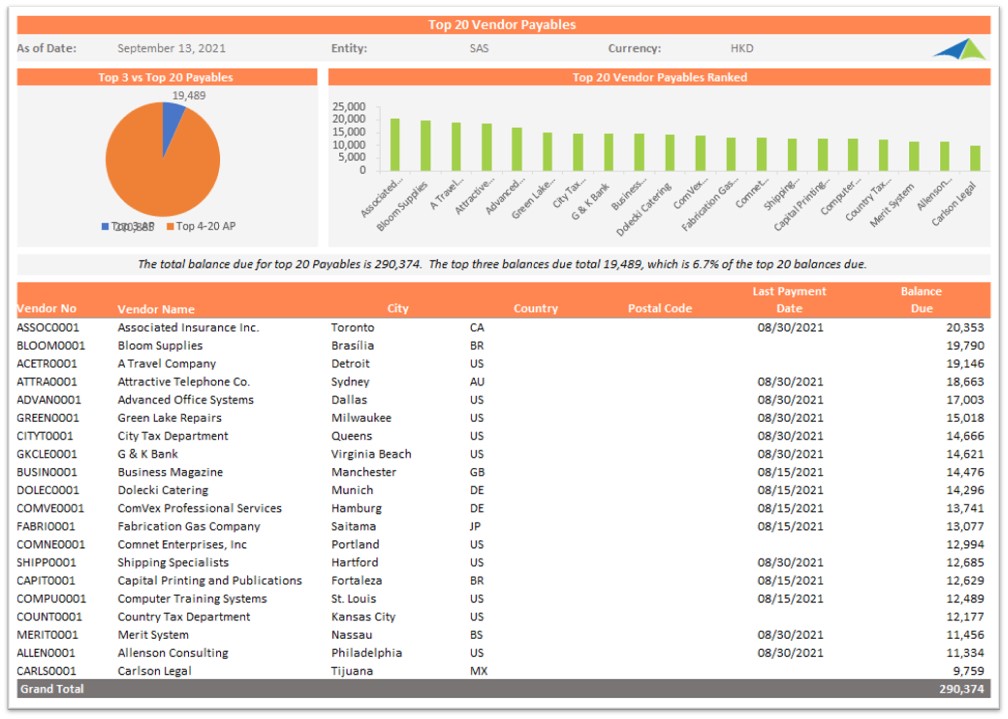
Using Top 20 Vendor Payables Reports to Streamline the Expense Analysis Process
How can Accounts Payable Reports Drive Faster and Better Decisions? As Accounting Managers ...
Using web-based P&L Budgeting Forms to Streamline the Annual Planning Process
How can Budget Input Form s Drive Faster and Better Decisions? As Budget Managers increasingly ...
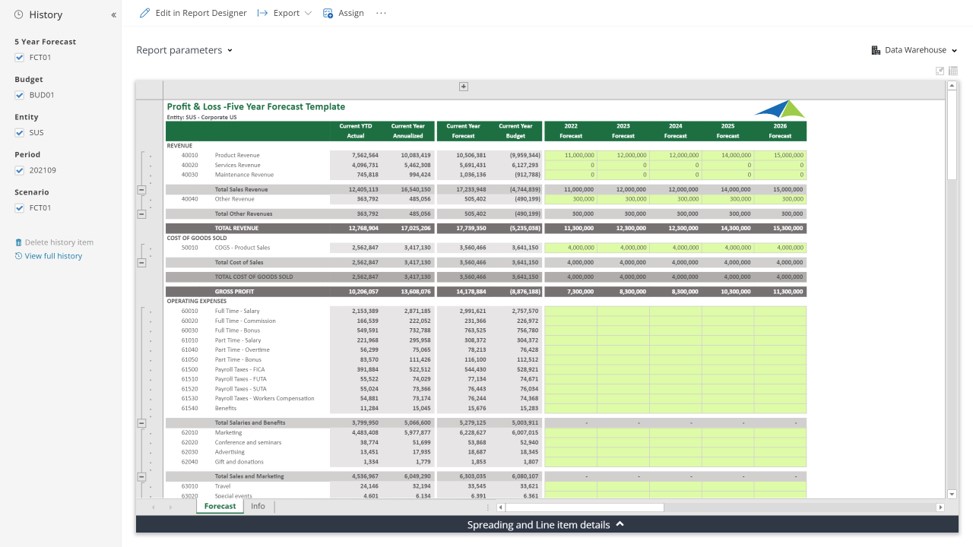
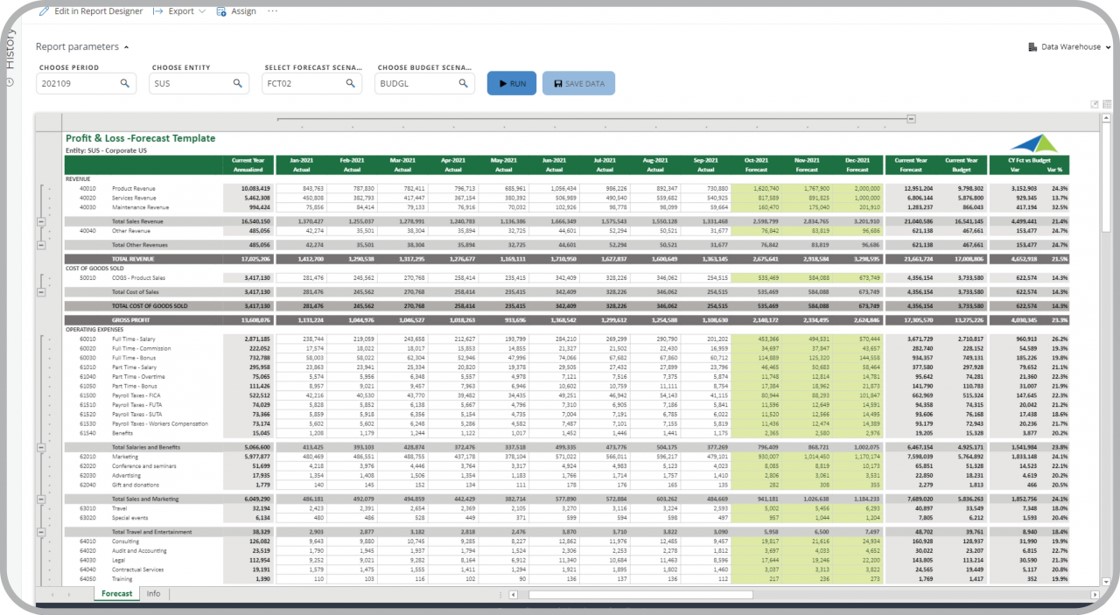
Using Profit & Loss Forecast Templates to Streamline the Forecasting Process
How can Automated Forecast Input Form s Drive Faster and Better Decisions? As Budget Managers ...
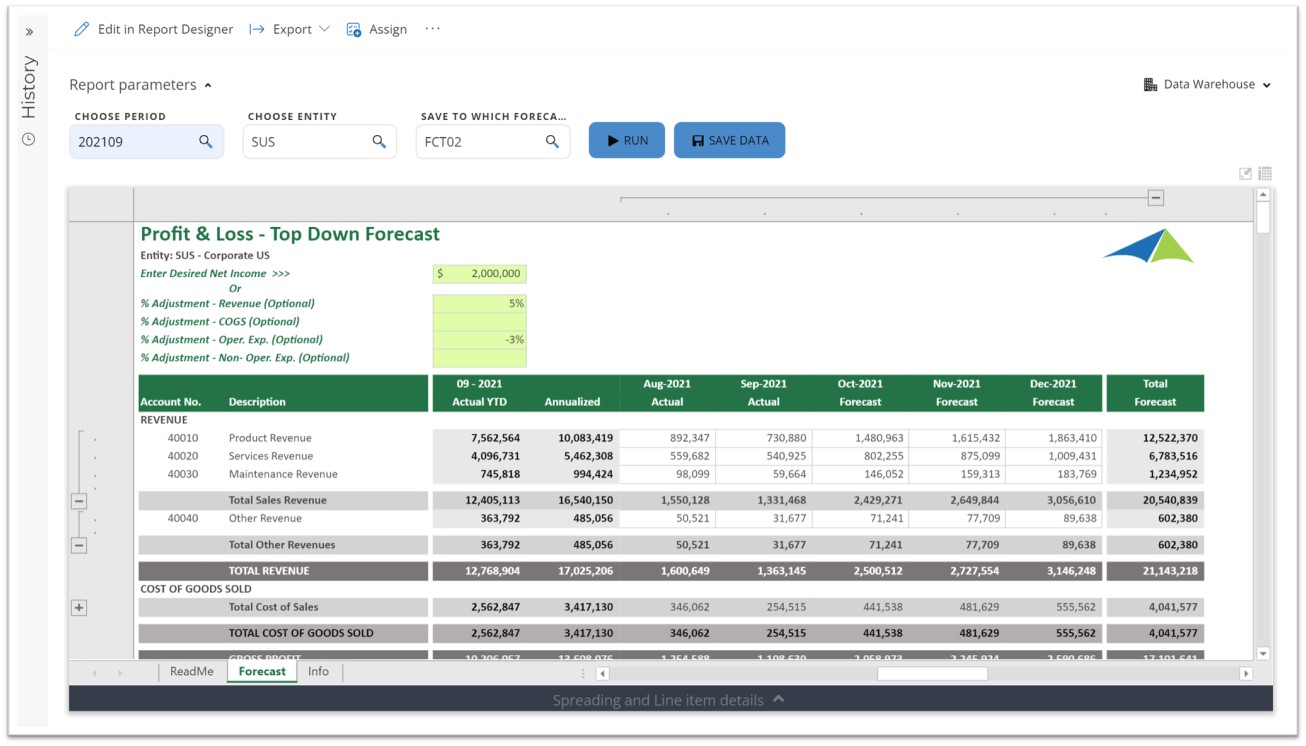
Using Profit & Loss Top Down Driver-based Forecasts to Streamline the Planning Process
How can Forecast Input Form s Drive Faster and Better Decisions? As Budget Managers increasingly ...
Using Balance Sheet Trend Reports to Streamline the Monthly Reporting Process
How can Financial Statement s Drive Faster and Better Decisions? As CFOs increasingly become key ...
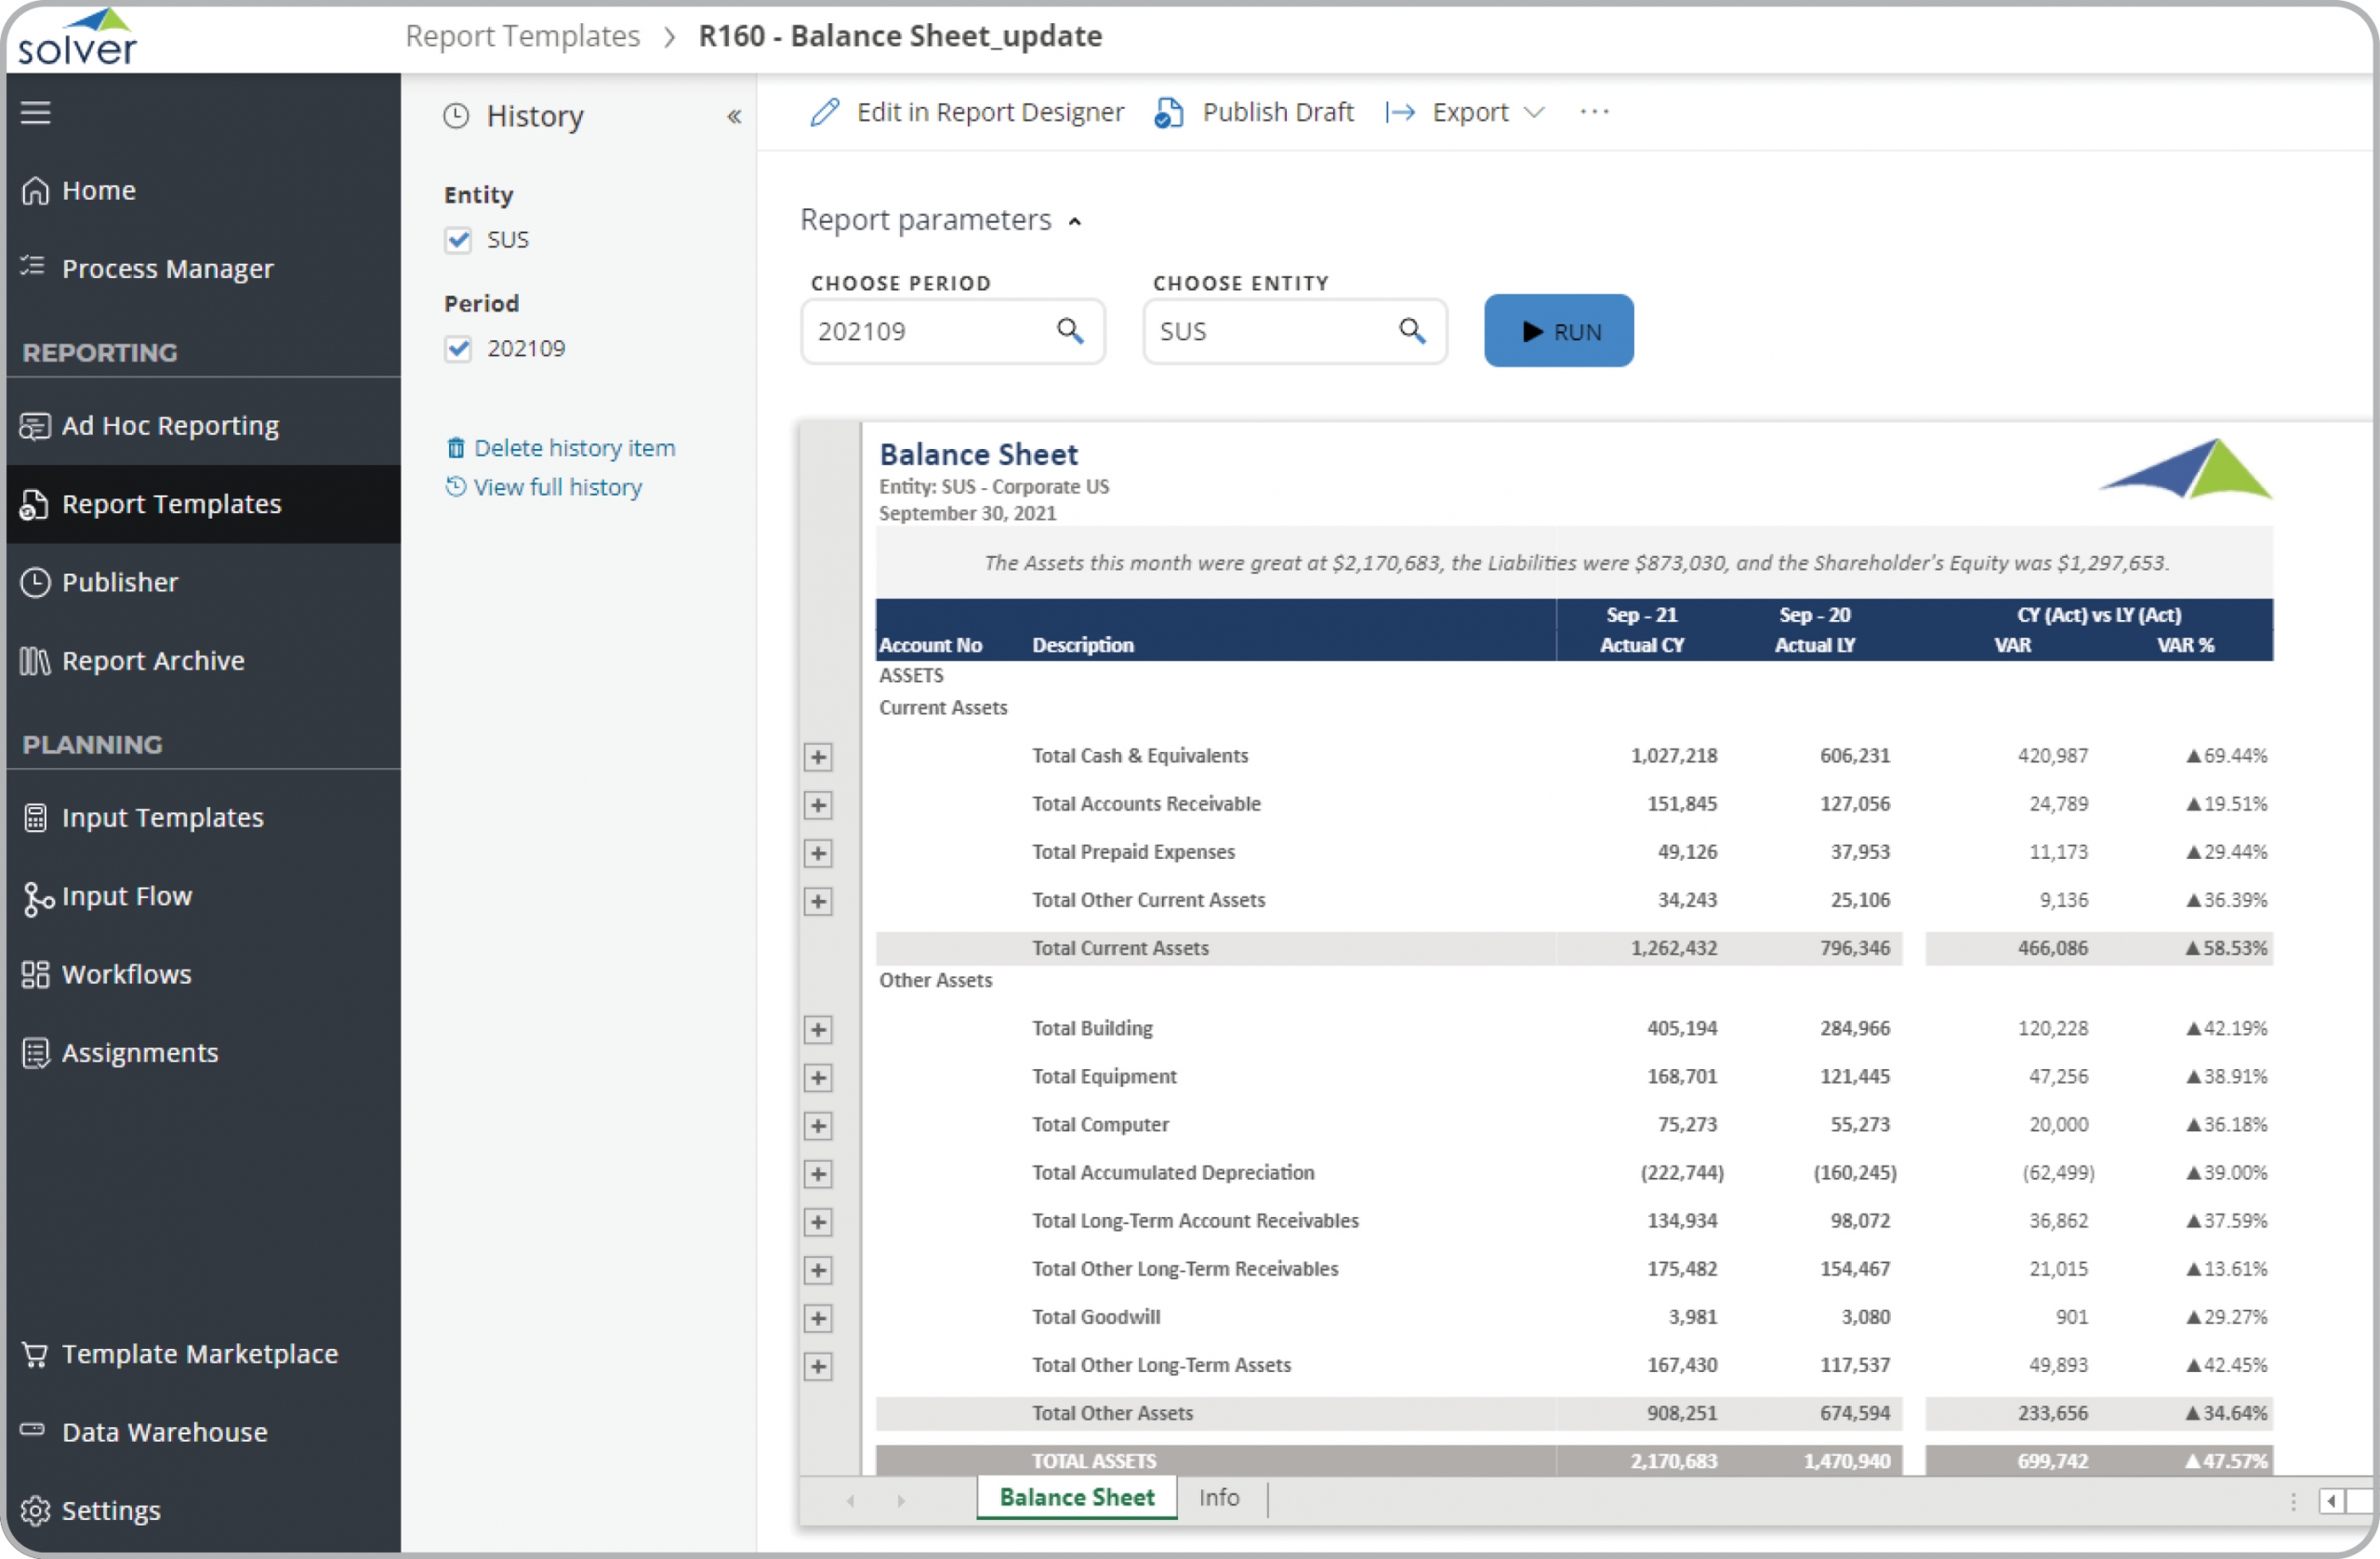
Using Balance Sheets with Comparison to Prior Year and Variances to Streamline the Monthly Reporting Process
How can Financial Statement s Drive Faster and Better Decisions? As Corporate Controllers ...
Using P&L Consolidation Reports with Breakdown by Company to Streamline the Monthly Reporting Process
How can Financial Statement s Drive Faster and Better Decisions? As Corporate Controllers ...
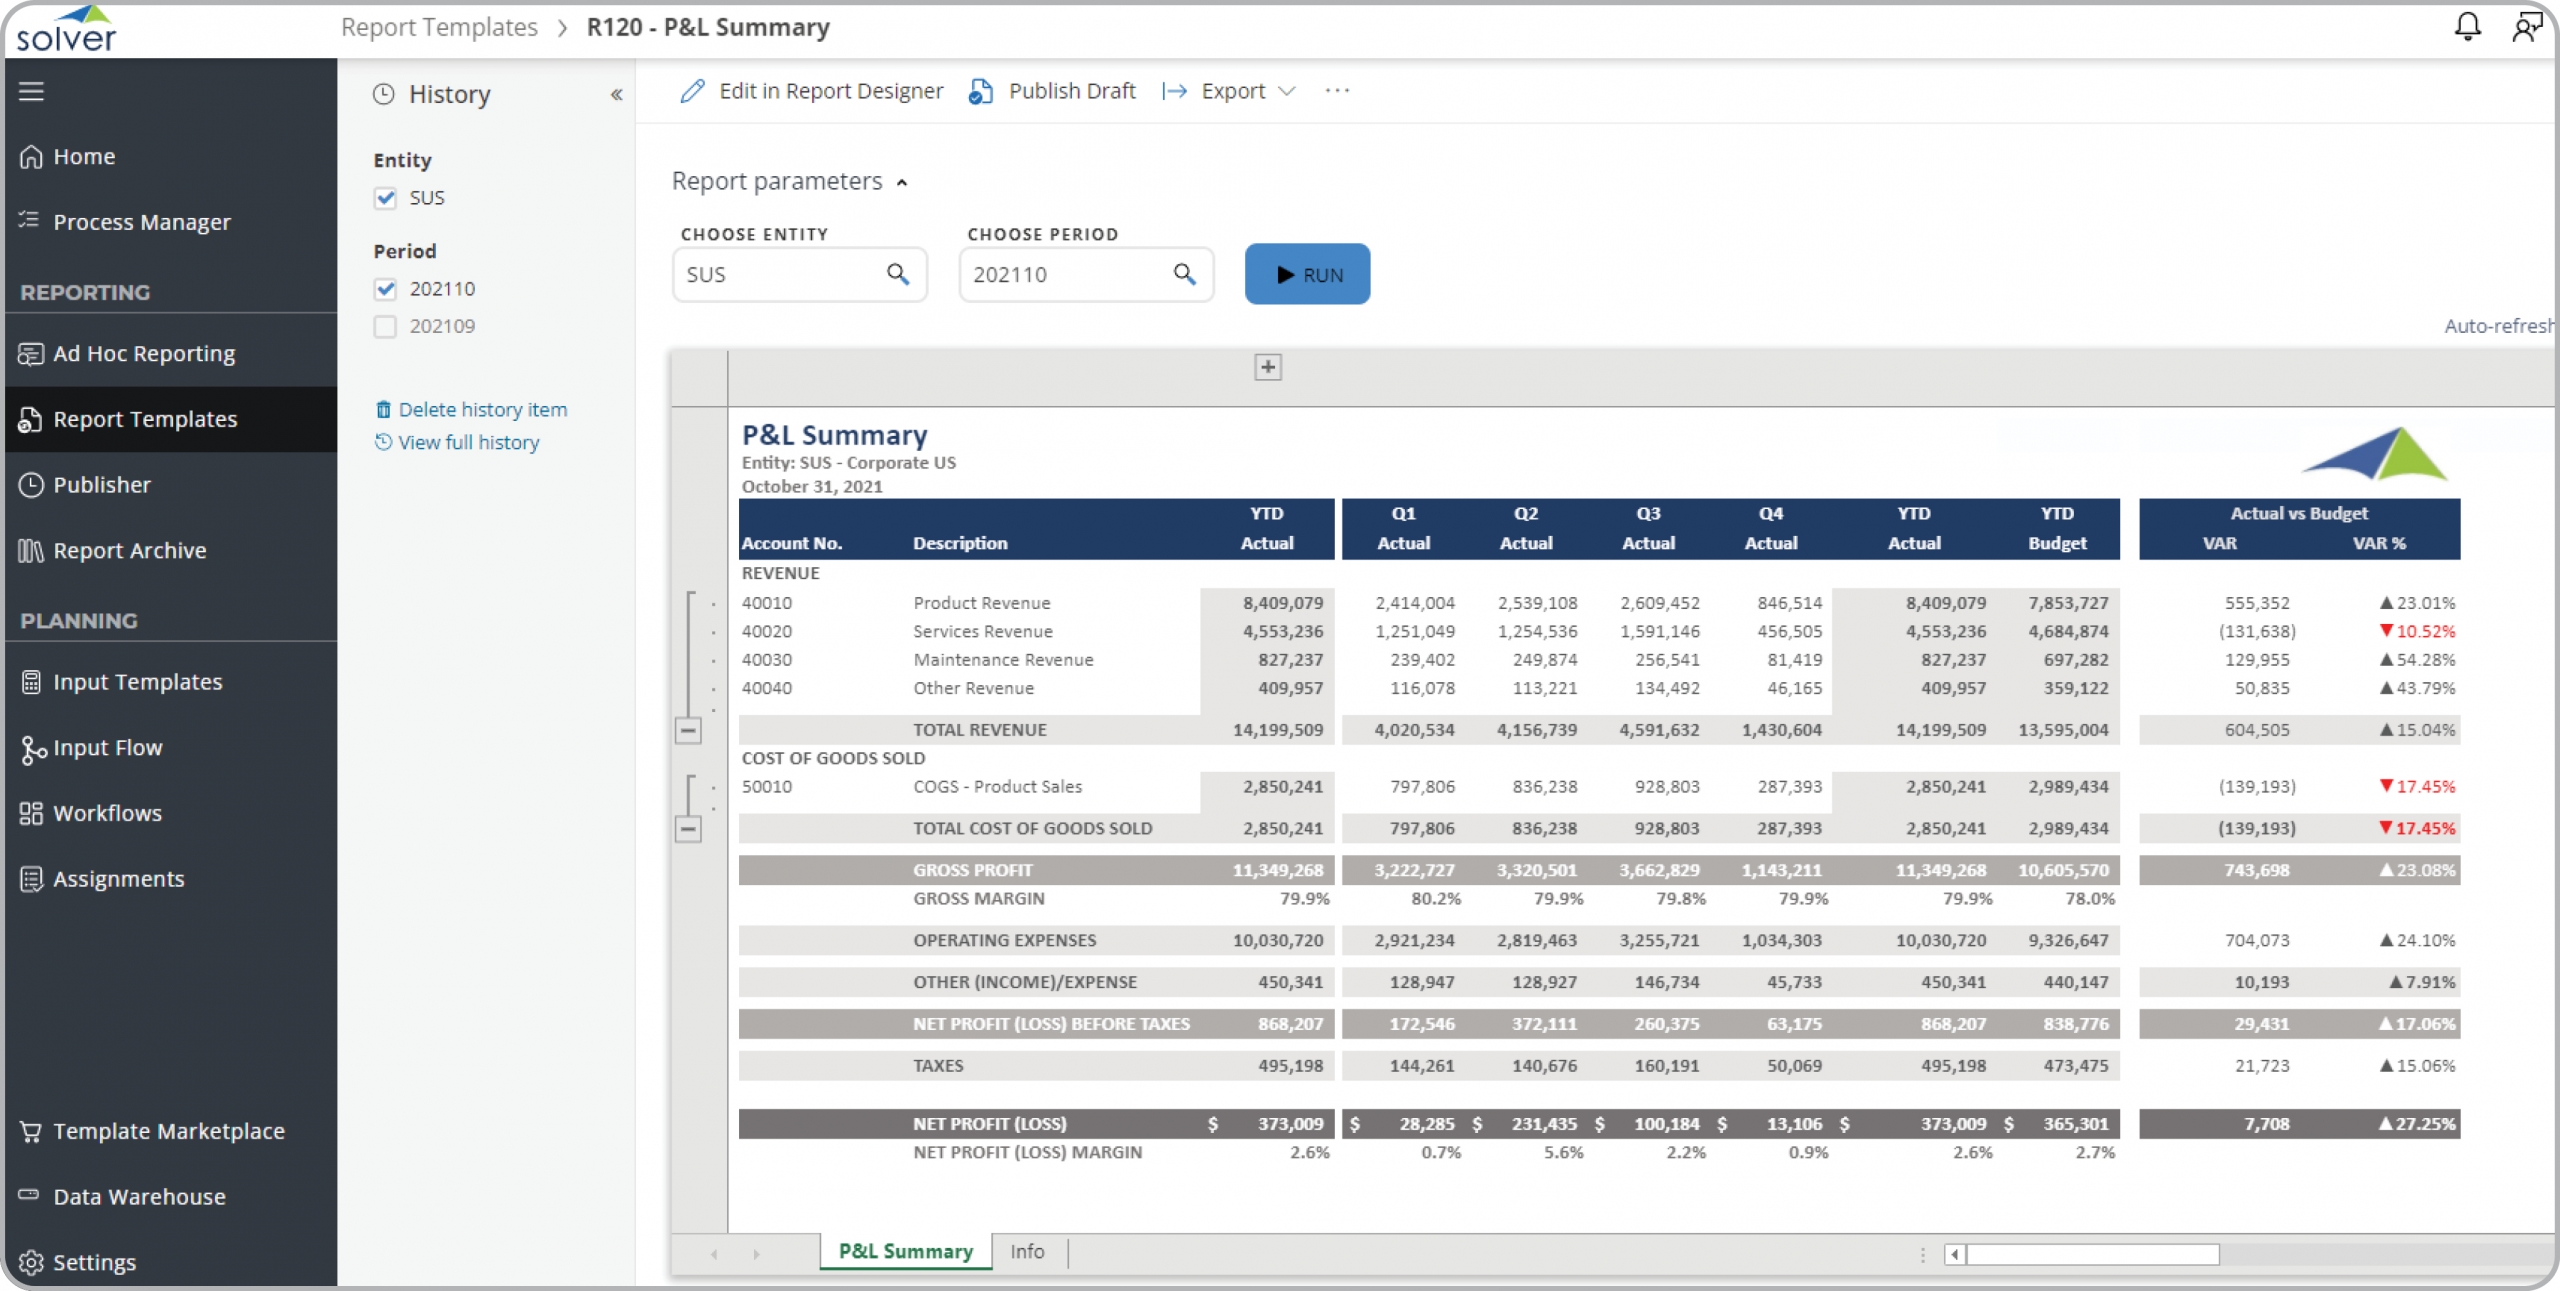
Using P&L Summary Reports with Monthly and by Quarterly Details to Streamline the Monthly Reporting Process
How can Financial Statement s Drive Faster and Better Decisions? As CFOs increasingly become key ...
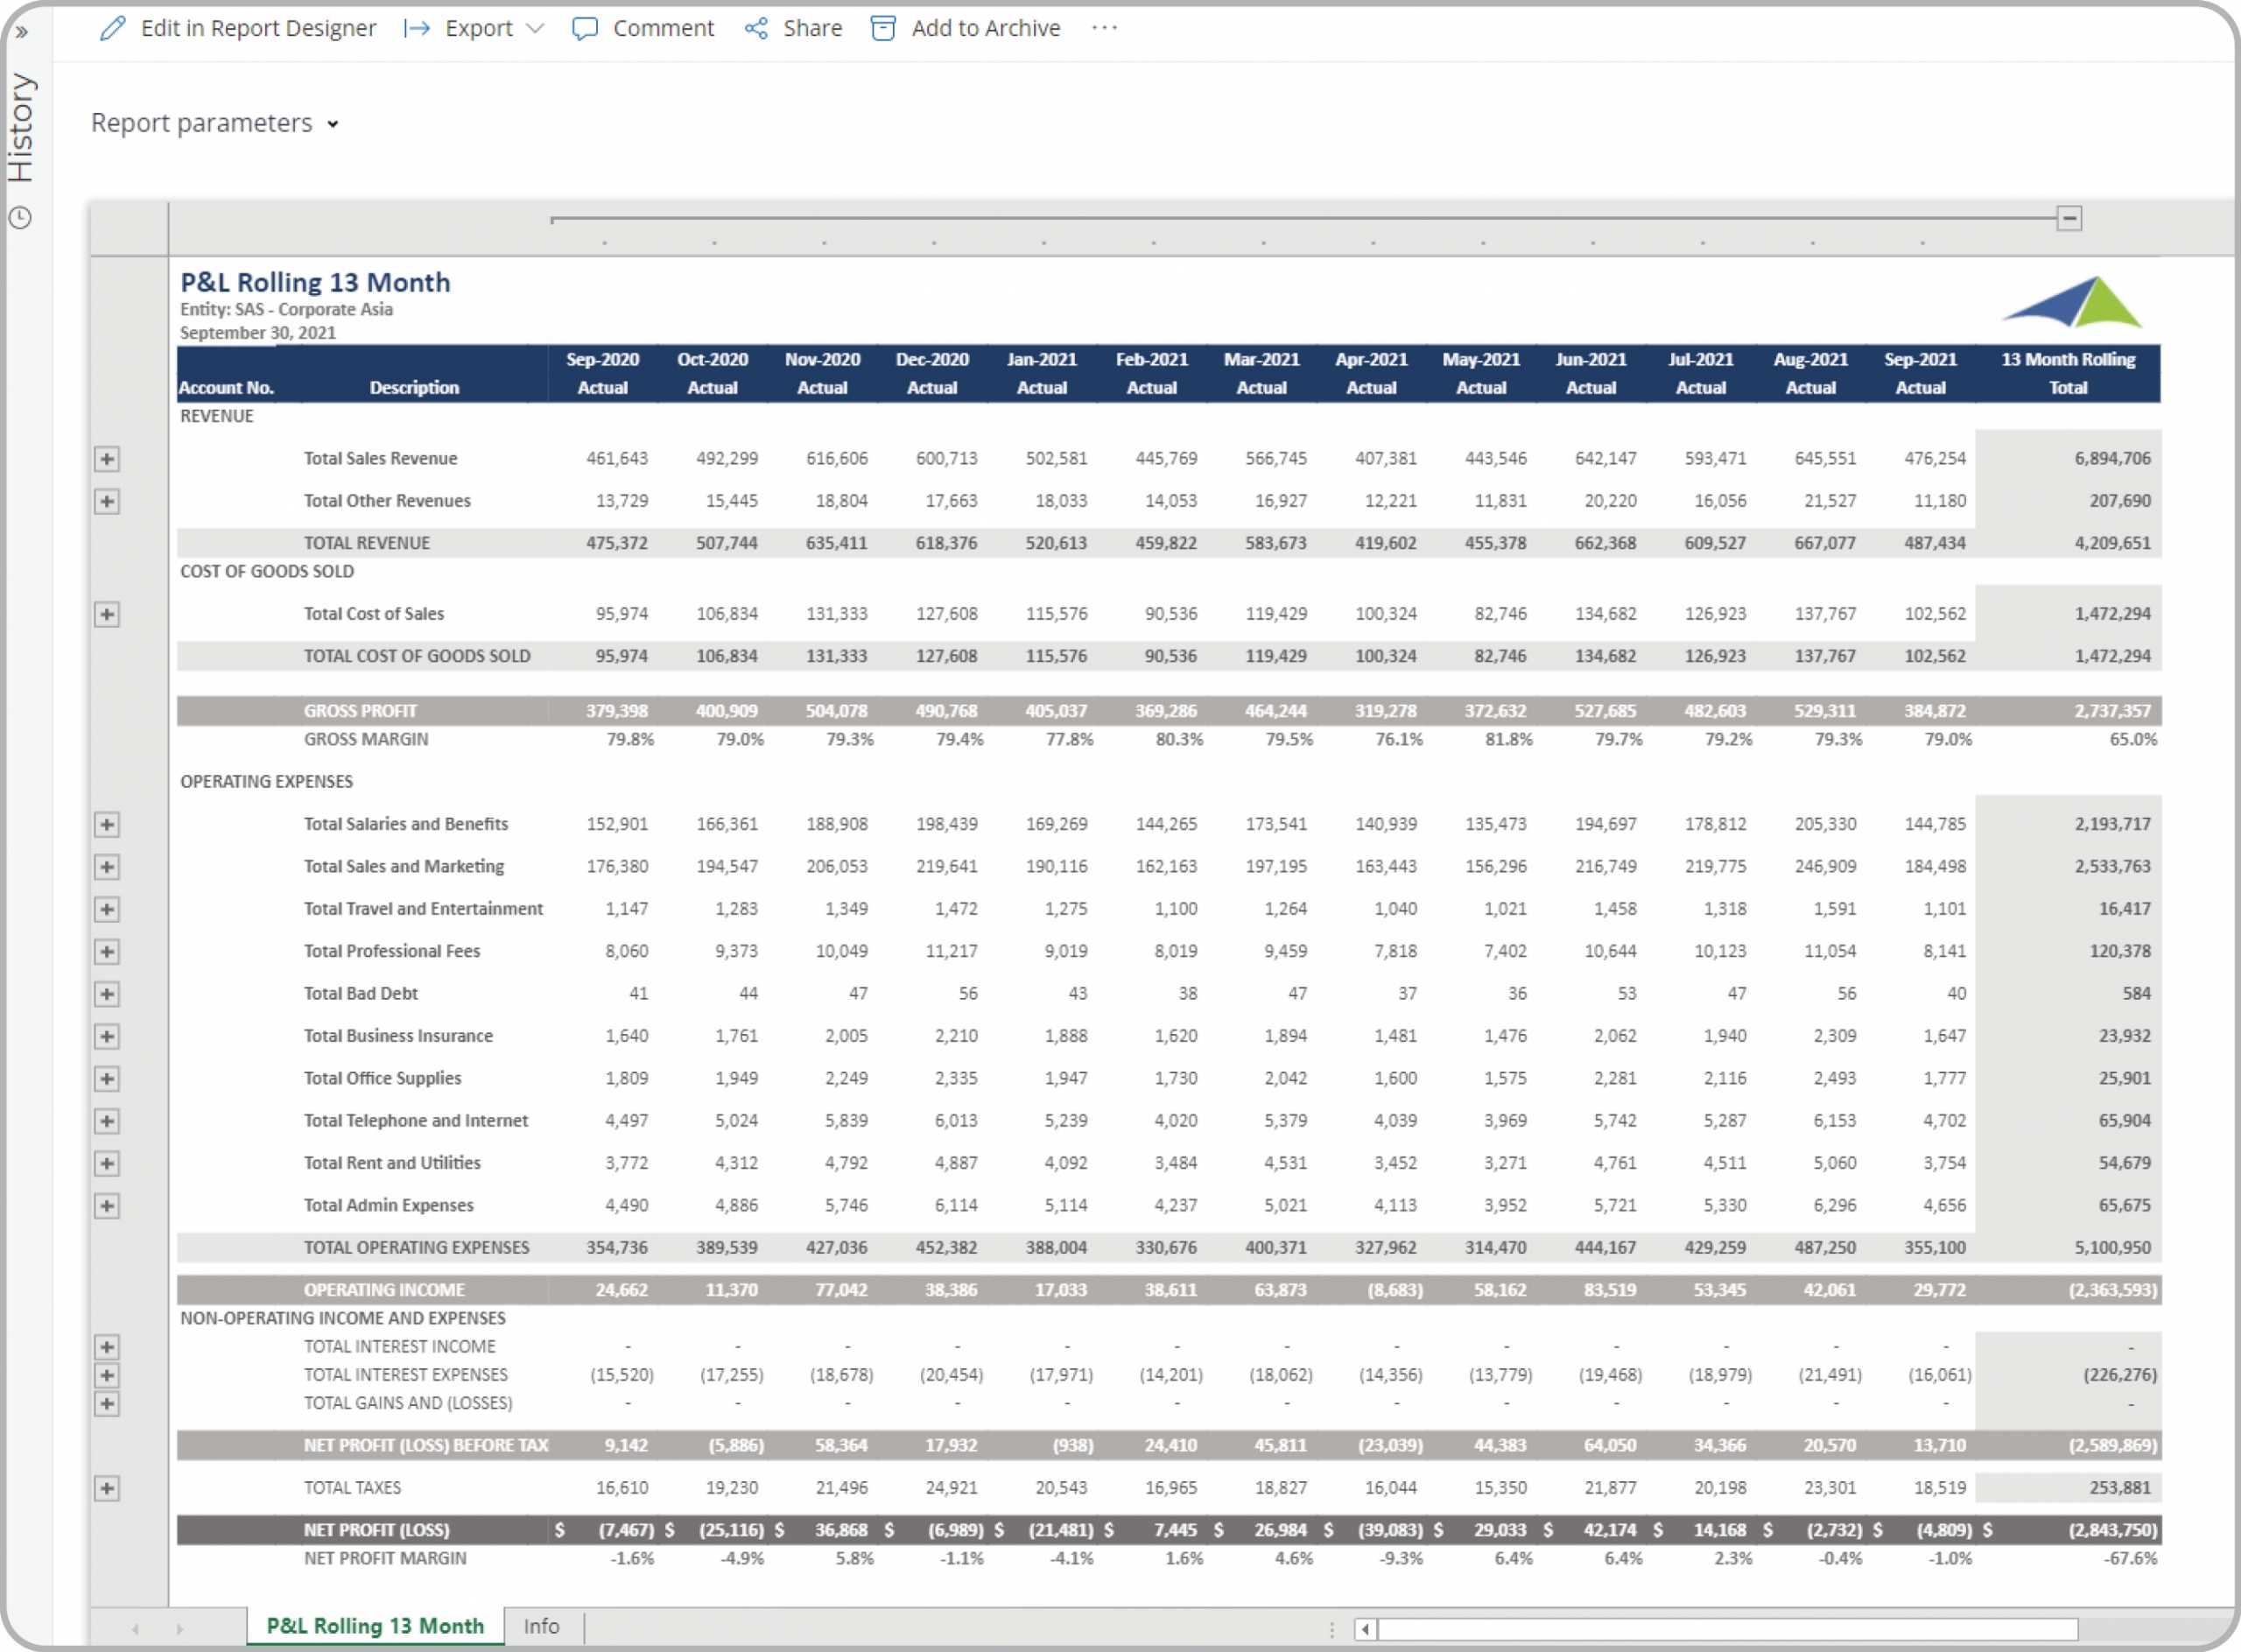
Using Rolling 13 Month P&L Trend Reports to Streamline the Monthly Reporting Process
How can Financial Statement s Drive Faster and Better Decisions? As CFOs increasingly become key ...
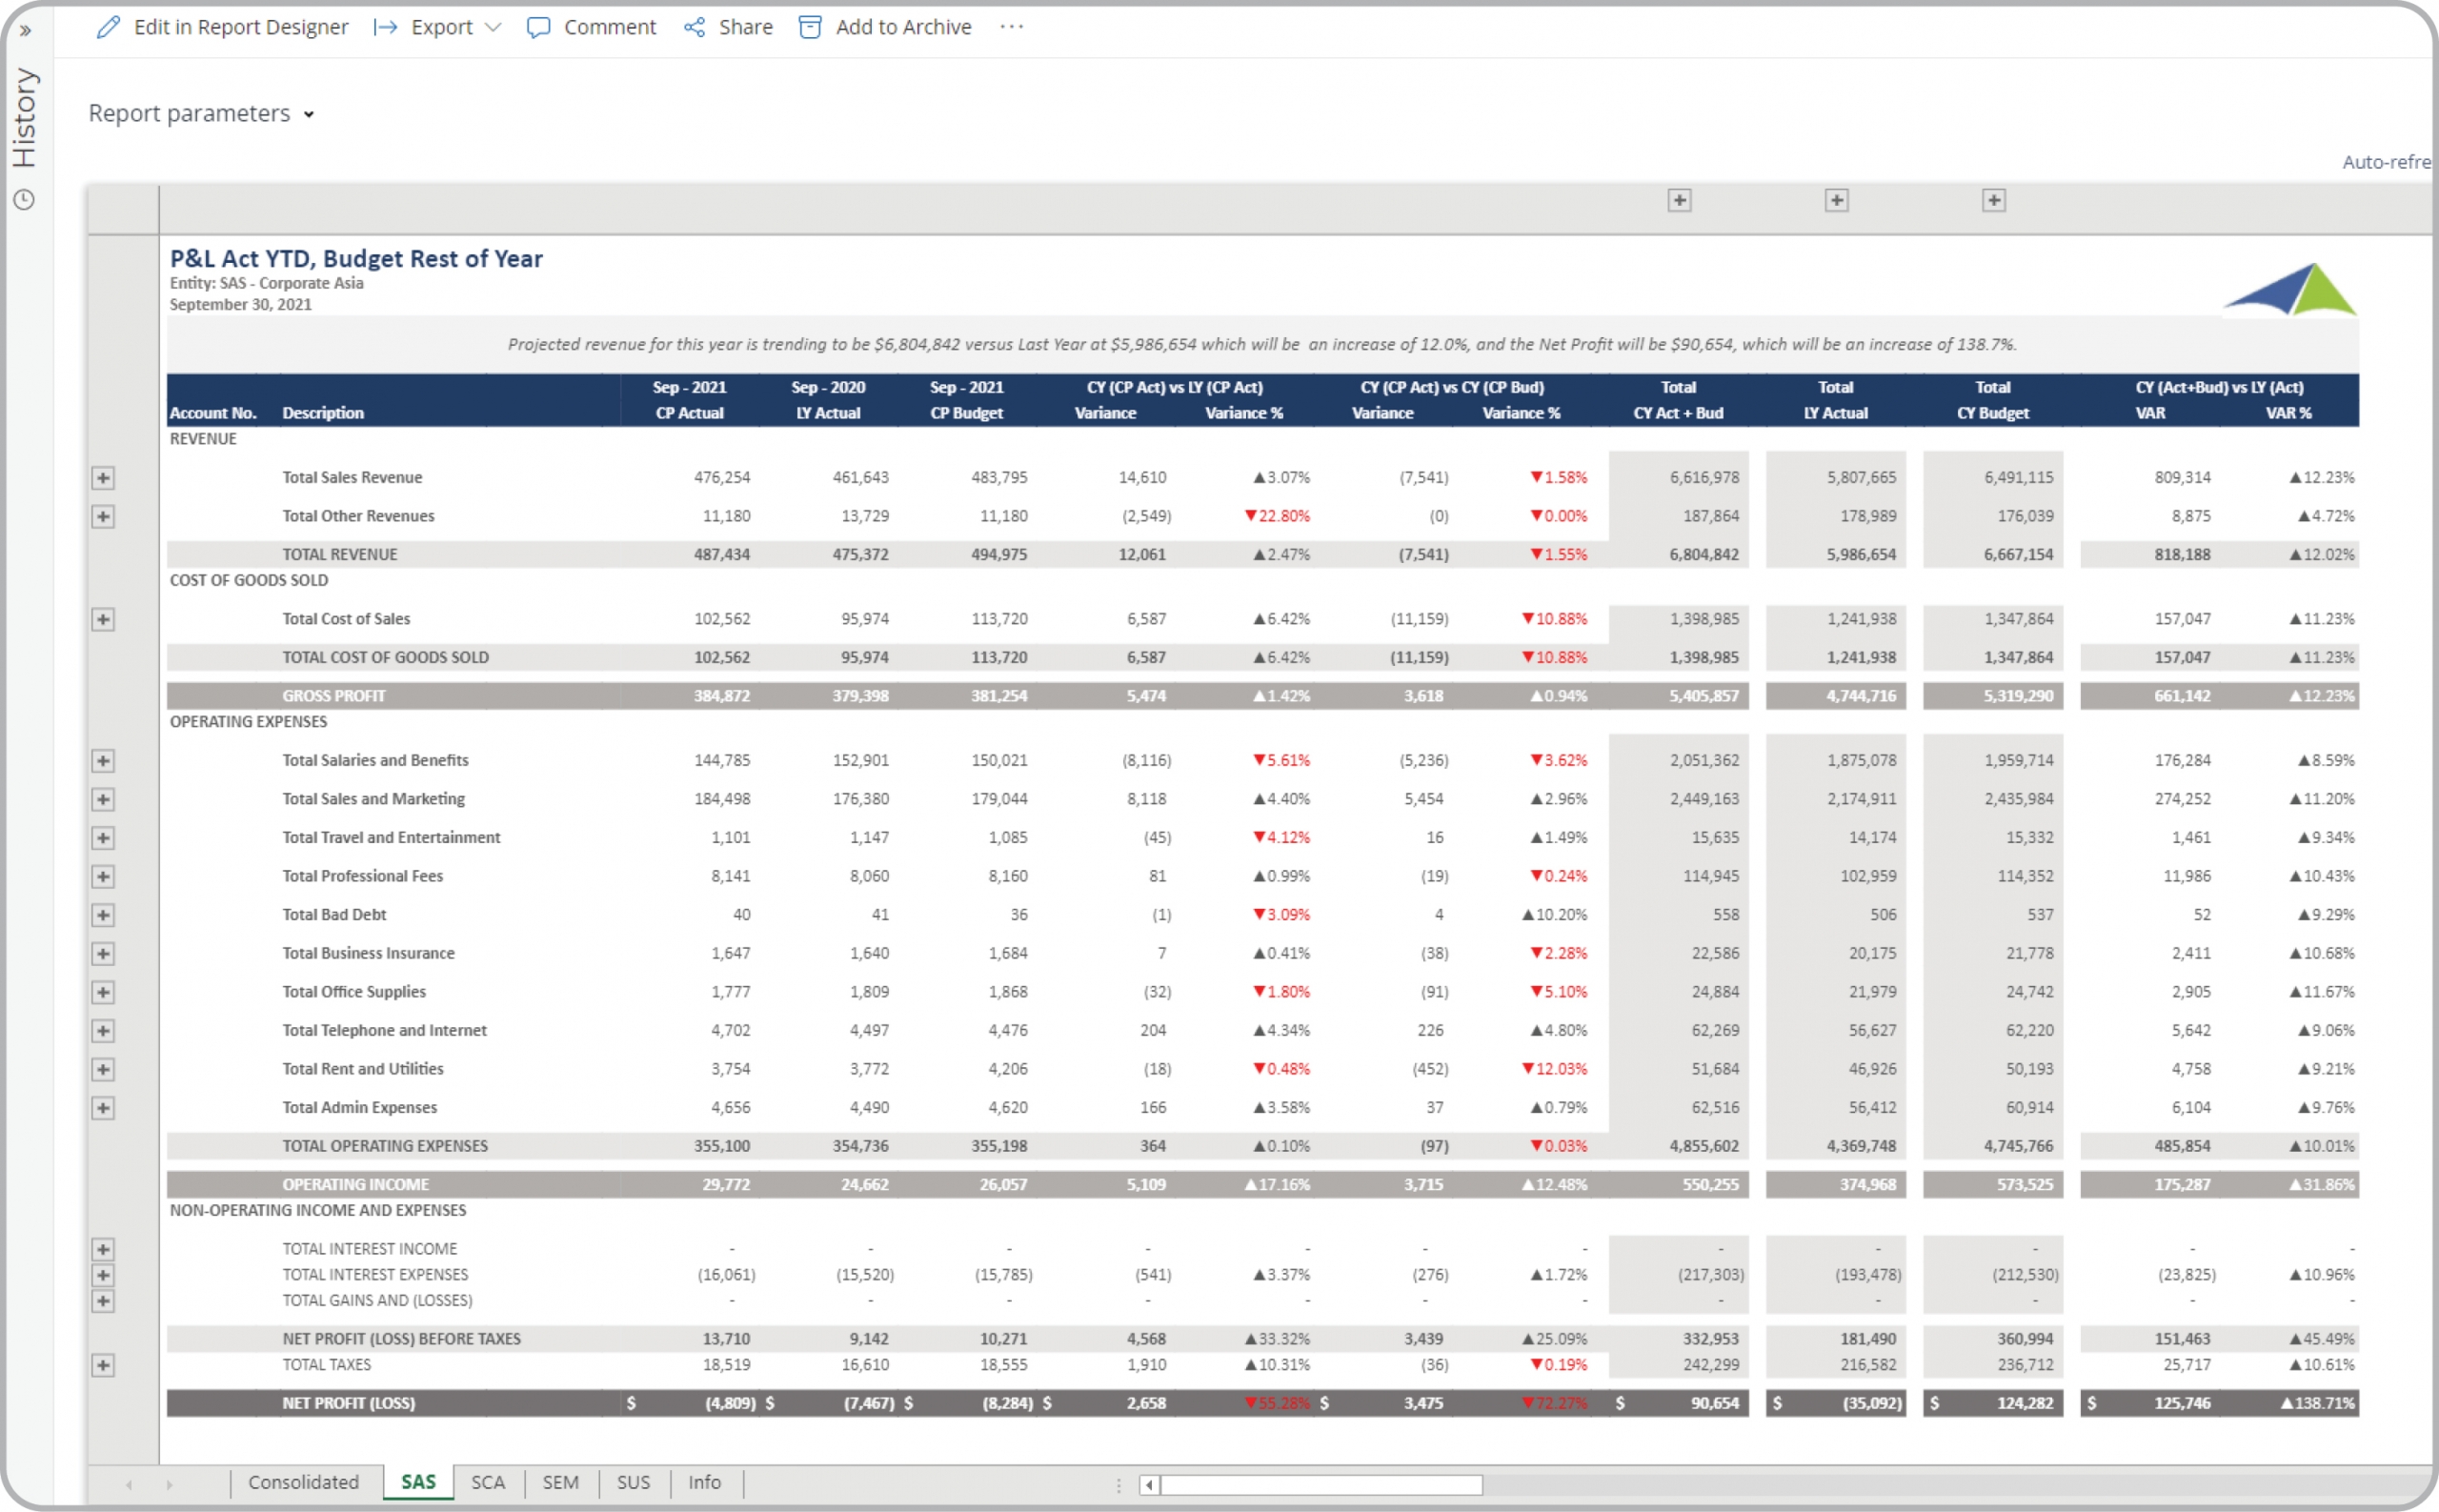
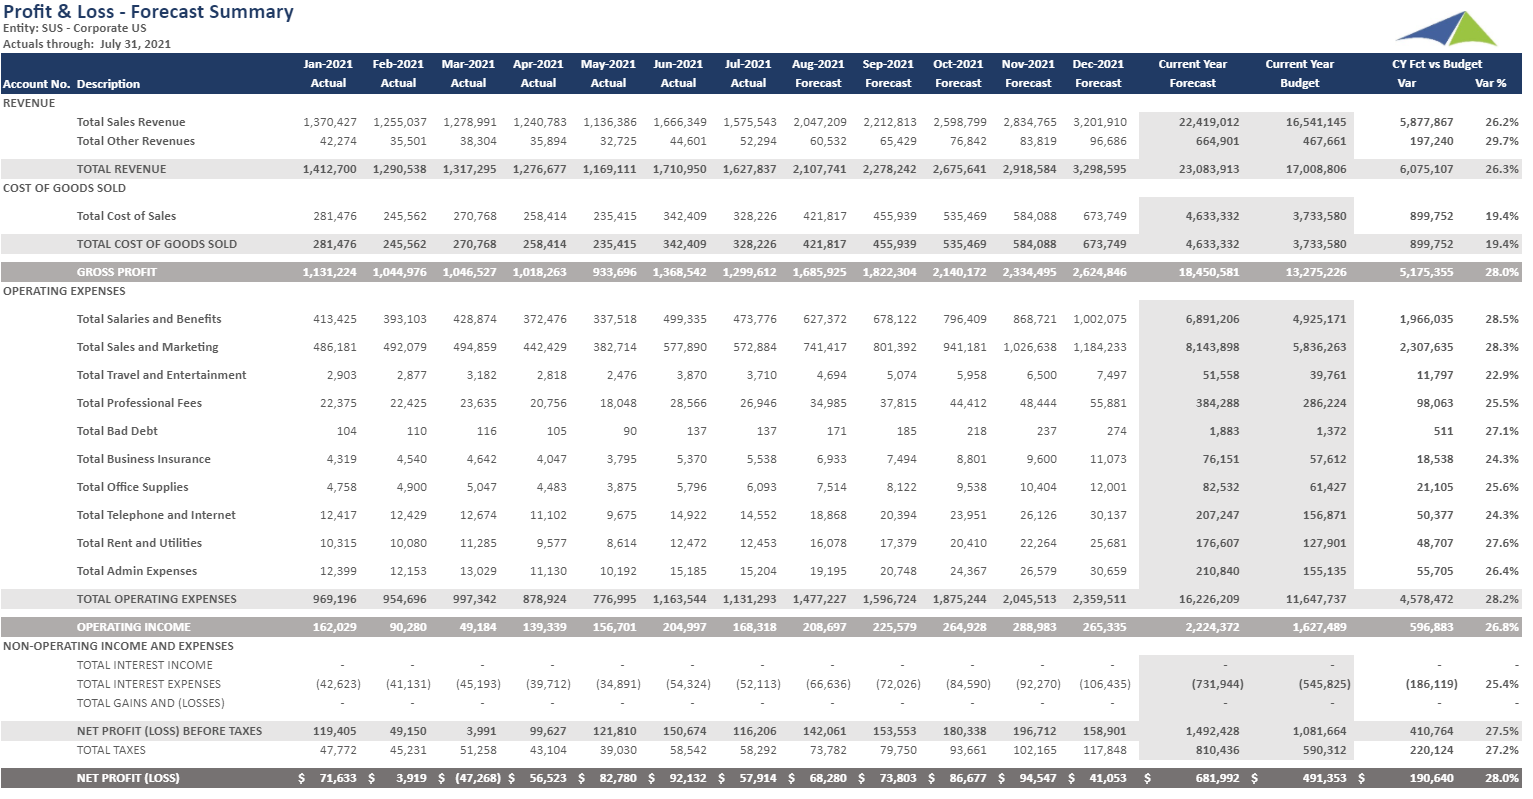
Using P&L Reports with Forecasts and Budgets to Streamline the Monthly Reporting Process
How can Financial Statement s Drive Faster and Better Decisions? As CFOs increasingly become key ...
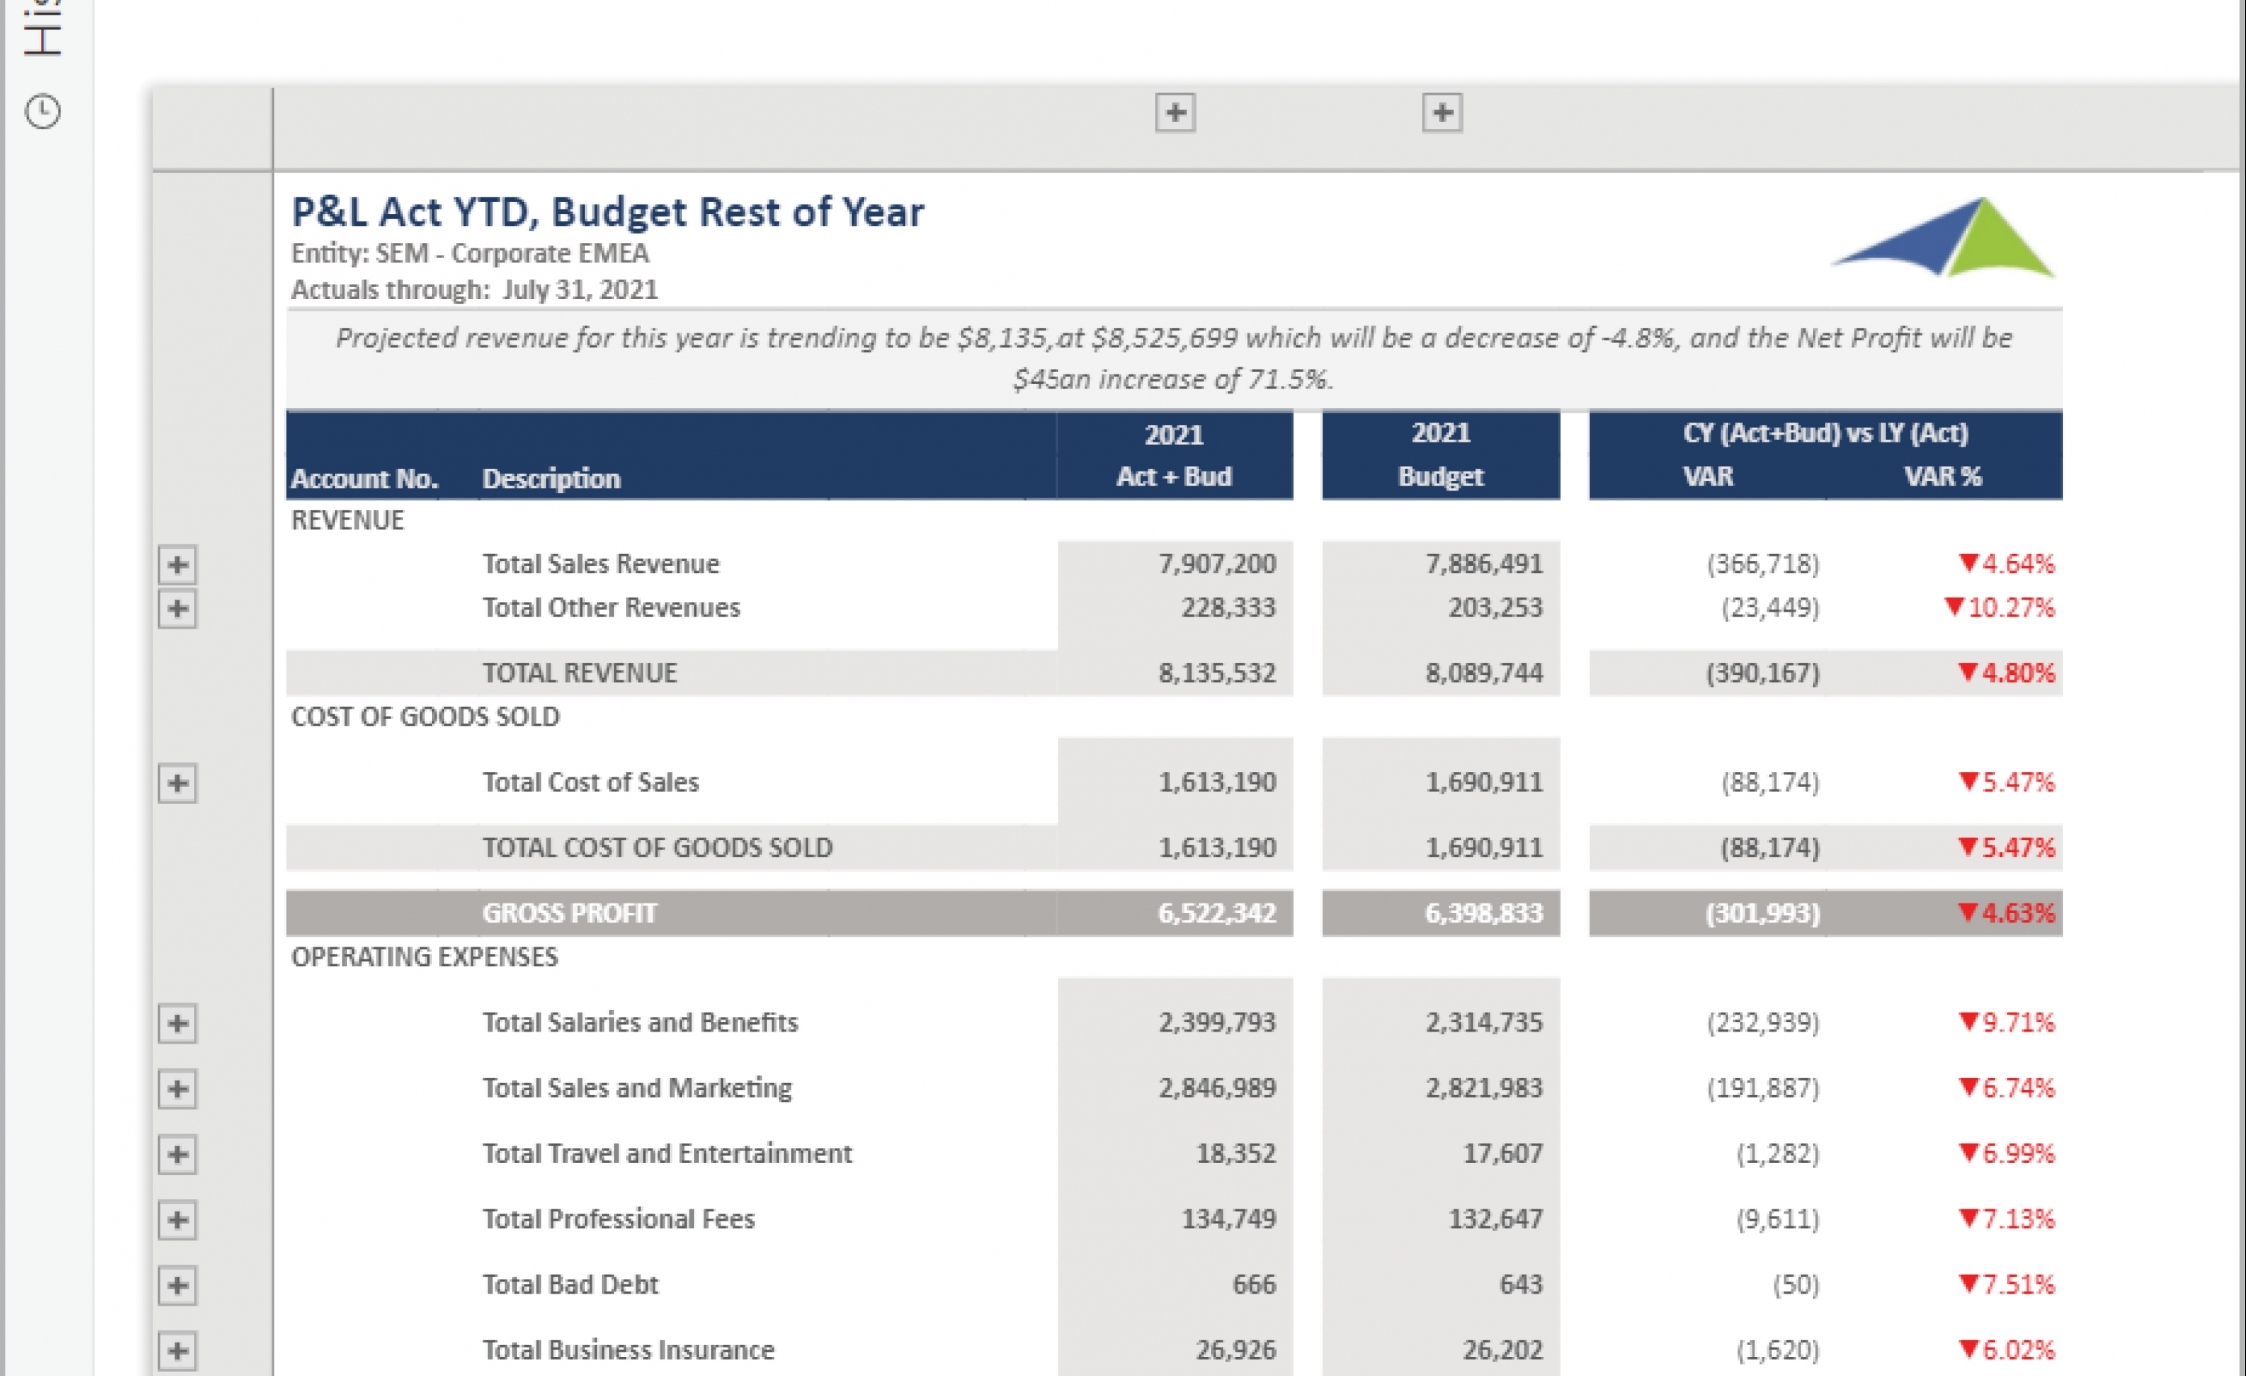
Using a P&L Report with Automated Full Year Estimates to Streamline the Monthly Reporting Process
How can Financial Statement s Drive Faster and Better Decisions? As CFOs increasingly become key ...
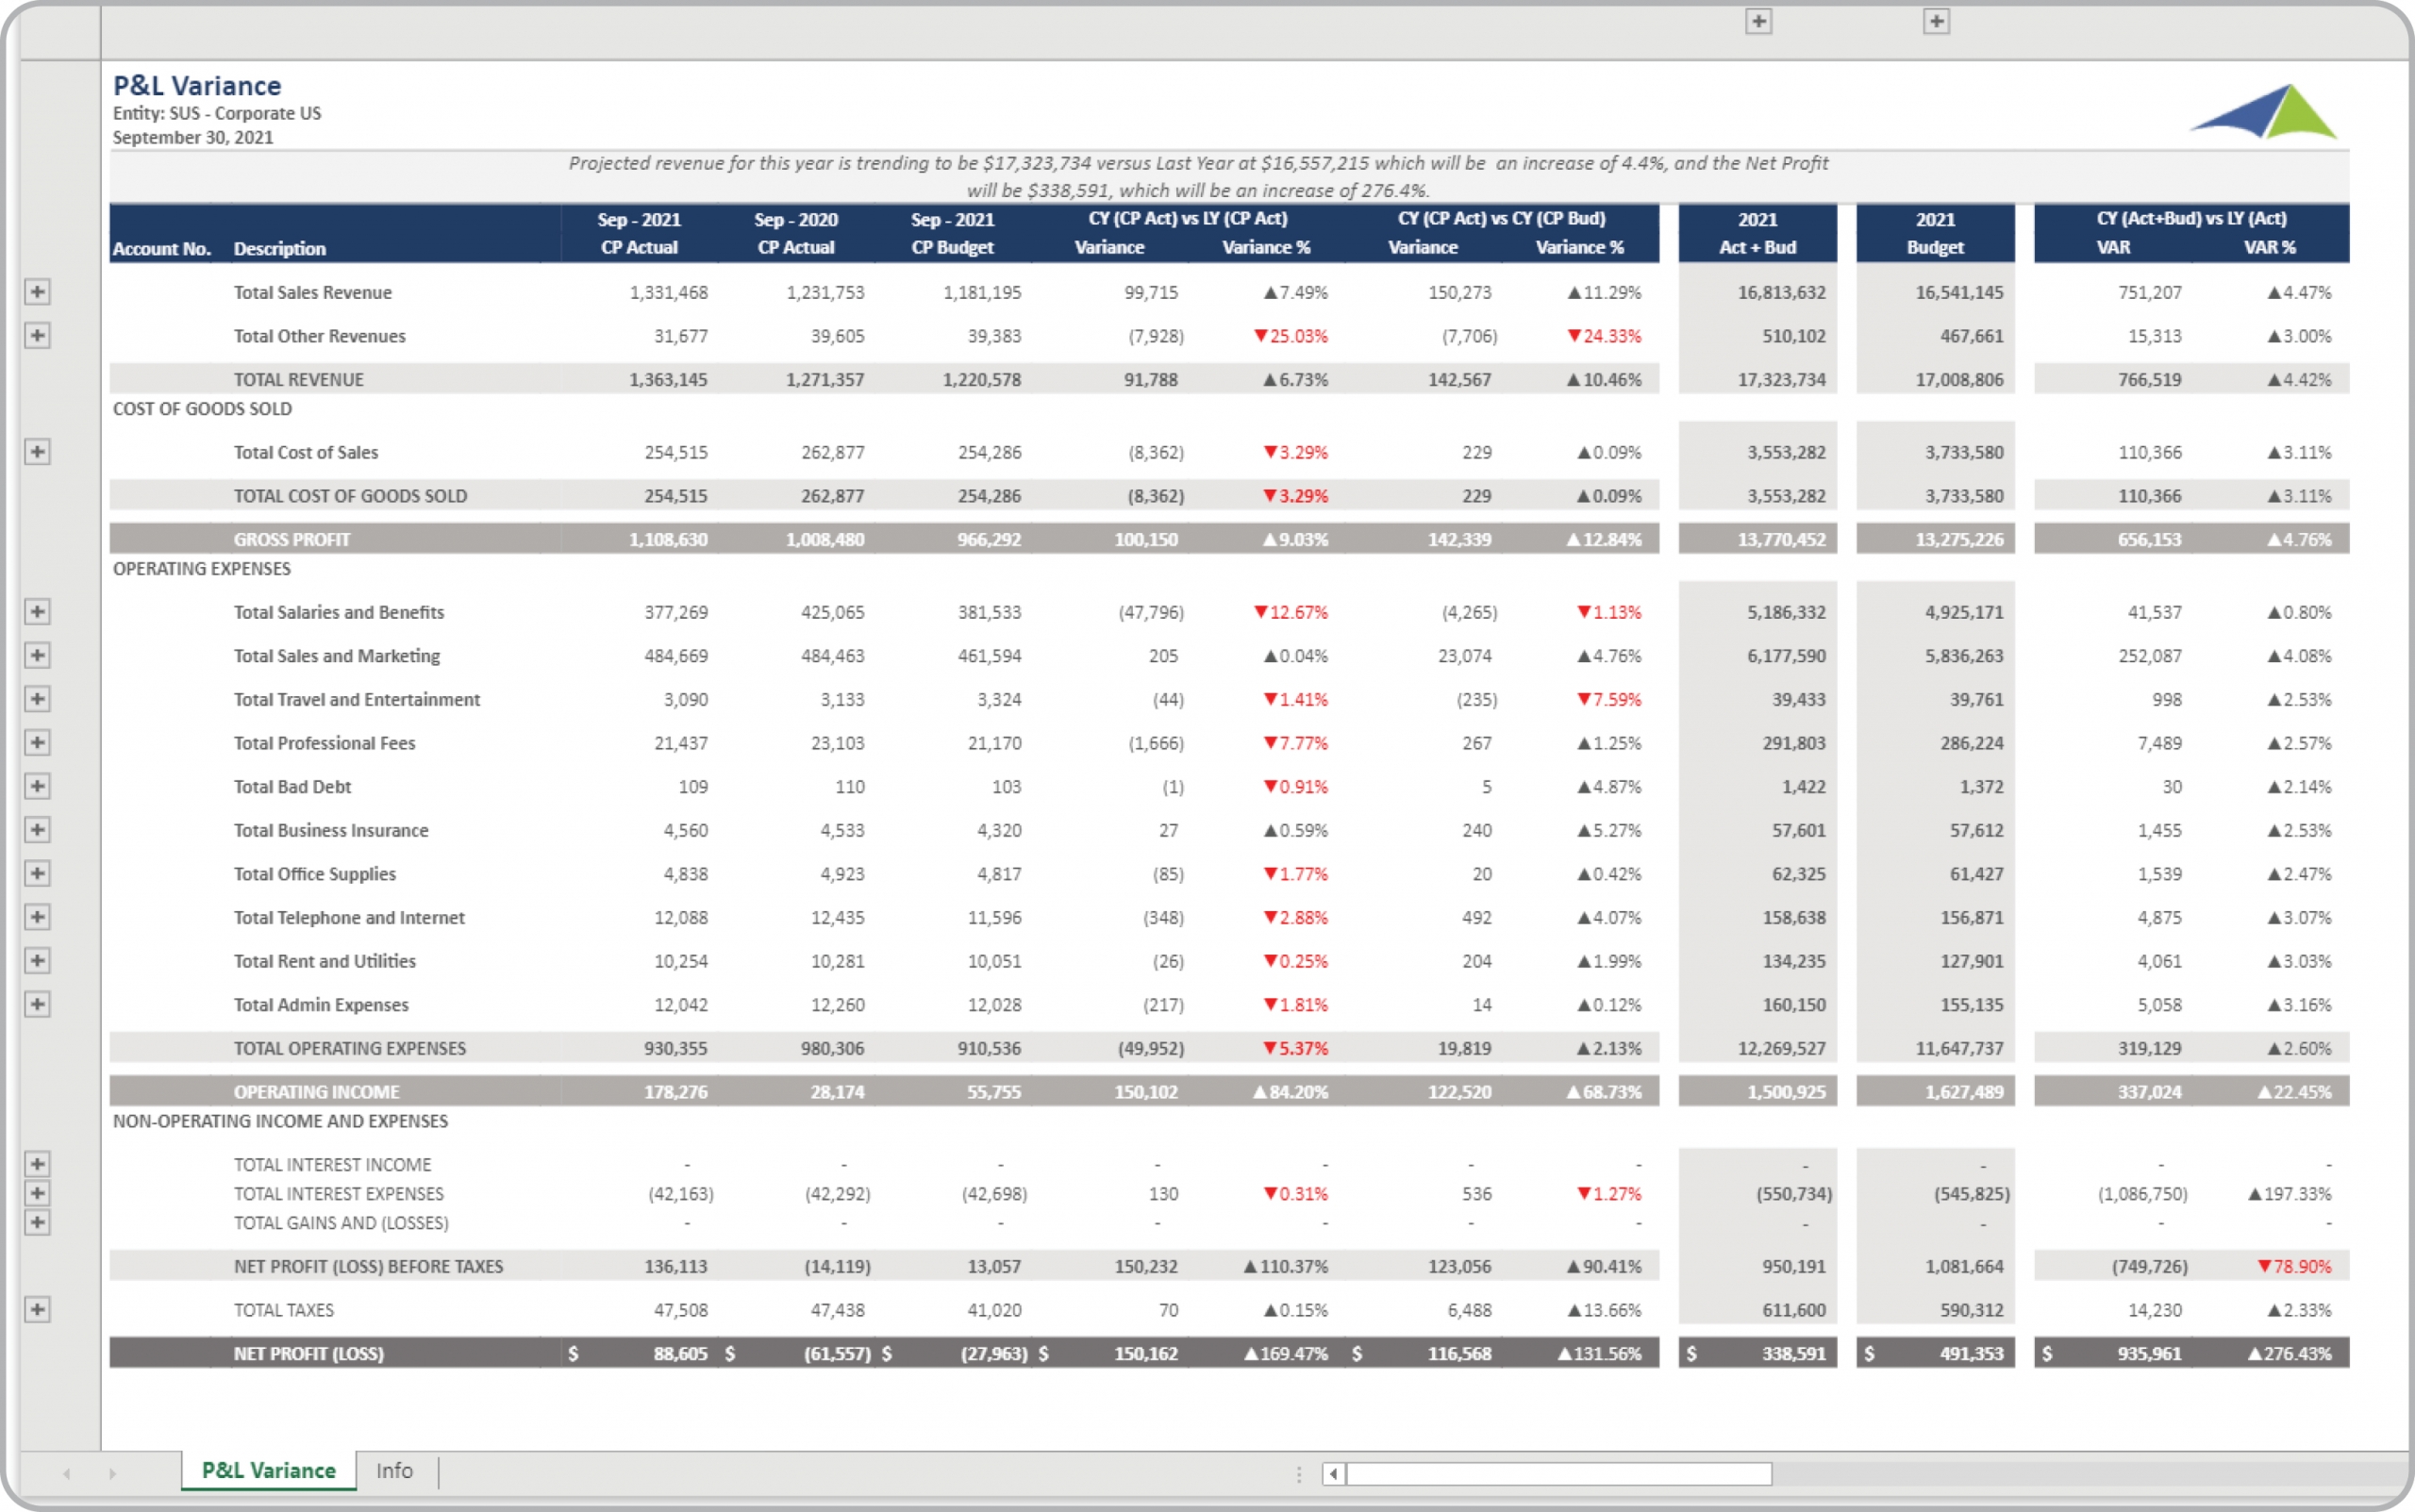
Using Profit & Loss Variance Reports to Streamline the Monthly Reporting Process
How can Financial Statement s Drive Faster and Better Decisions? As Corporate Controllers ...
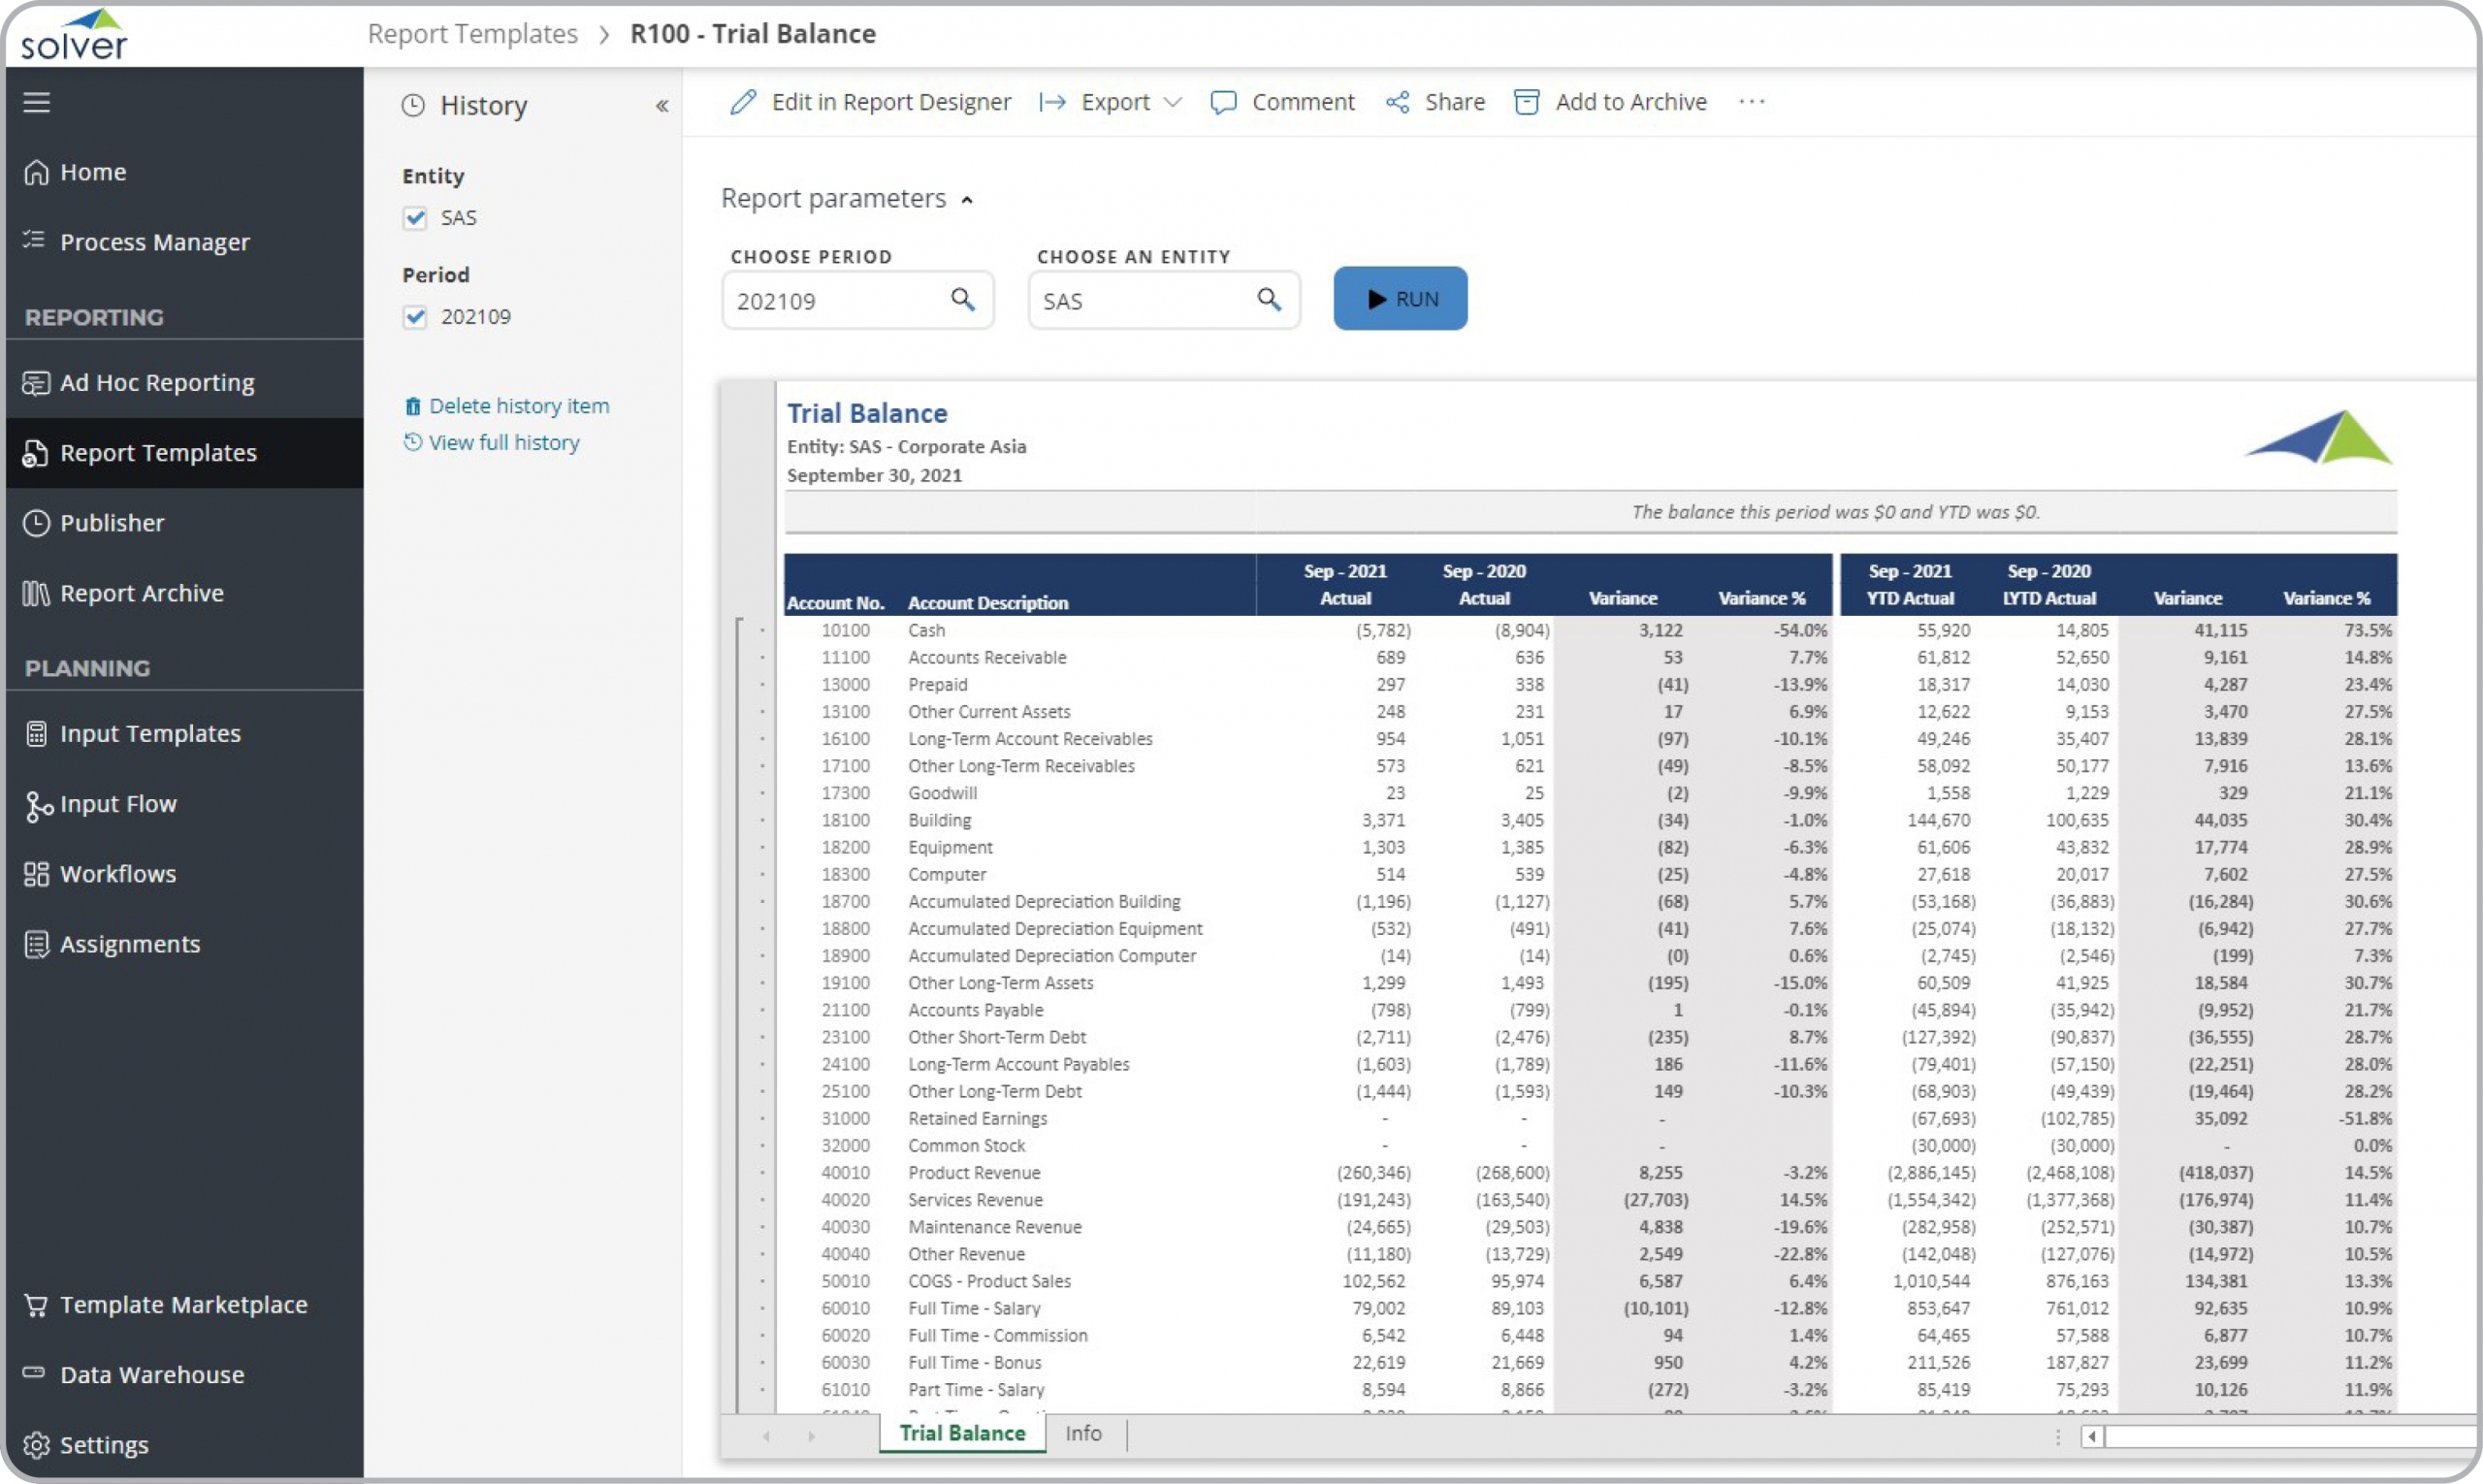
Using Trial Balance Variance Reports to Streamline the Monthly Reporting Process
How can Financial Statement s Drive Faster and Better Decisions? As Corporate Controllers ...
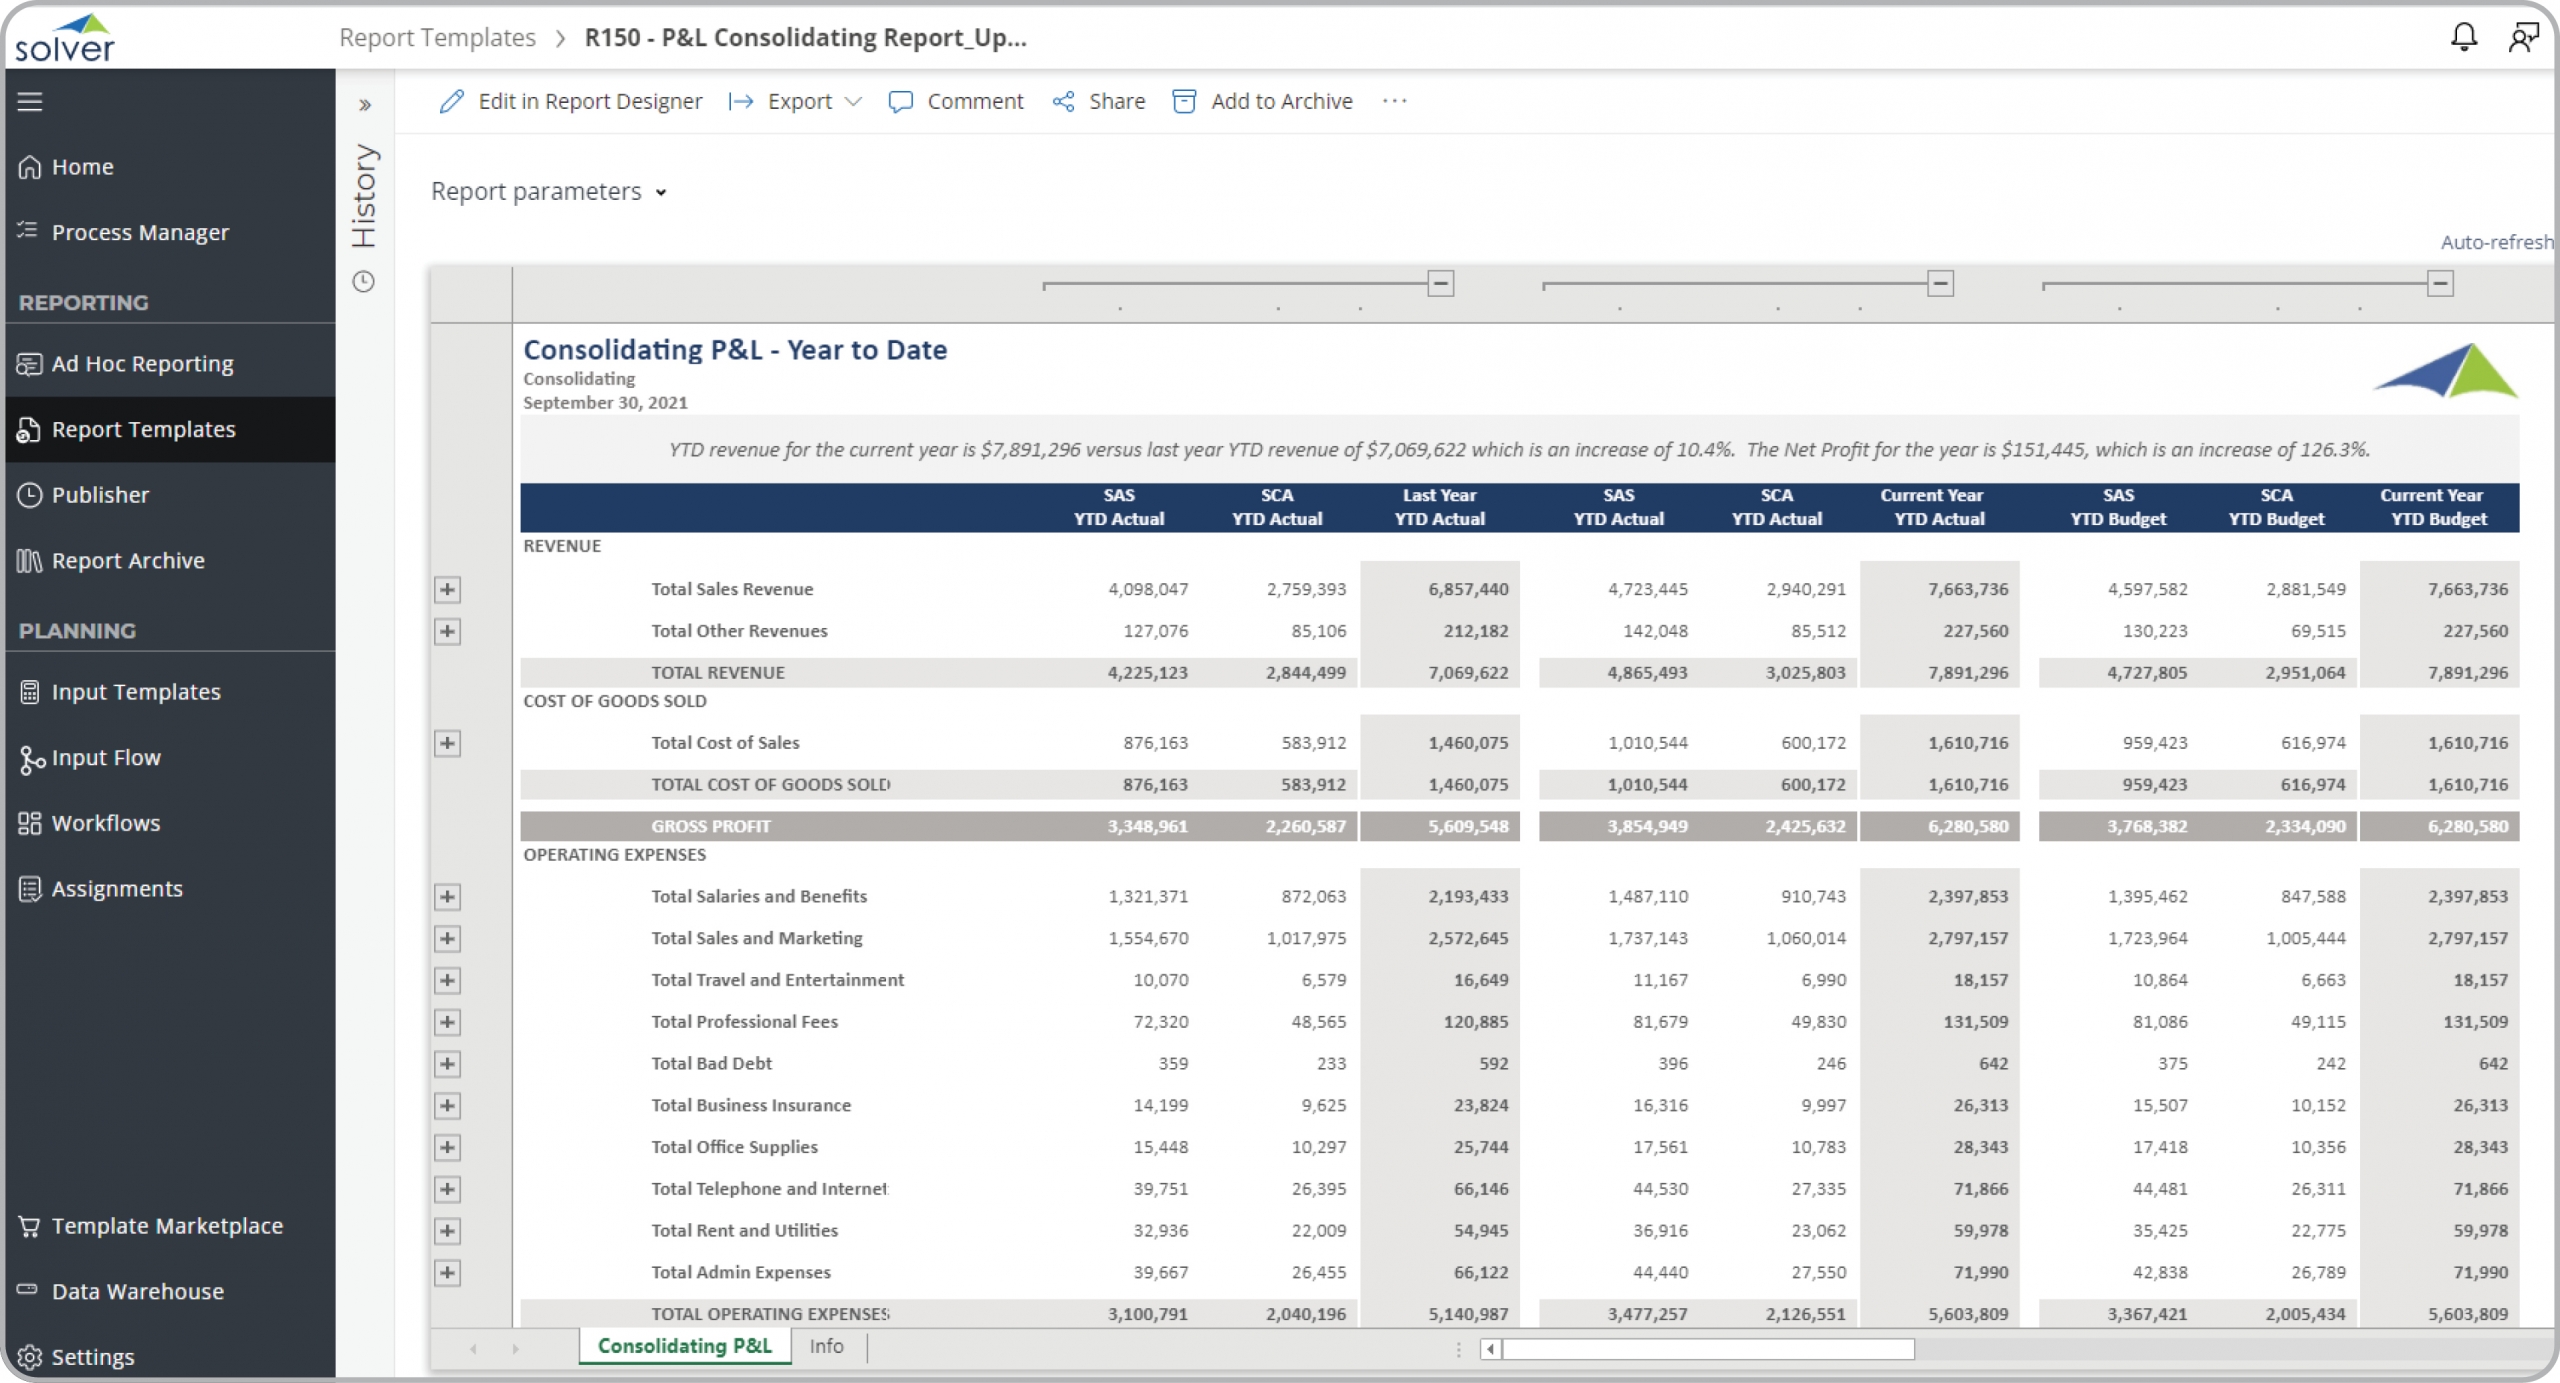
Using Consolidating Profit & loss Reports to Streamline the Monthly Reporting Process
How can Financial Statement s Drive Faster and Better Decisions? As Corporate Controllers ...
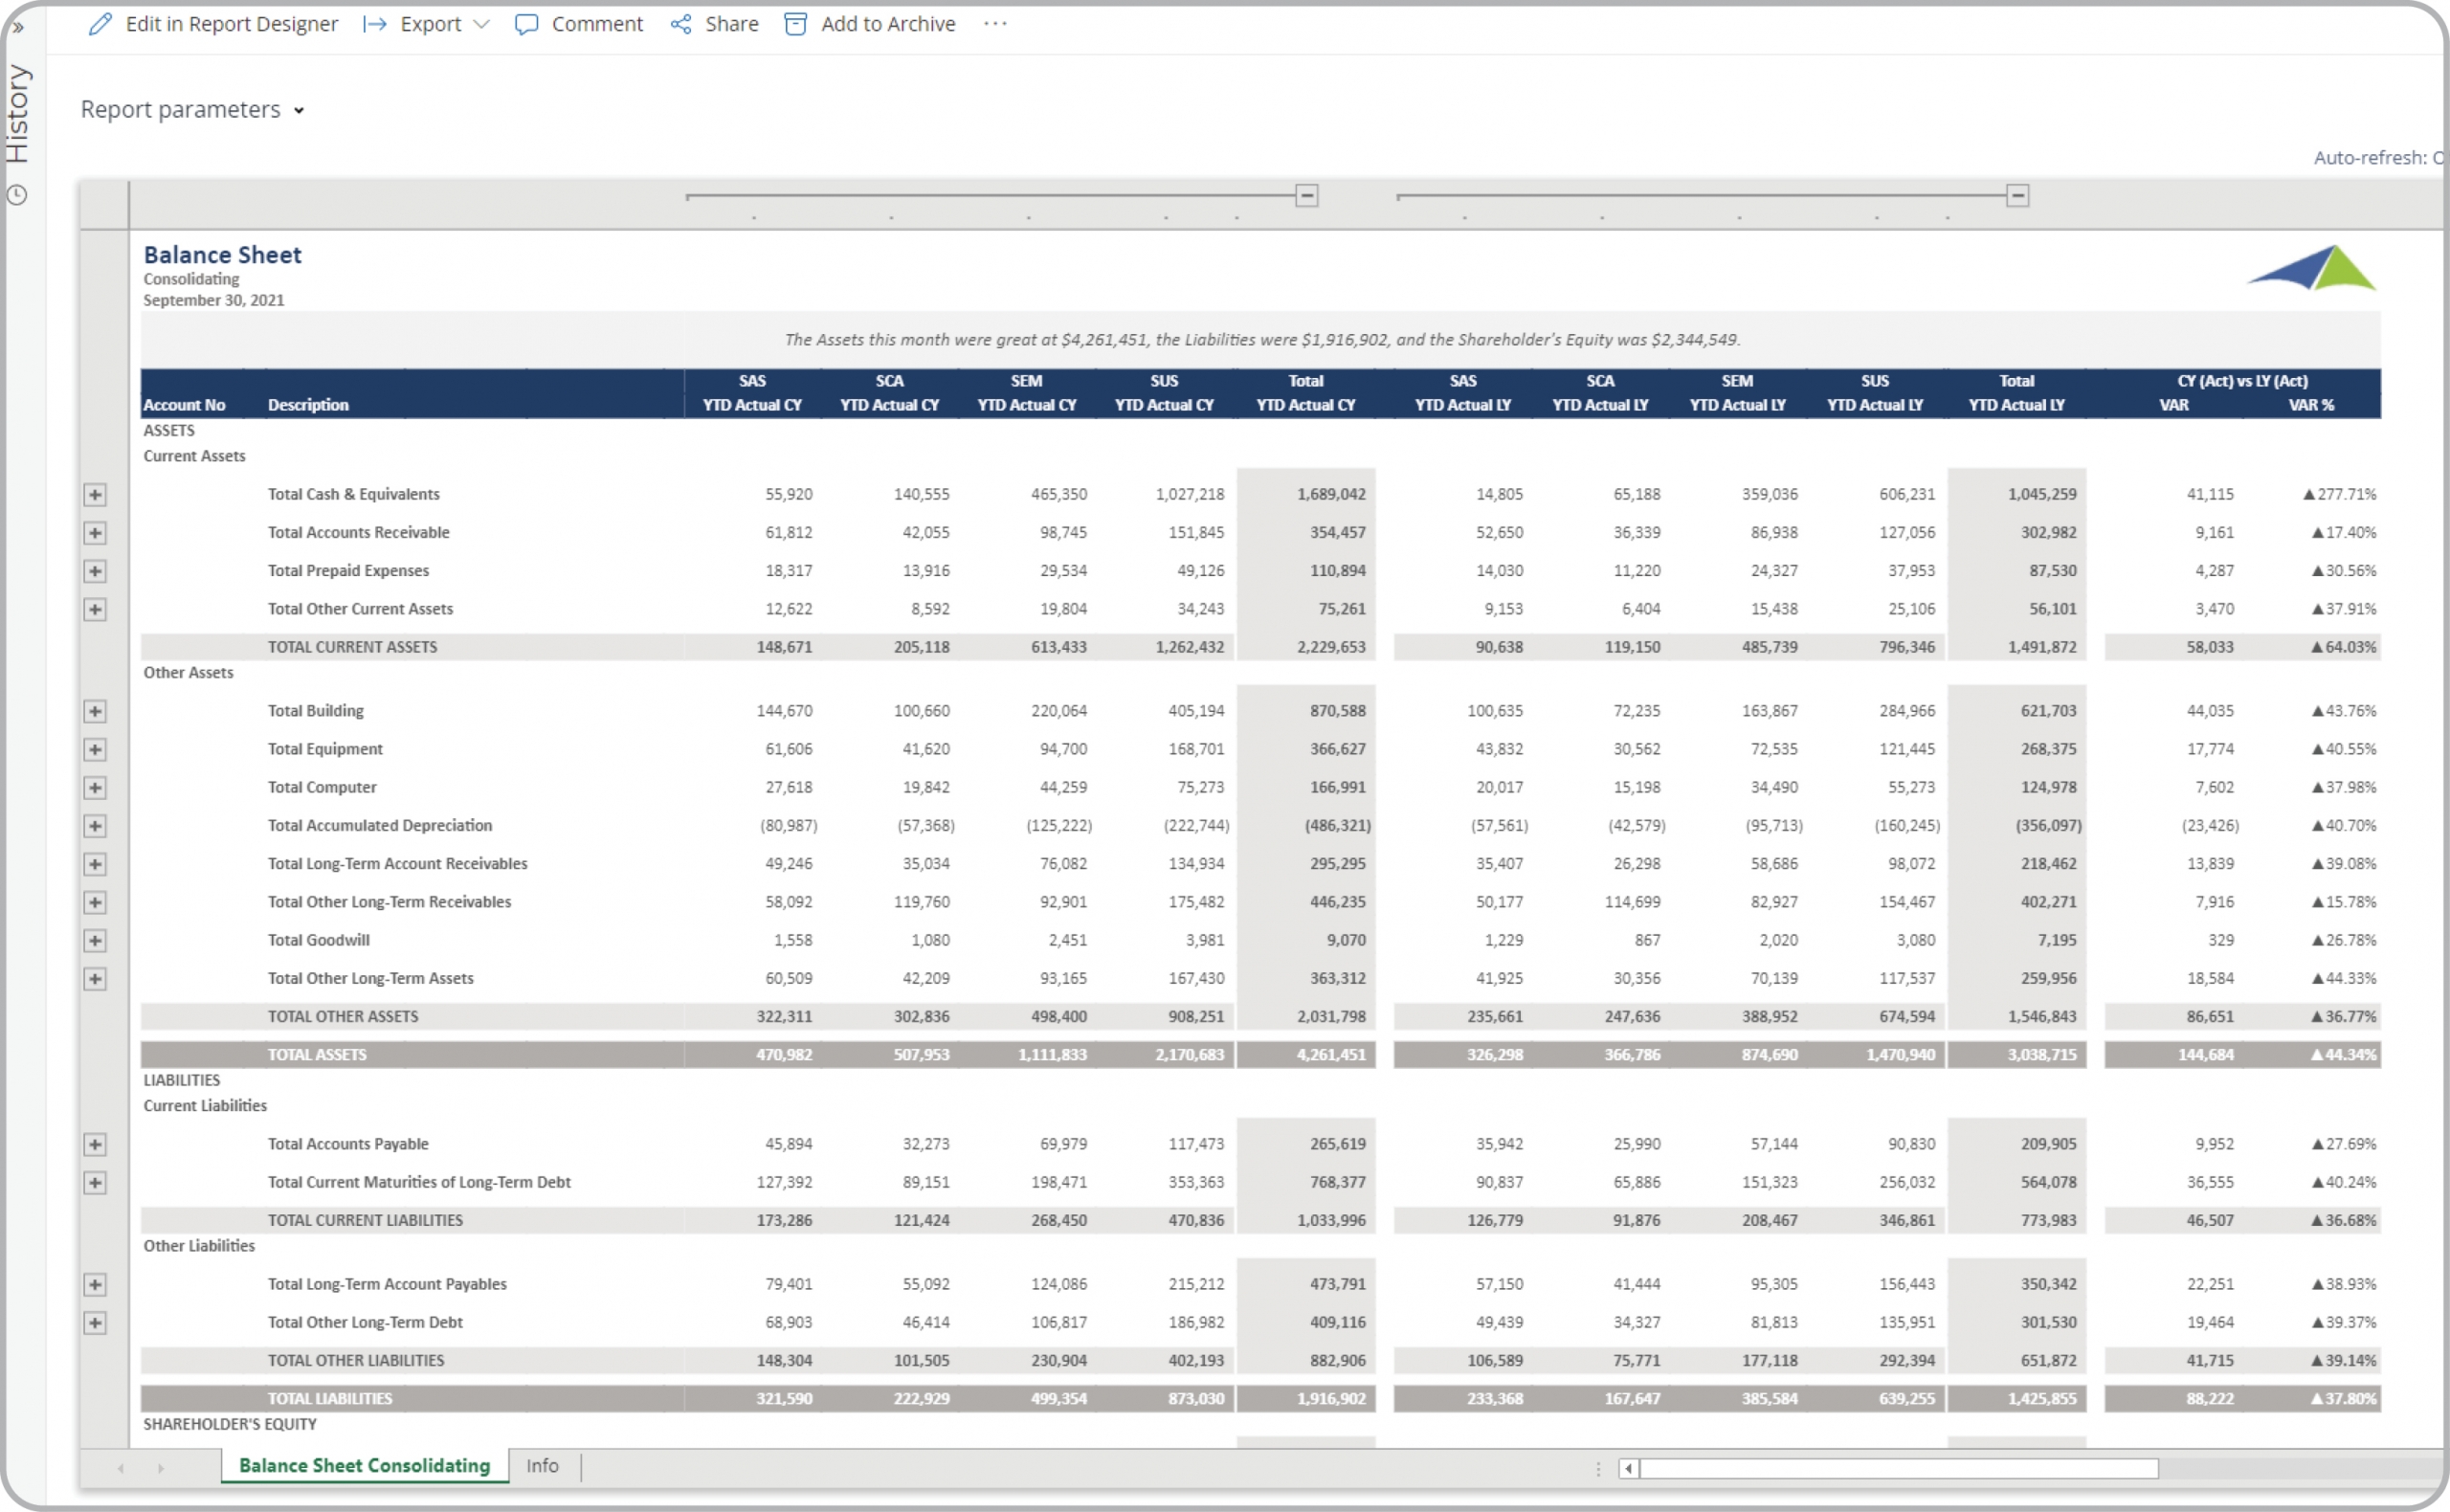
Using Consolidating Balance Sheet Reports to Streamline the Monthly Reporting Process
How can Financial Statement s Drive Faster and Better Decisions? As Corporate Controllers ...
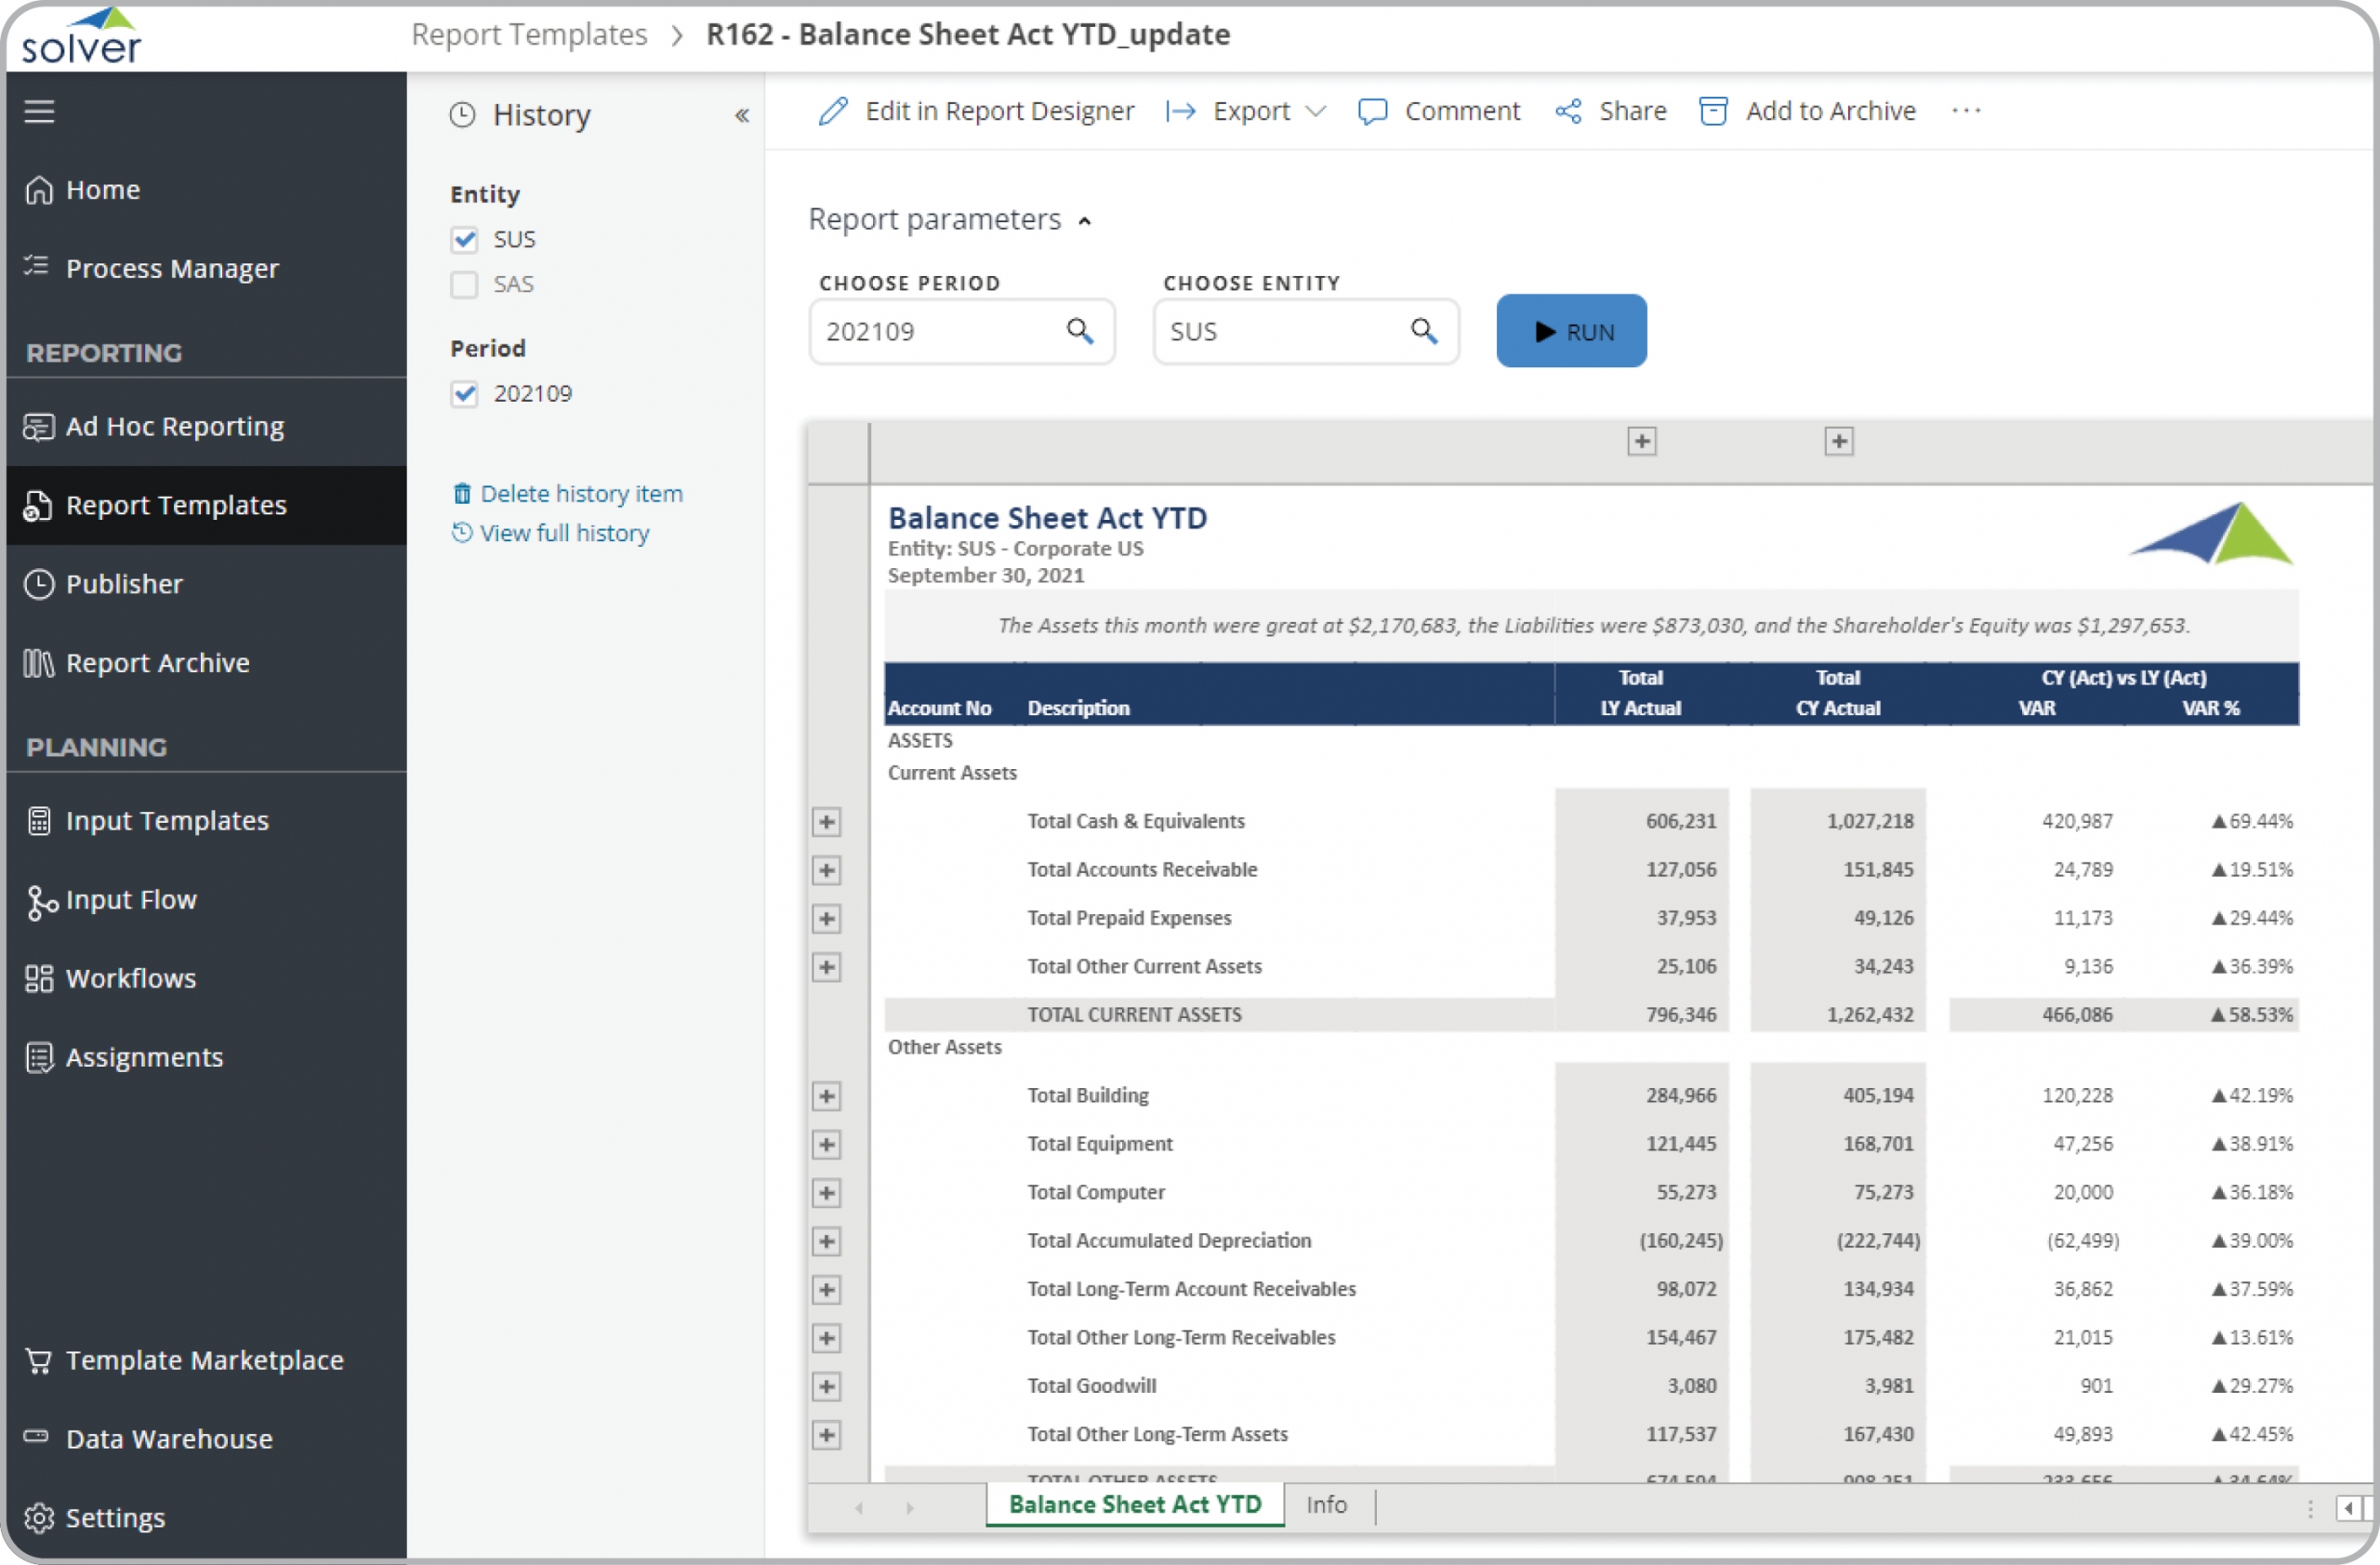
Using the Balance Sheet with Last Year Variances Report to Streamline the Monthly Reporting Process
How can Financial Statement s Drive Faster and Better Decisions? As Controllers increasingly become ...
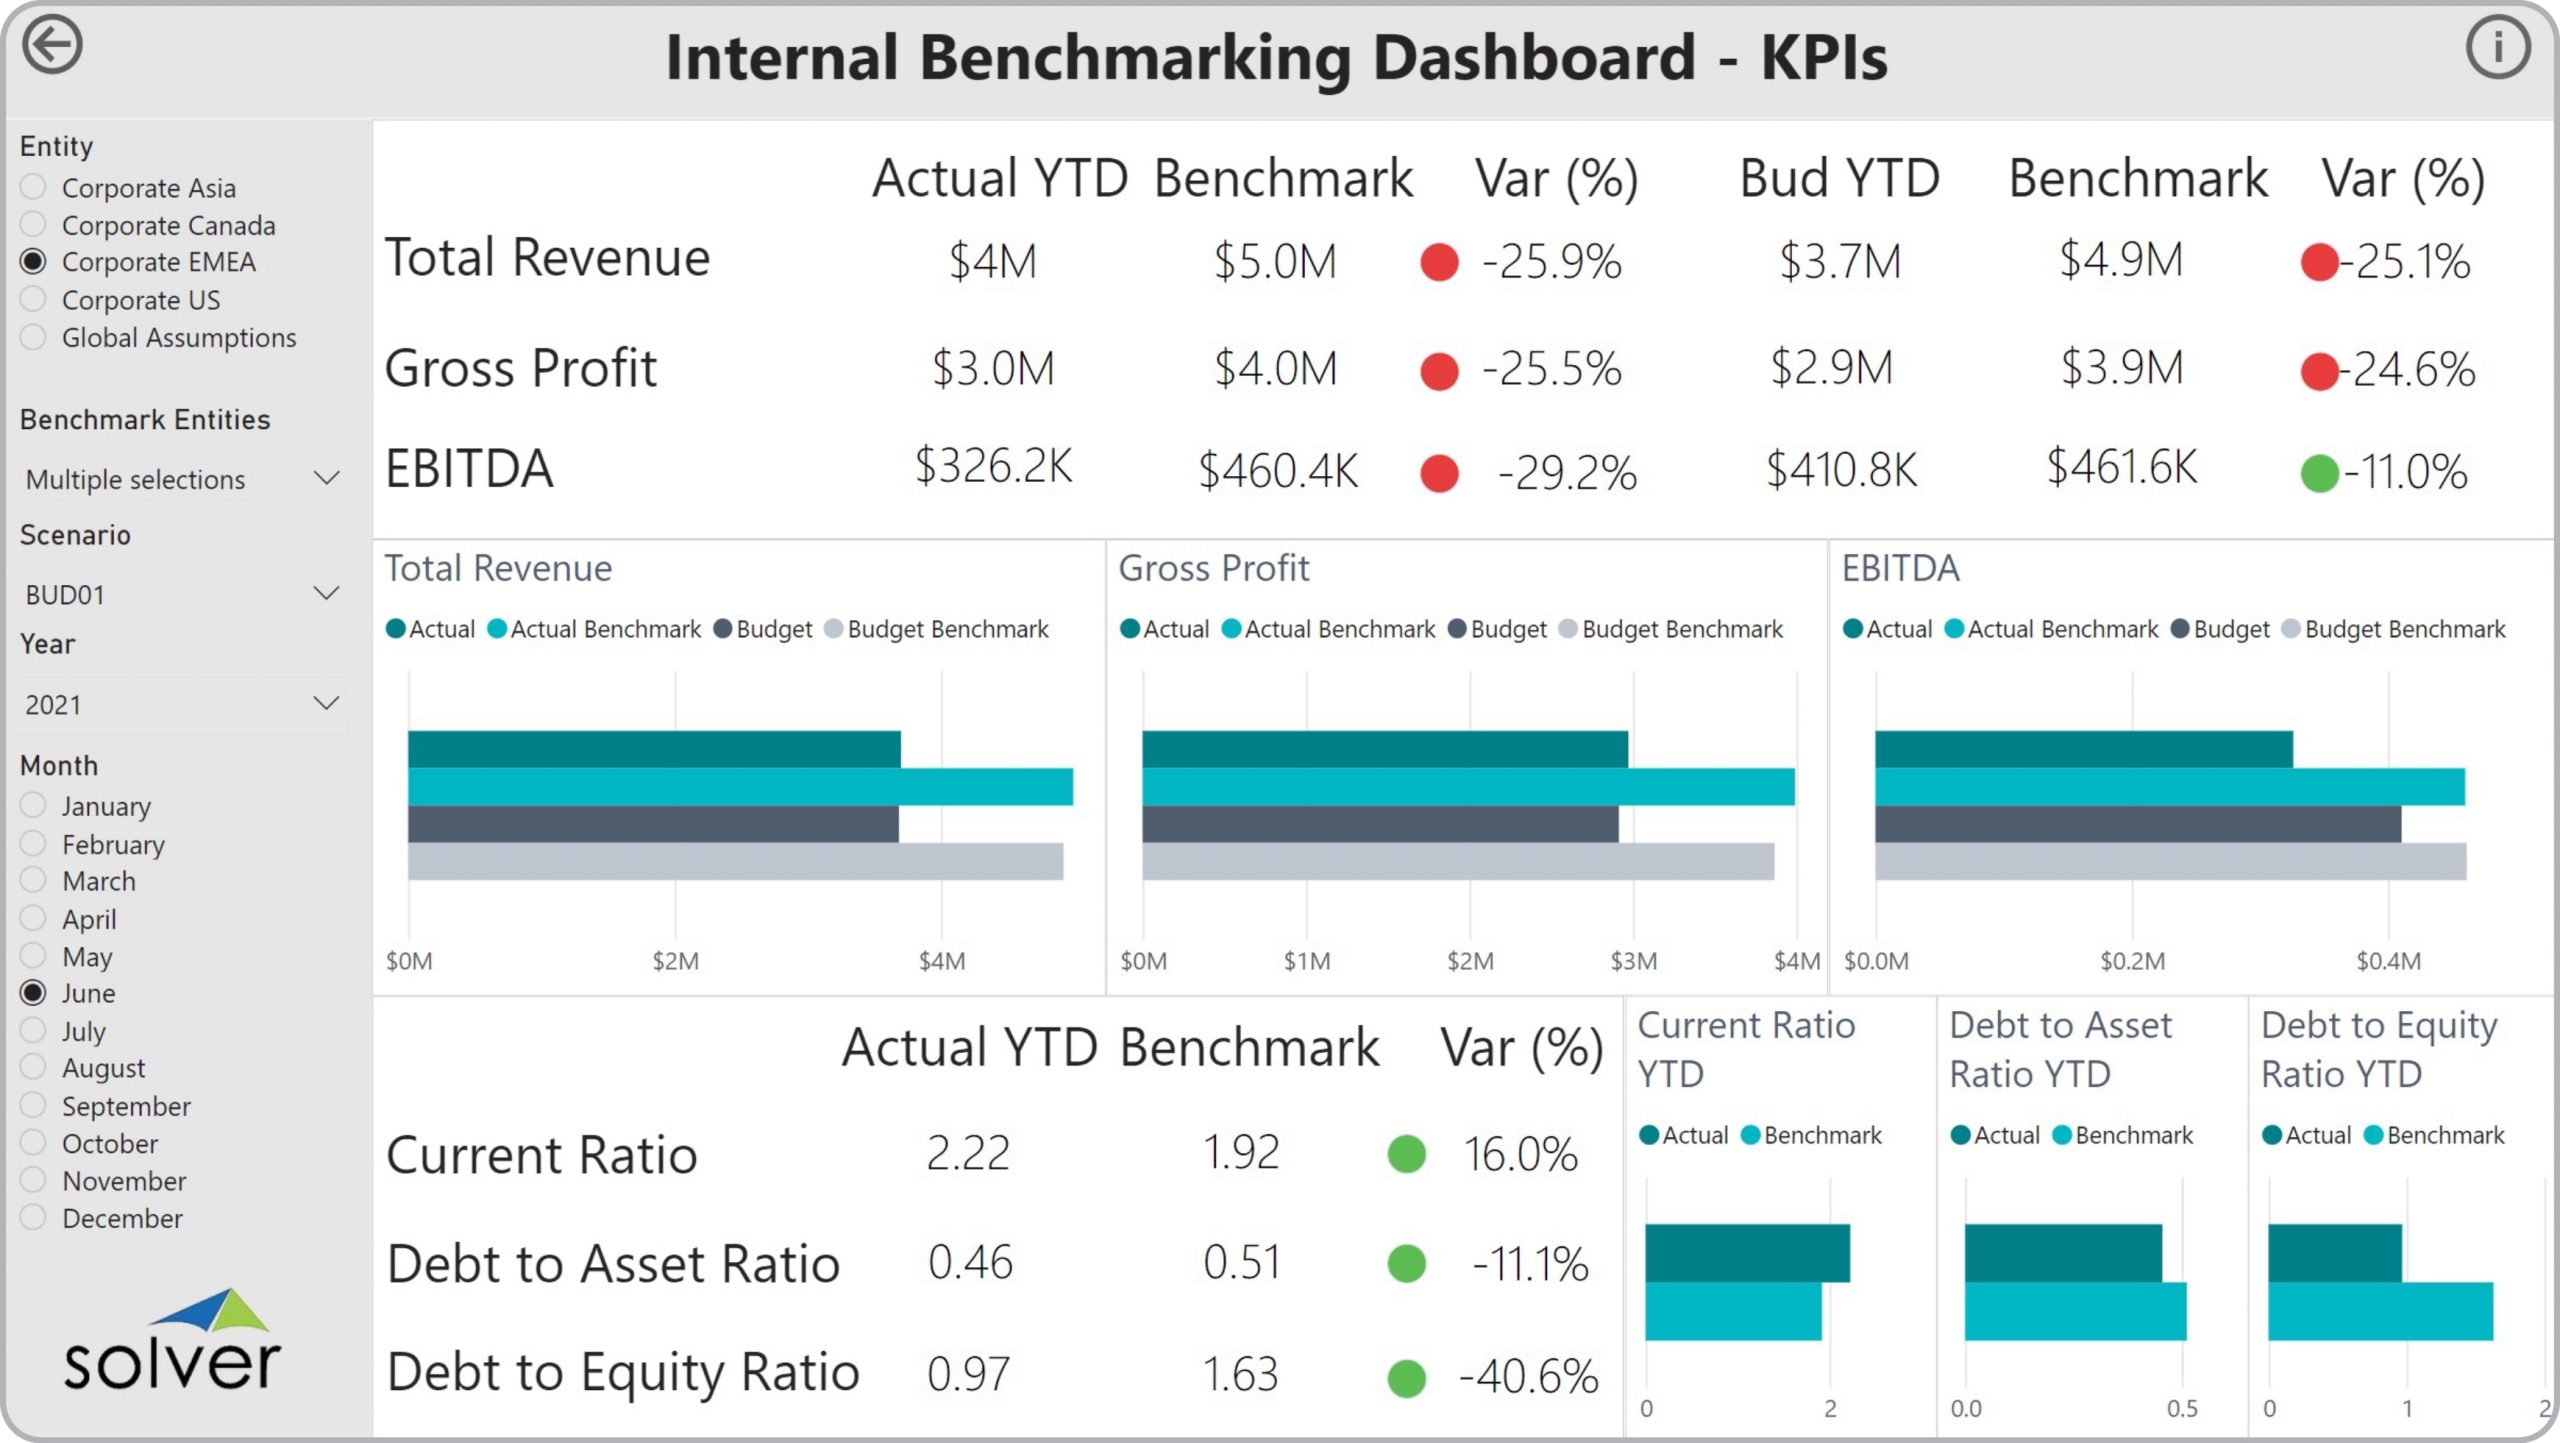
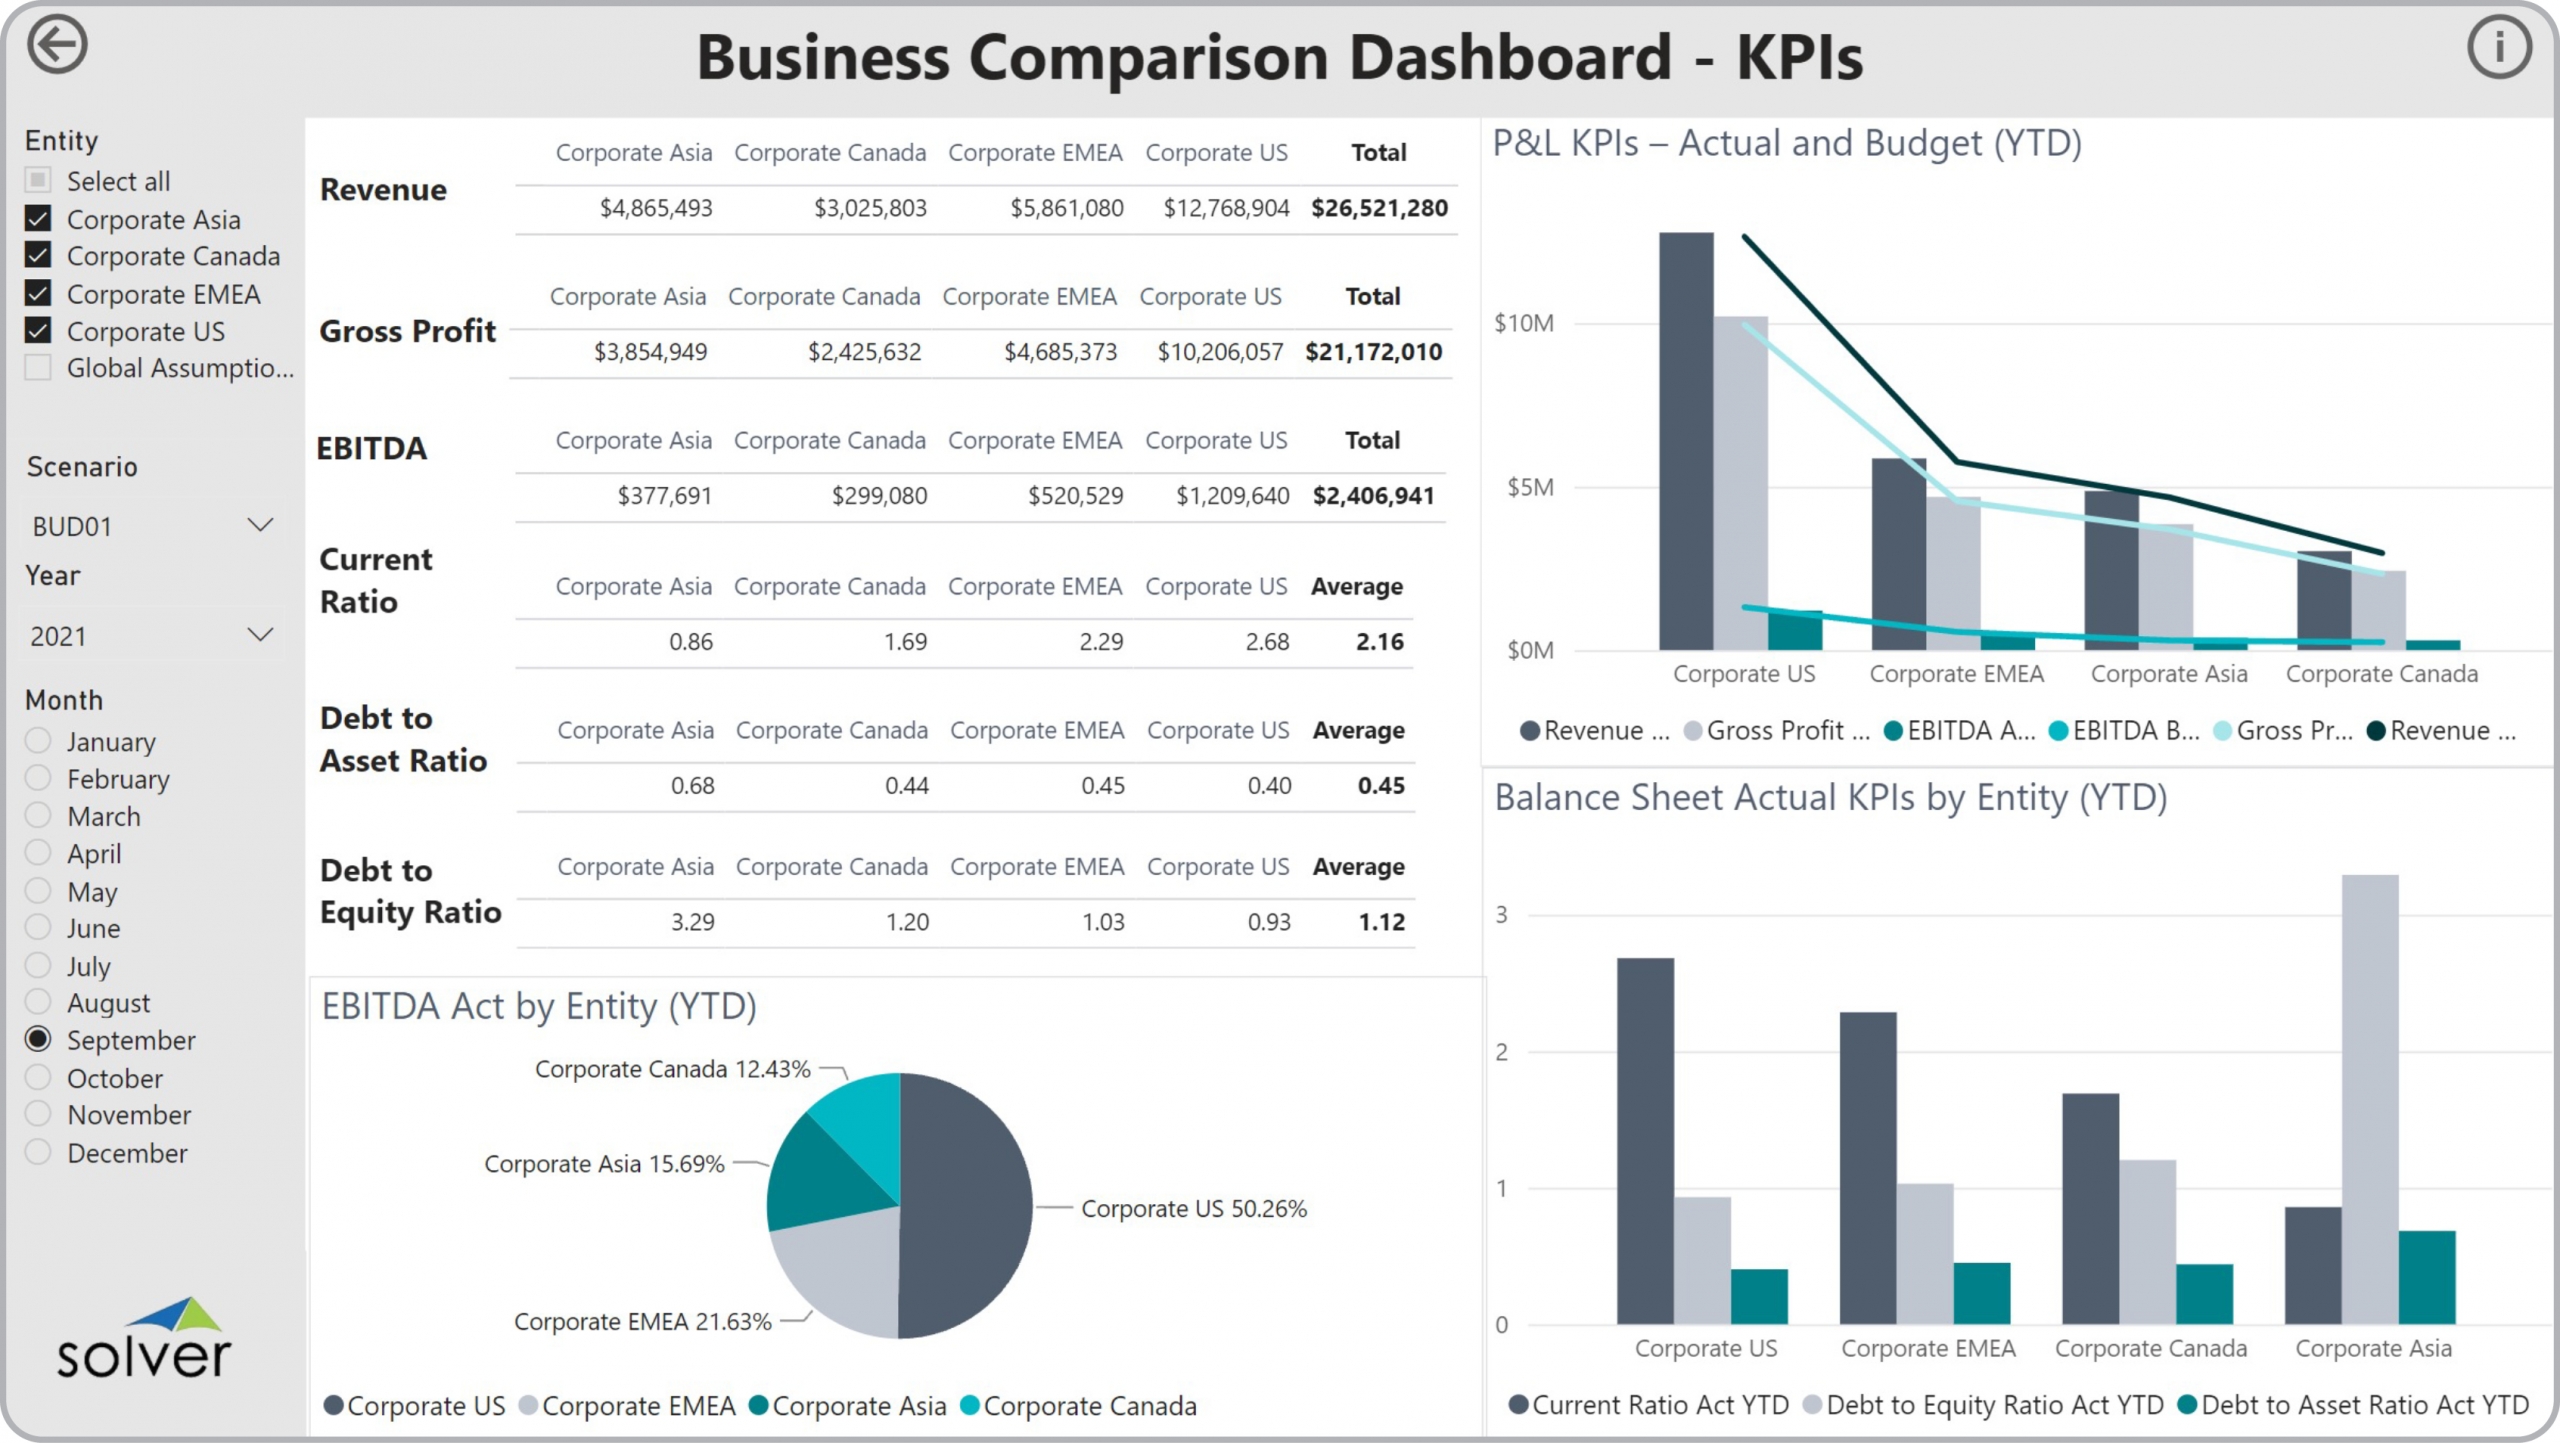
Using KPI Benchmarking Dashboards to Streamline the Monthly Reporting Process
How can Financial Dashboard s Drive Faster and Better Decisions? As CFOs increasingly become key ...
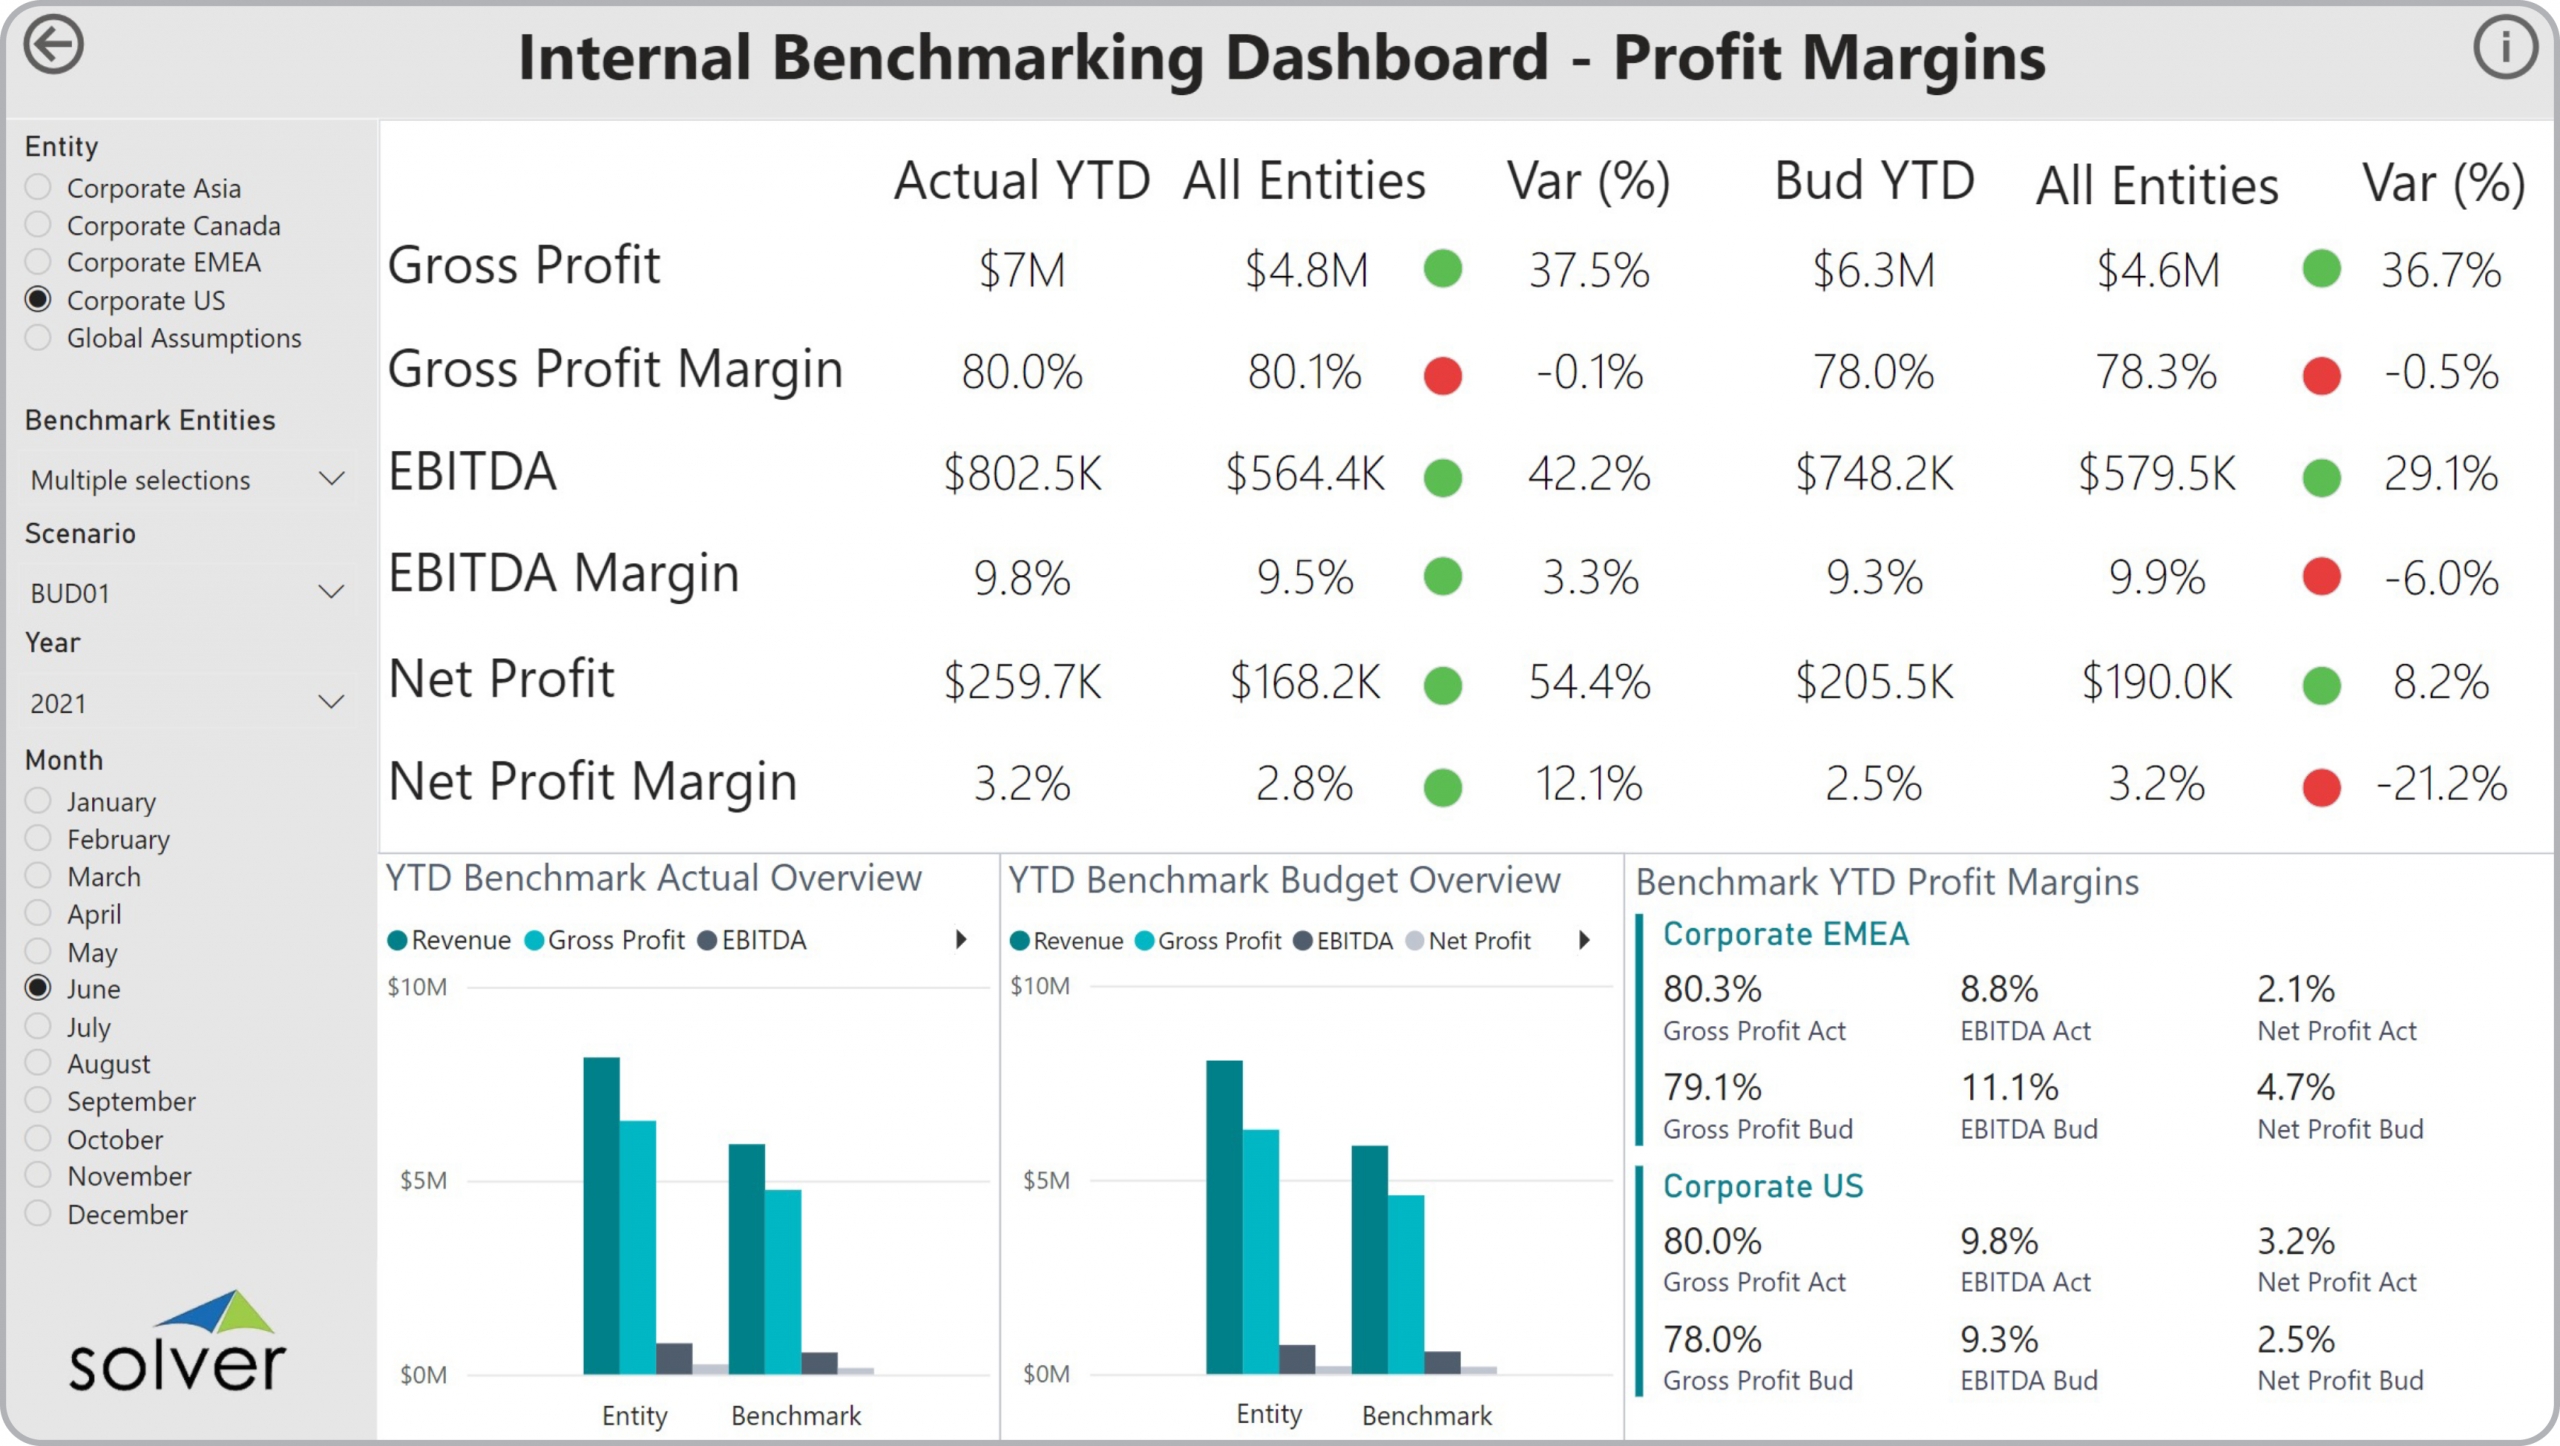
Using Profitability Benchmarking Dashboards to Streamline the Monthly Reporting Process
How can Financial Dashboard s Drive Faster and Better Decisions? As CFOs increasingly become key ...
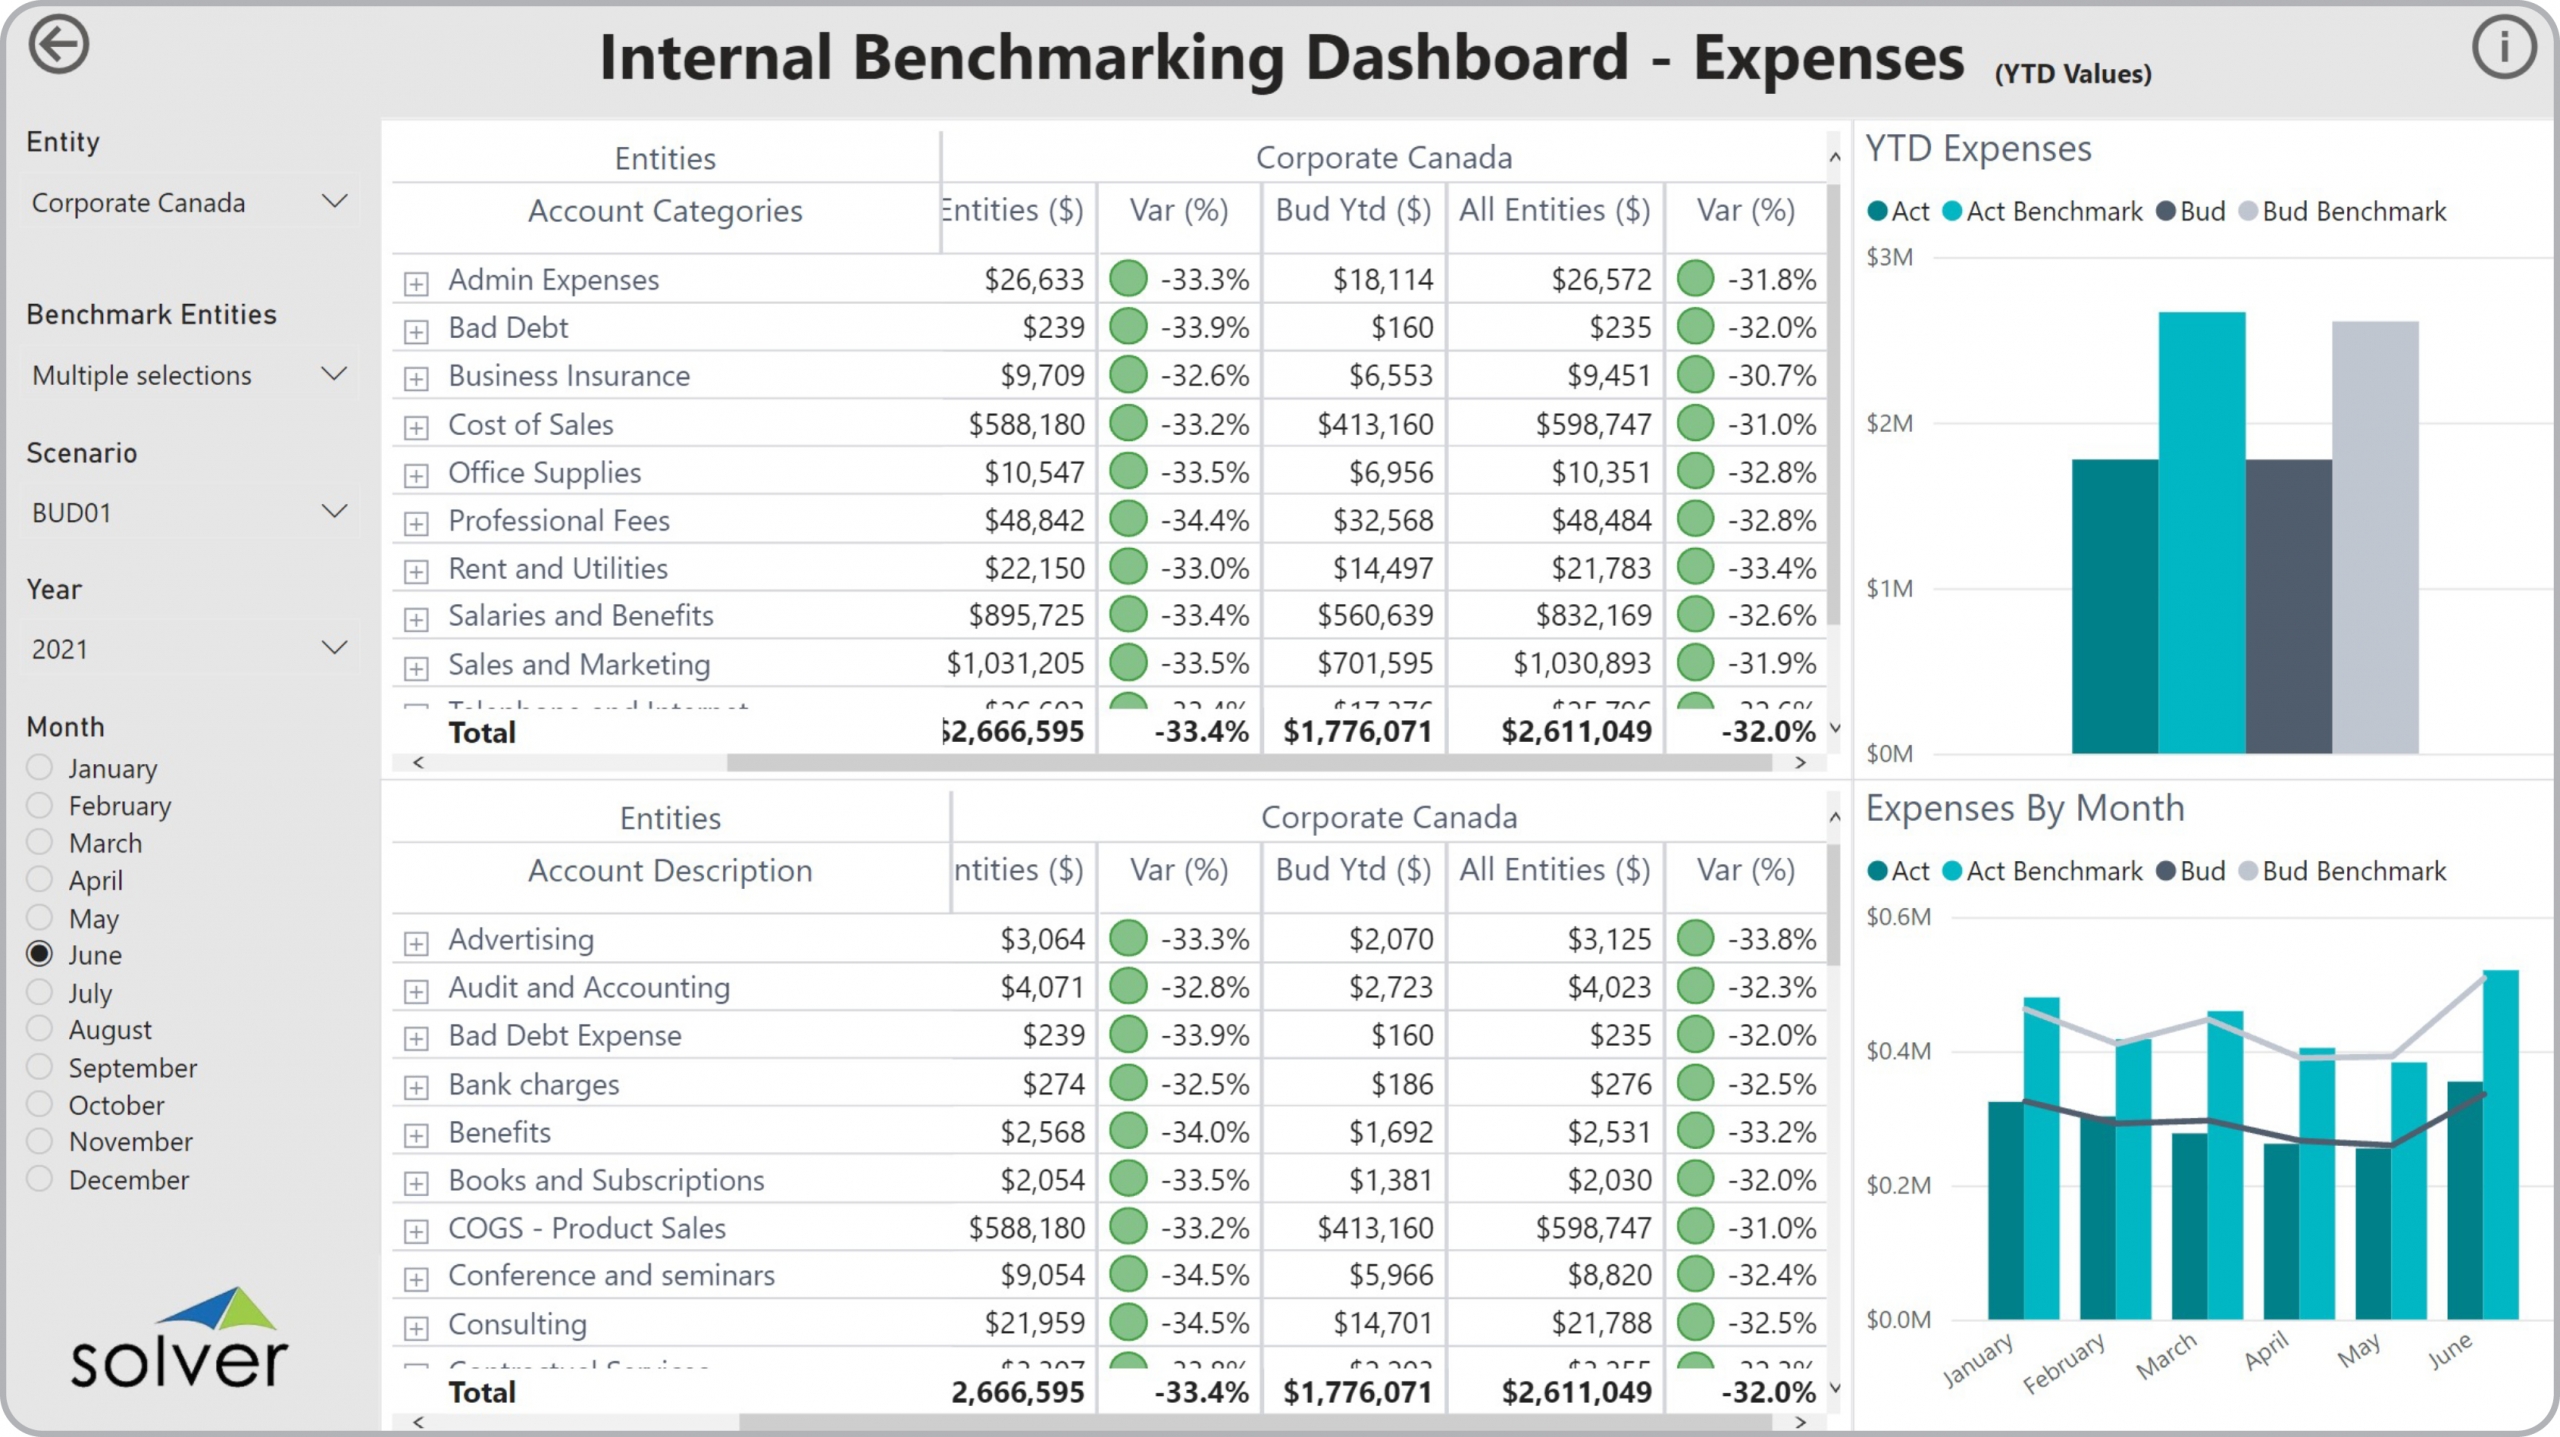
Using Expense Benchmarking Dashboards to Streamline the Monthly Reporting Process
How can Financial Dashboard s Drive Faster and Better Decisions? As CFOs increasingly become key ...
Using KPI Comparison Dashboards to Streamline the Monthly Reporting Process
How can Financial Dashboard s Drive Faster and Better Decisions? As CFOs increasingly become key ...
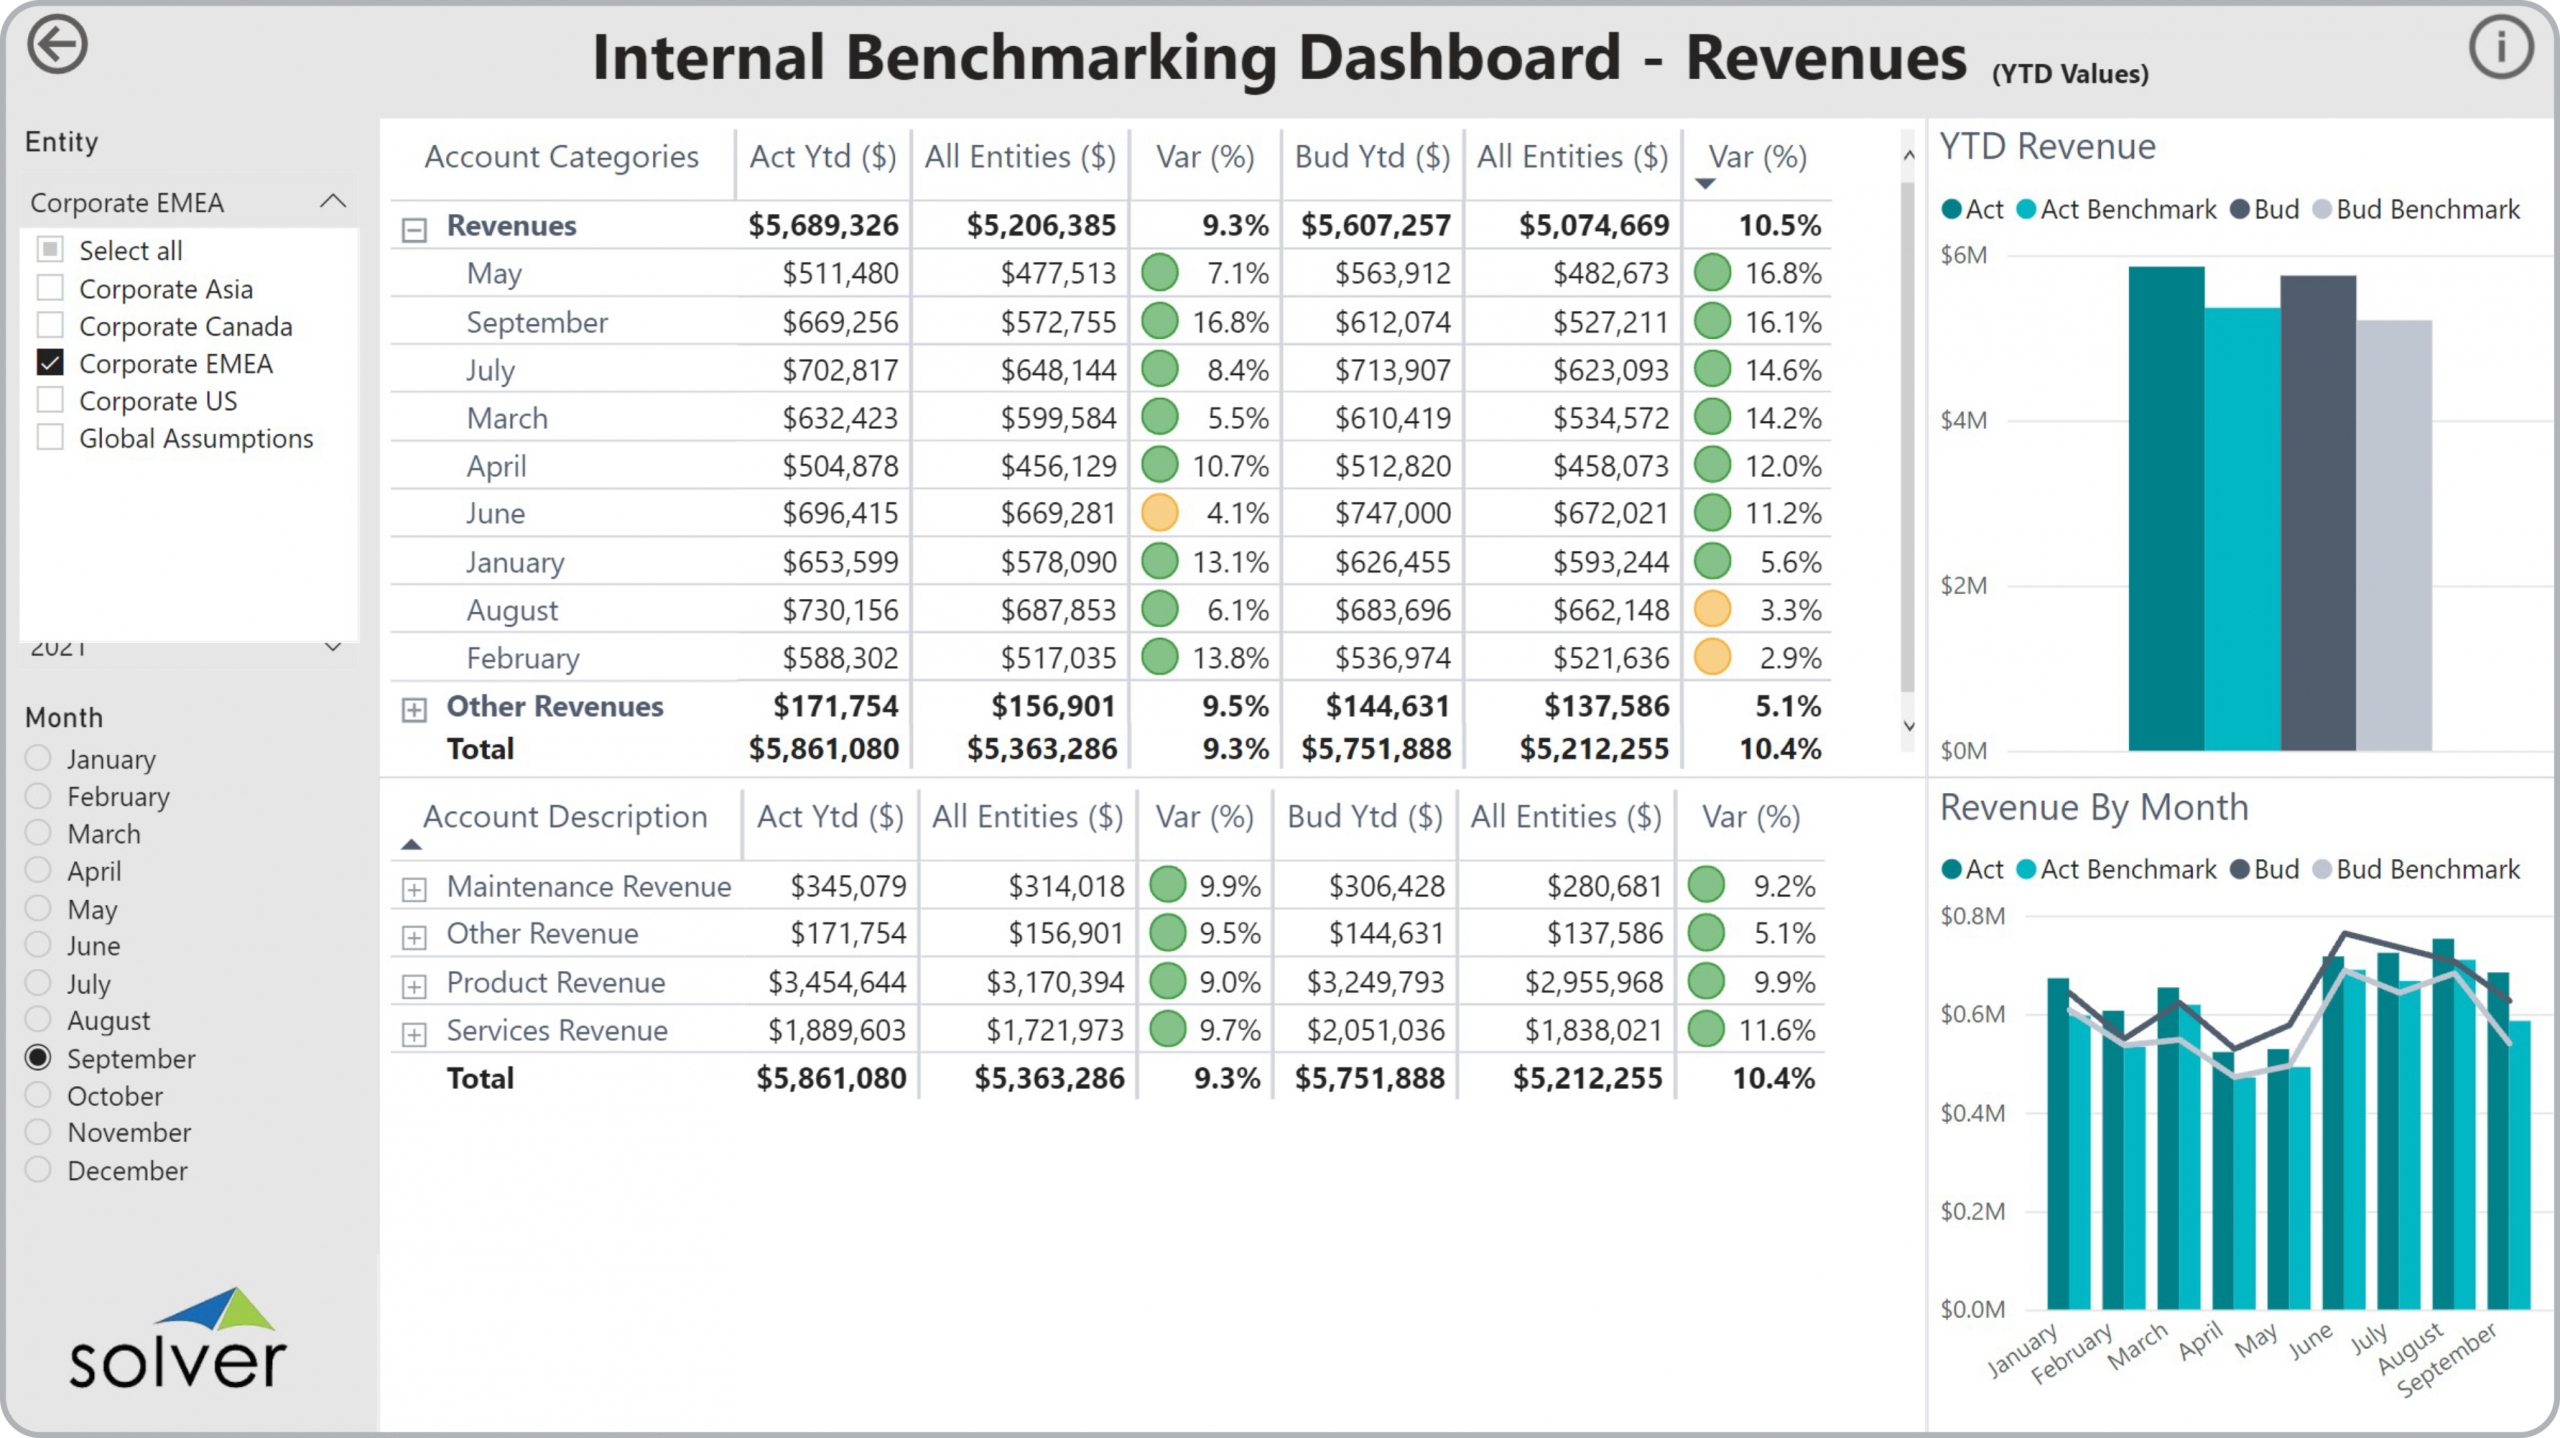
Using Revenue Benchmarking Dashboards to Streamline the Monthly Reporting Process
How can Financial Dashboard s Drive Faster and Better Decisions? As CFOs increasingly become key ...
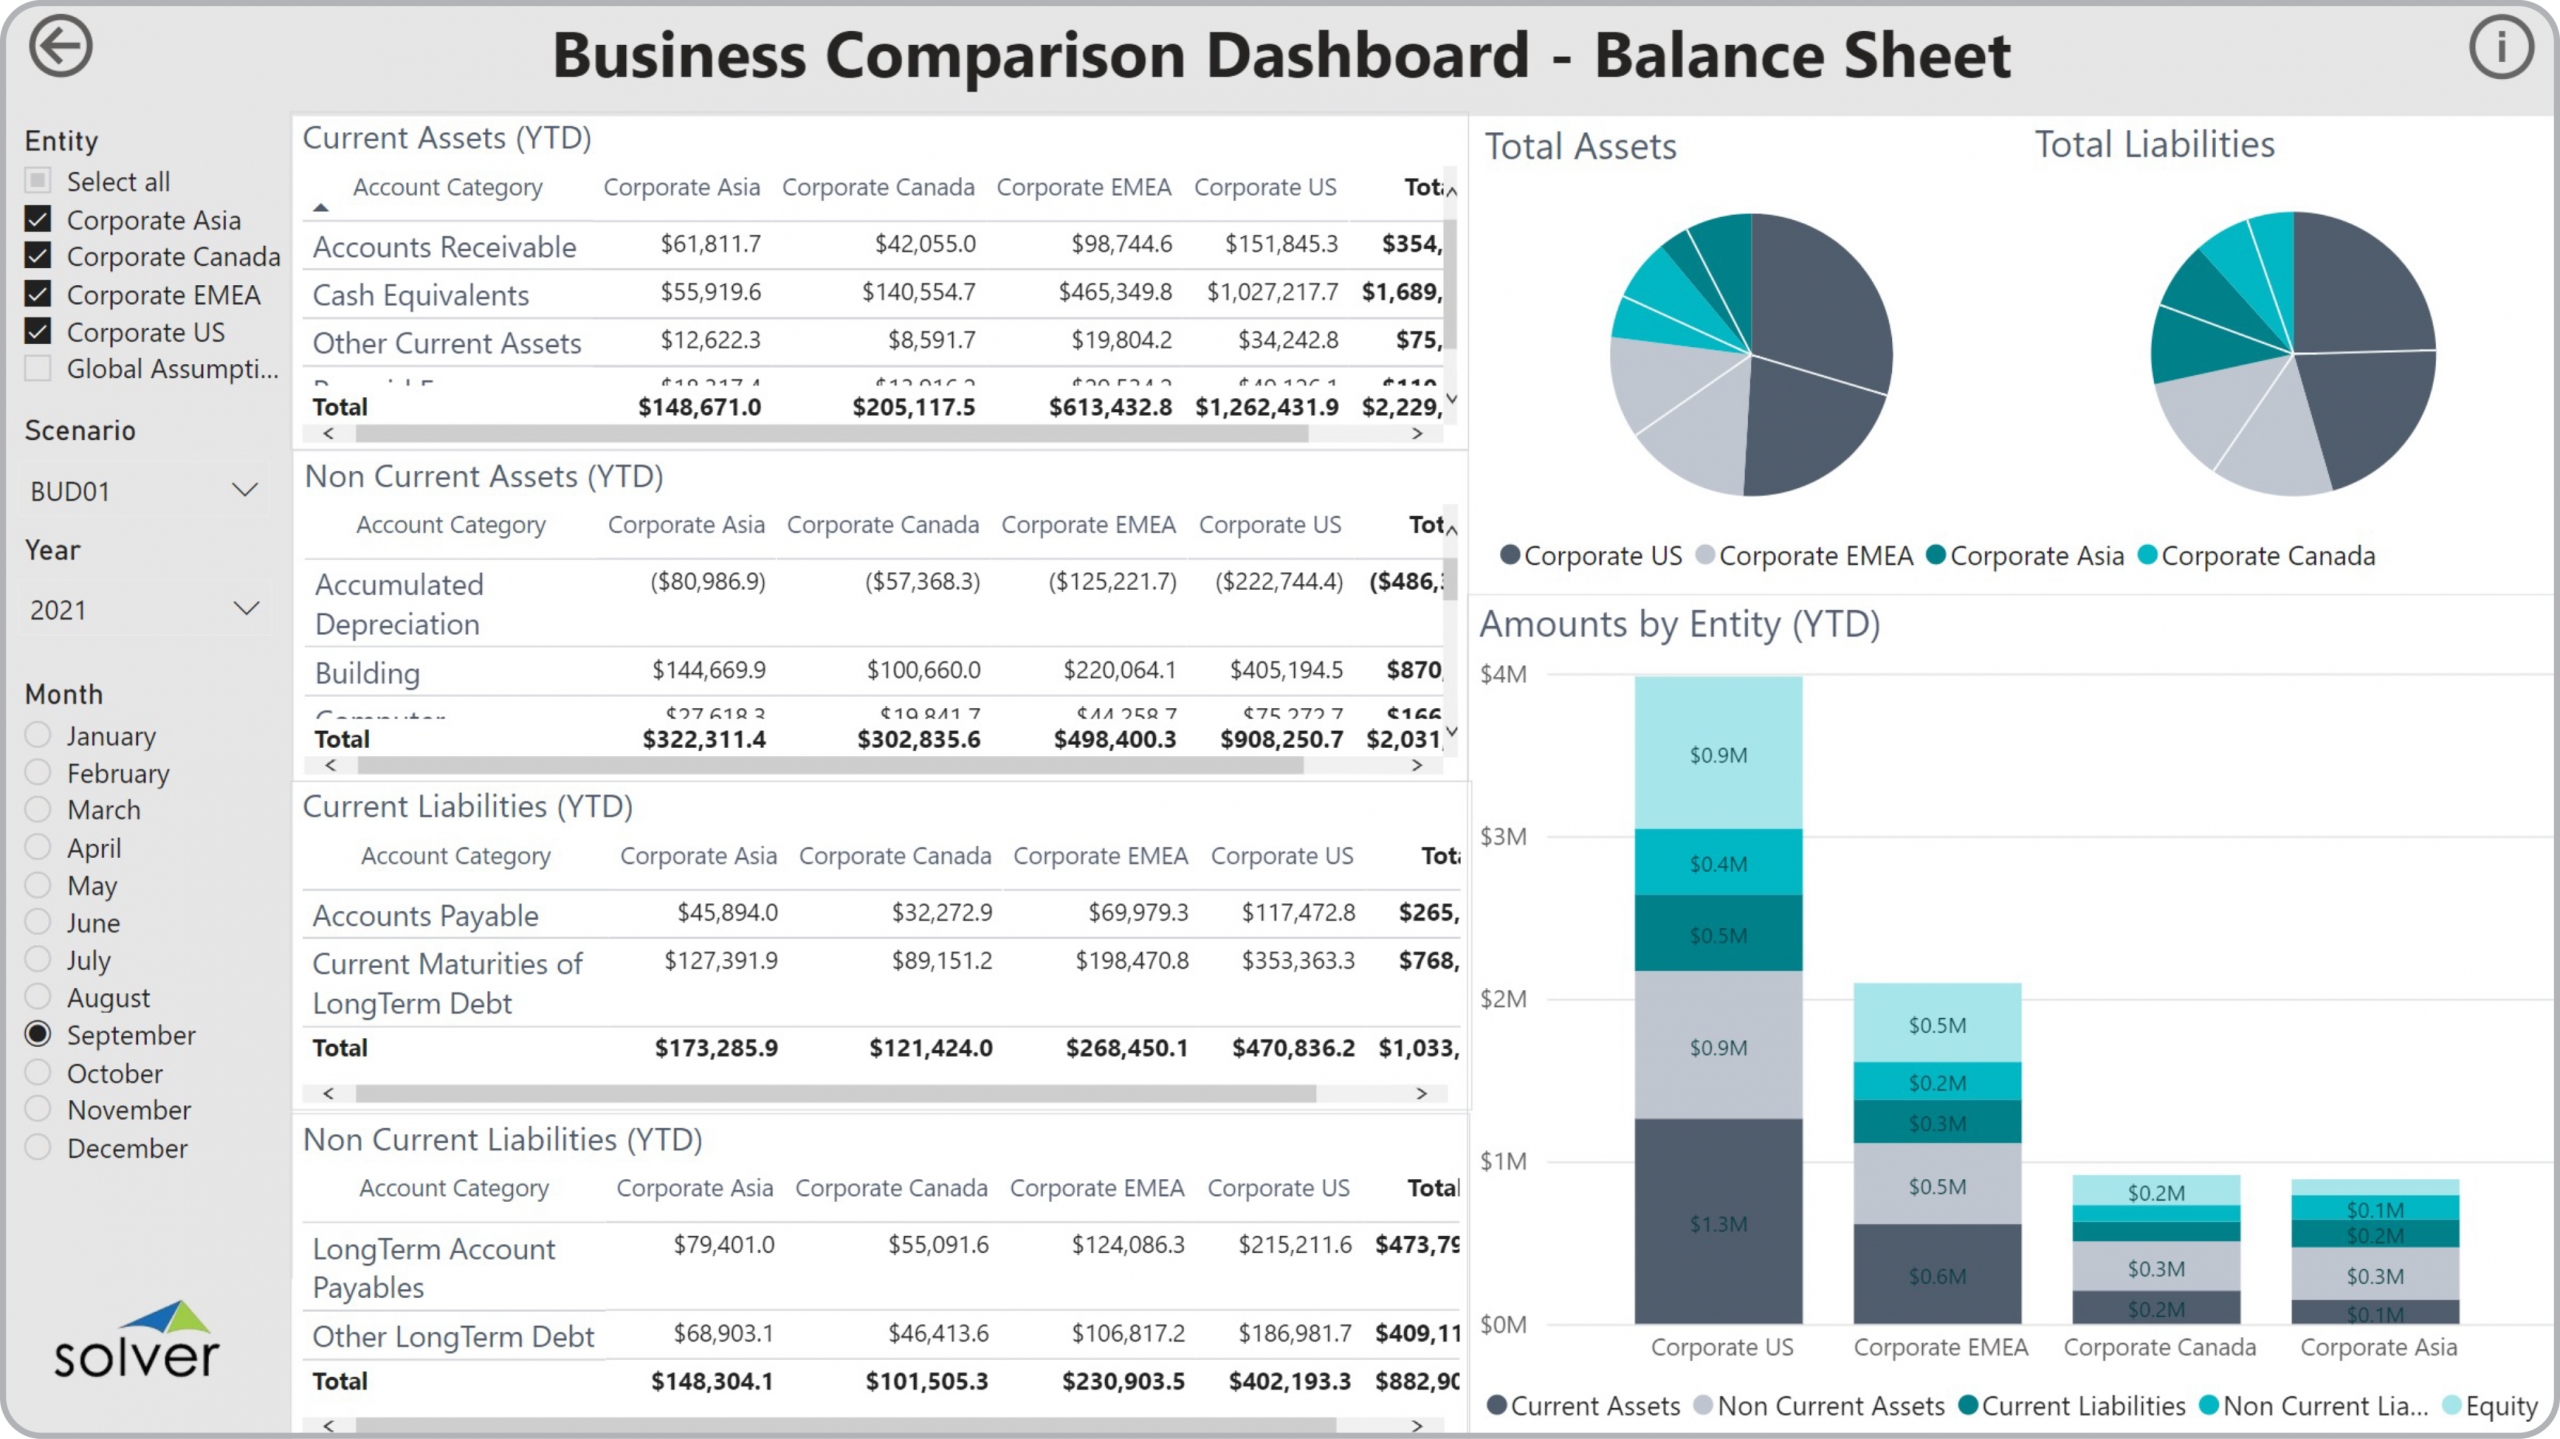
Using Balance Sheet Comparison Dashboards to Streamline the Monthly Reporting Process
How can Financial Dashboard s Drive Faster and Better Decisions? As CFOs increasingly become key ...
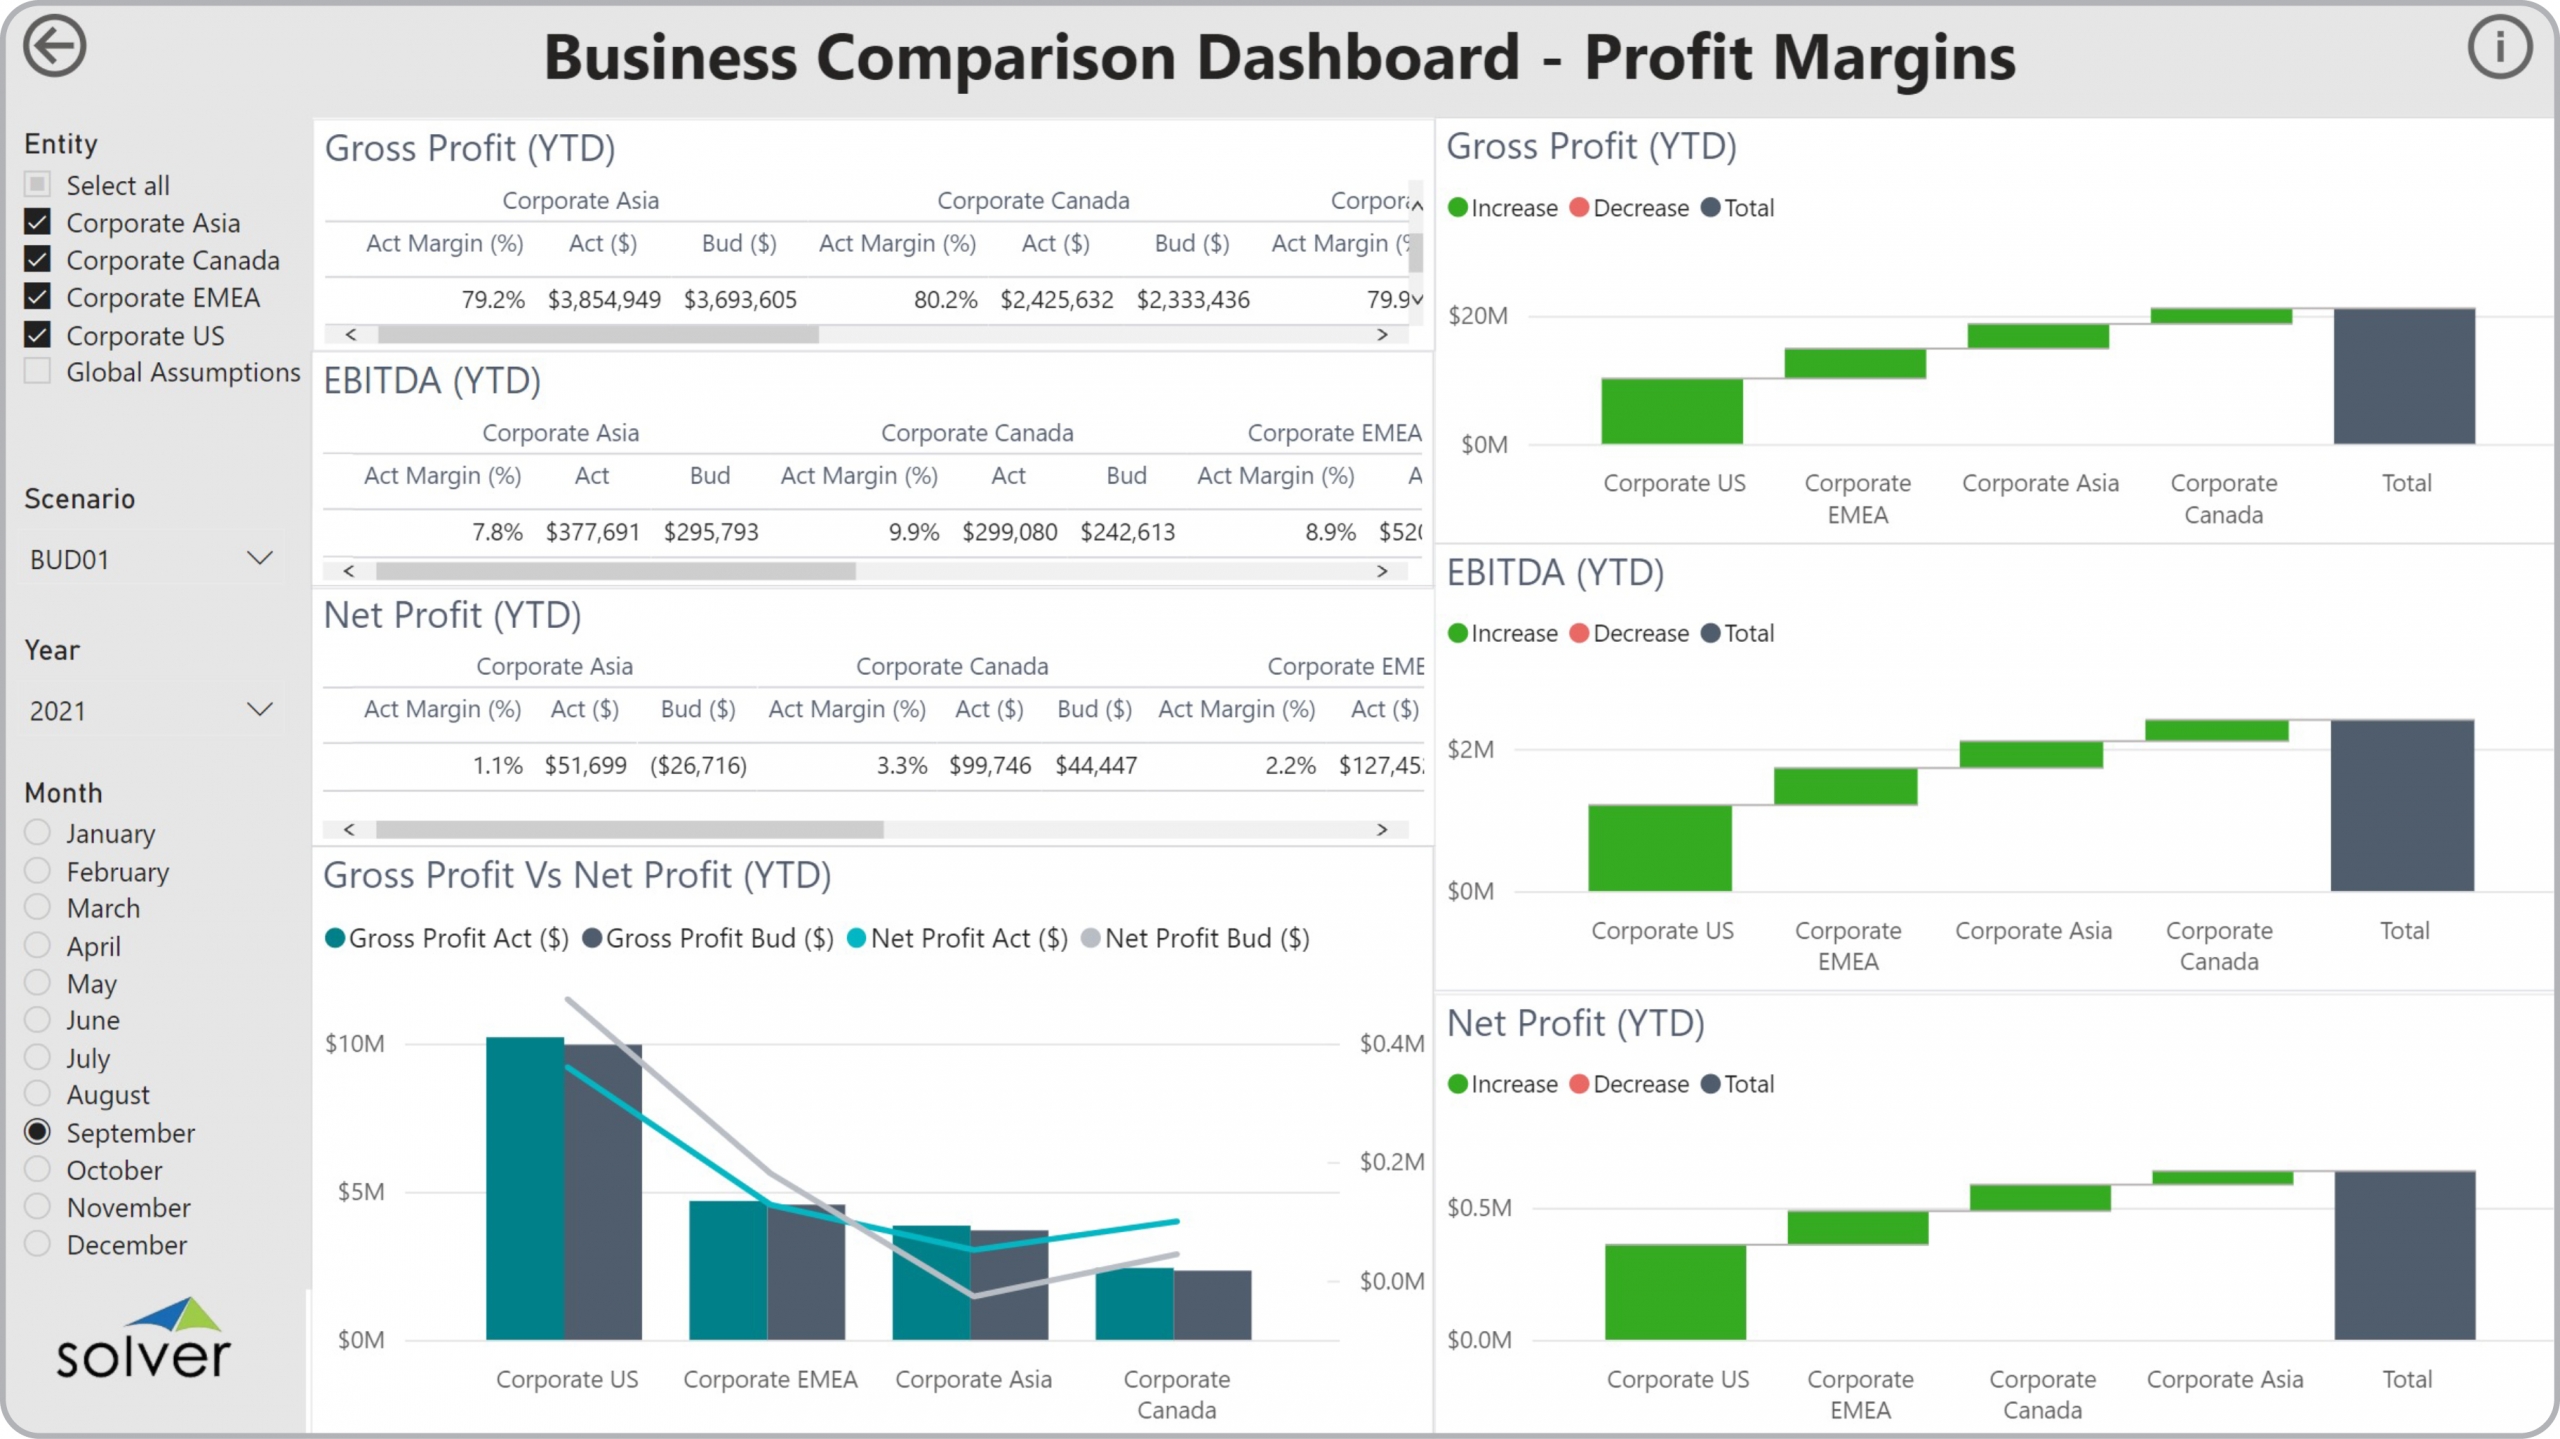
Using Profitability Comparison Dashboards to Streamline the Monthly Reporting Process
How can Financial Dashboard s Drive Faster and Better Decisions? As CFOs increasingly become key ...
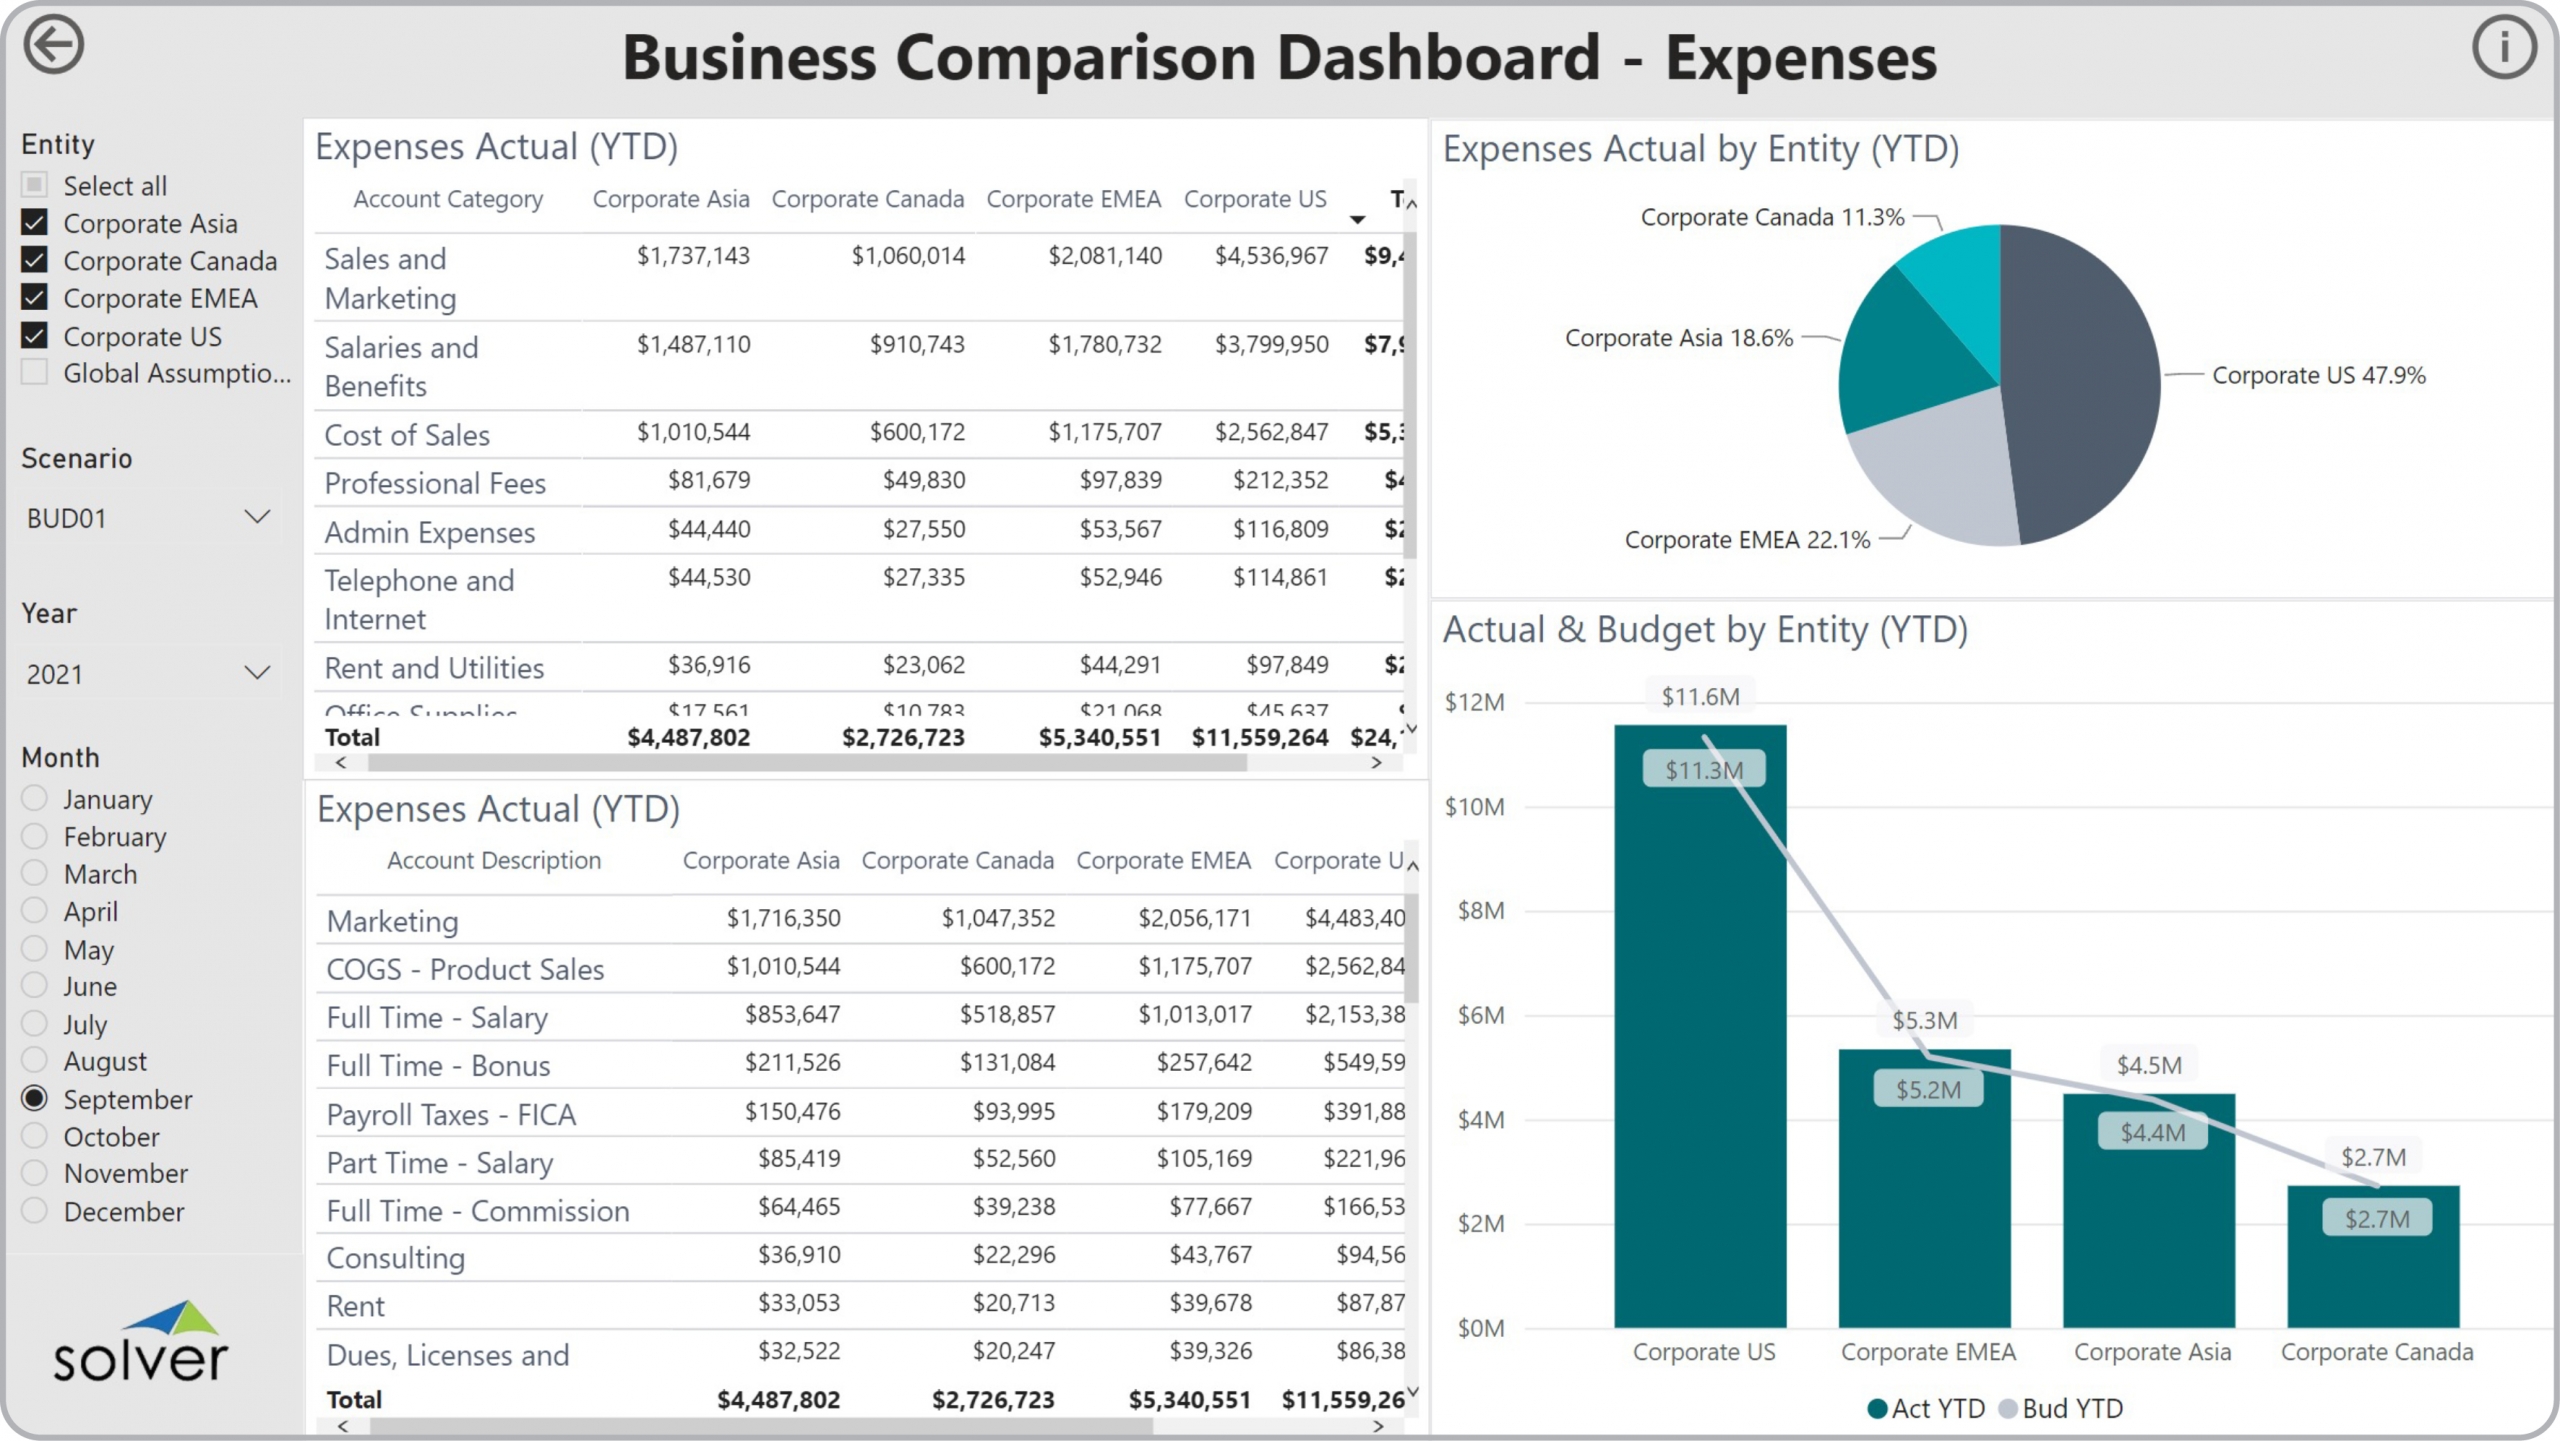
Using Expense Comparison Dashboards to Streamline the Monthly Reporting and Consolidations Process
How can Financial Dashboard s Drive Faster and Better Decisions? As CFOs increasingly become key ...
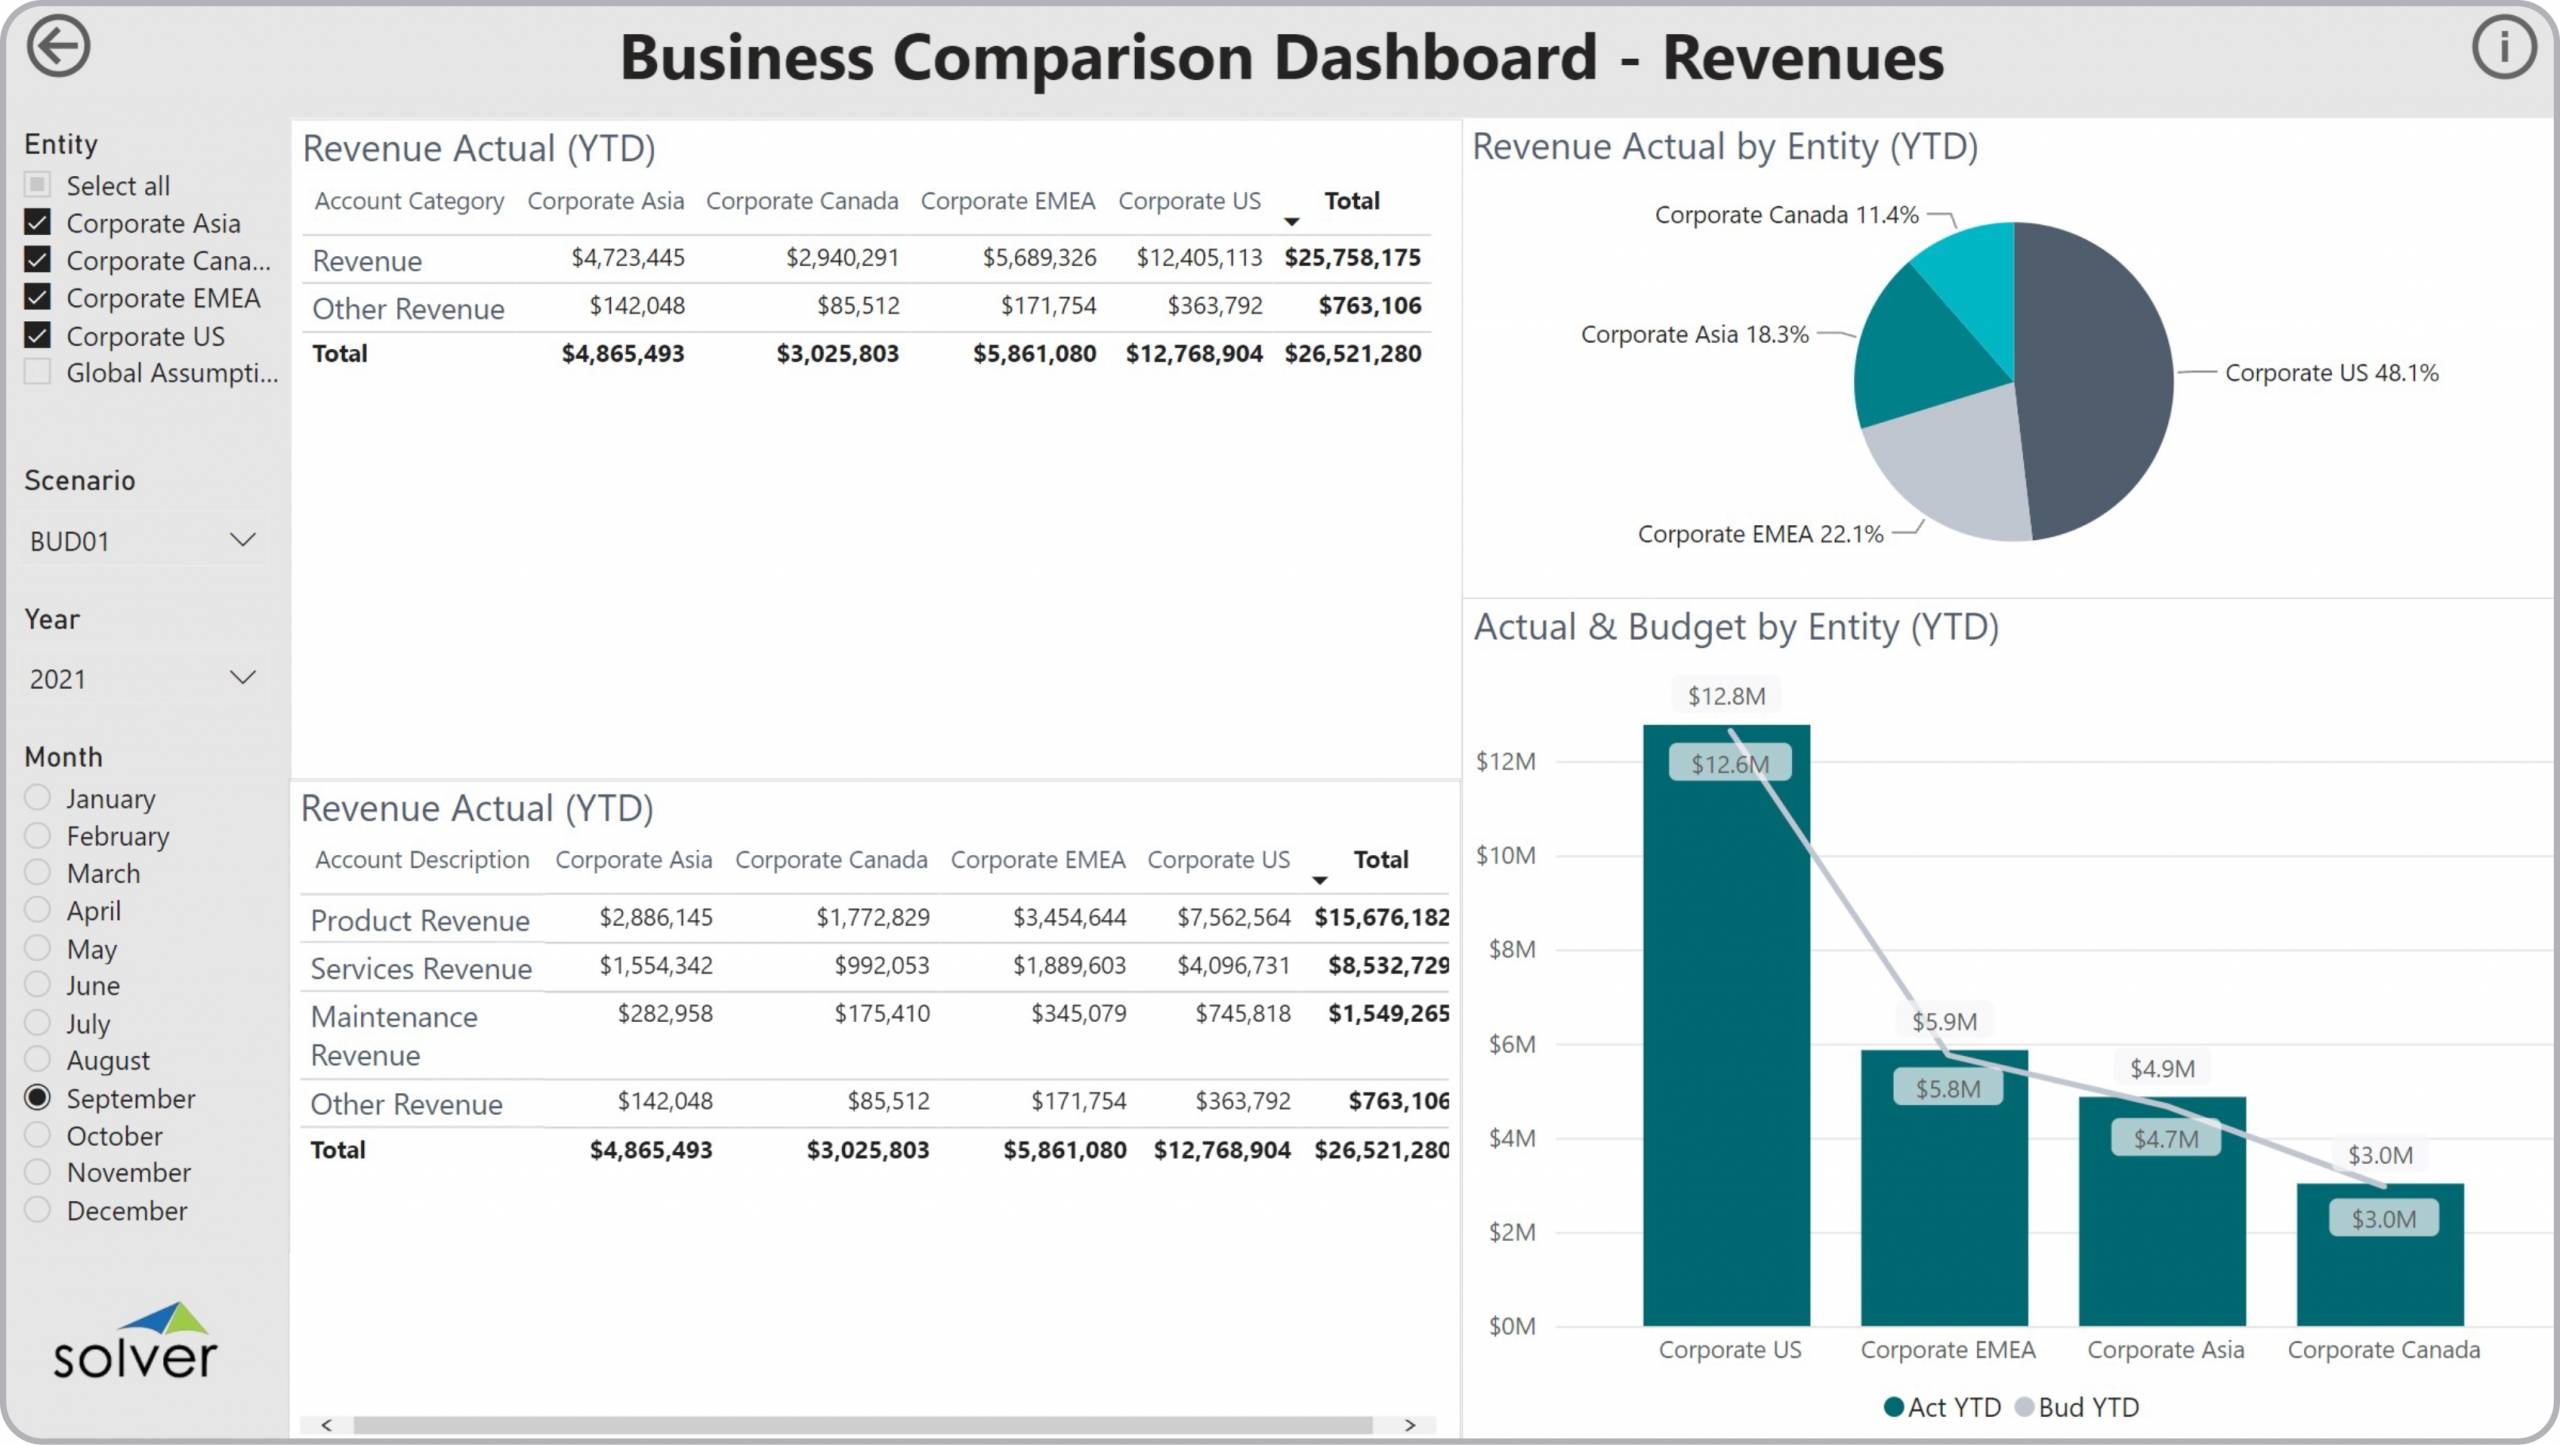
Using Revenue Comparison and Consolidation Dashboards to Streamline the Monthly Reporting Process
How can Financial Dashboard s Drive Faster and Better Decisions? As CFOs increasingly become key ...
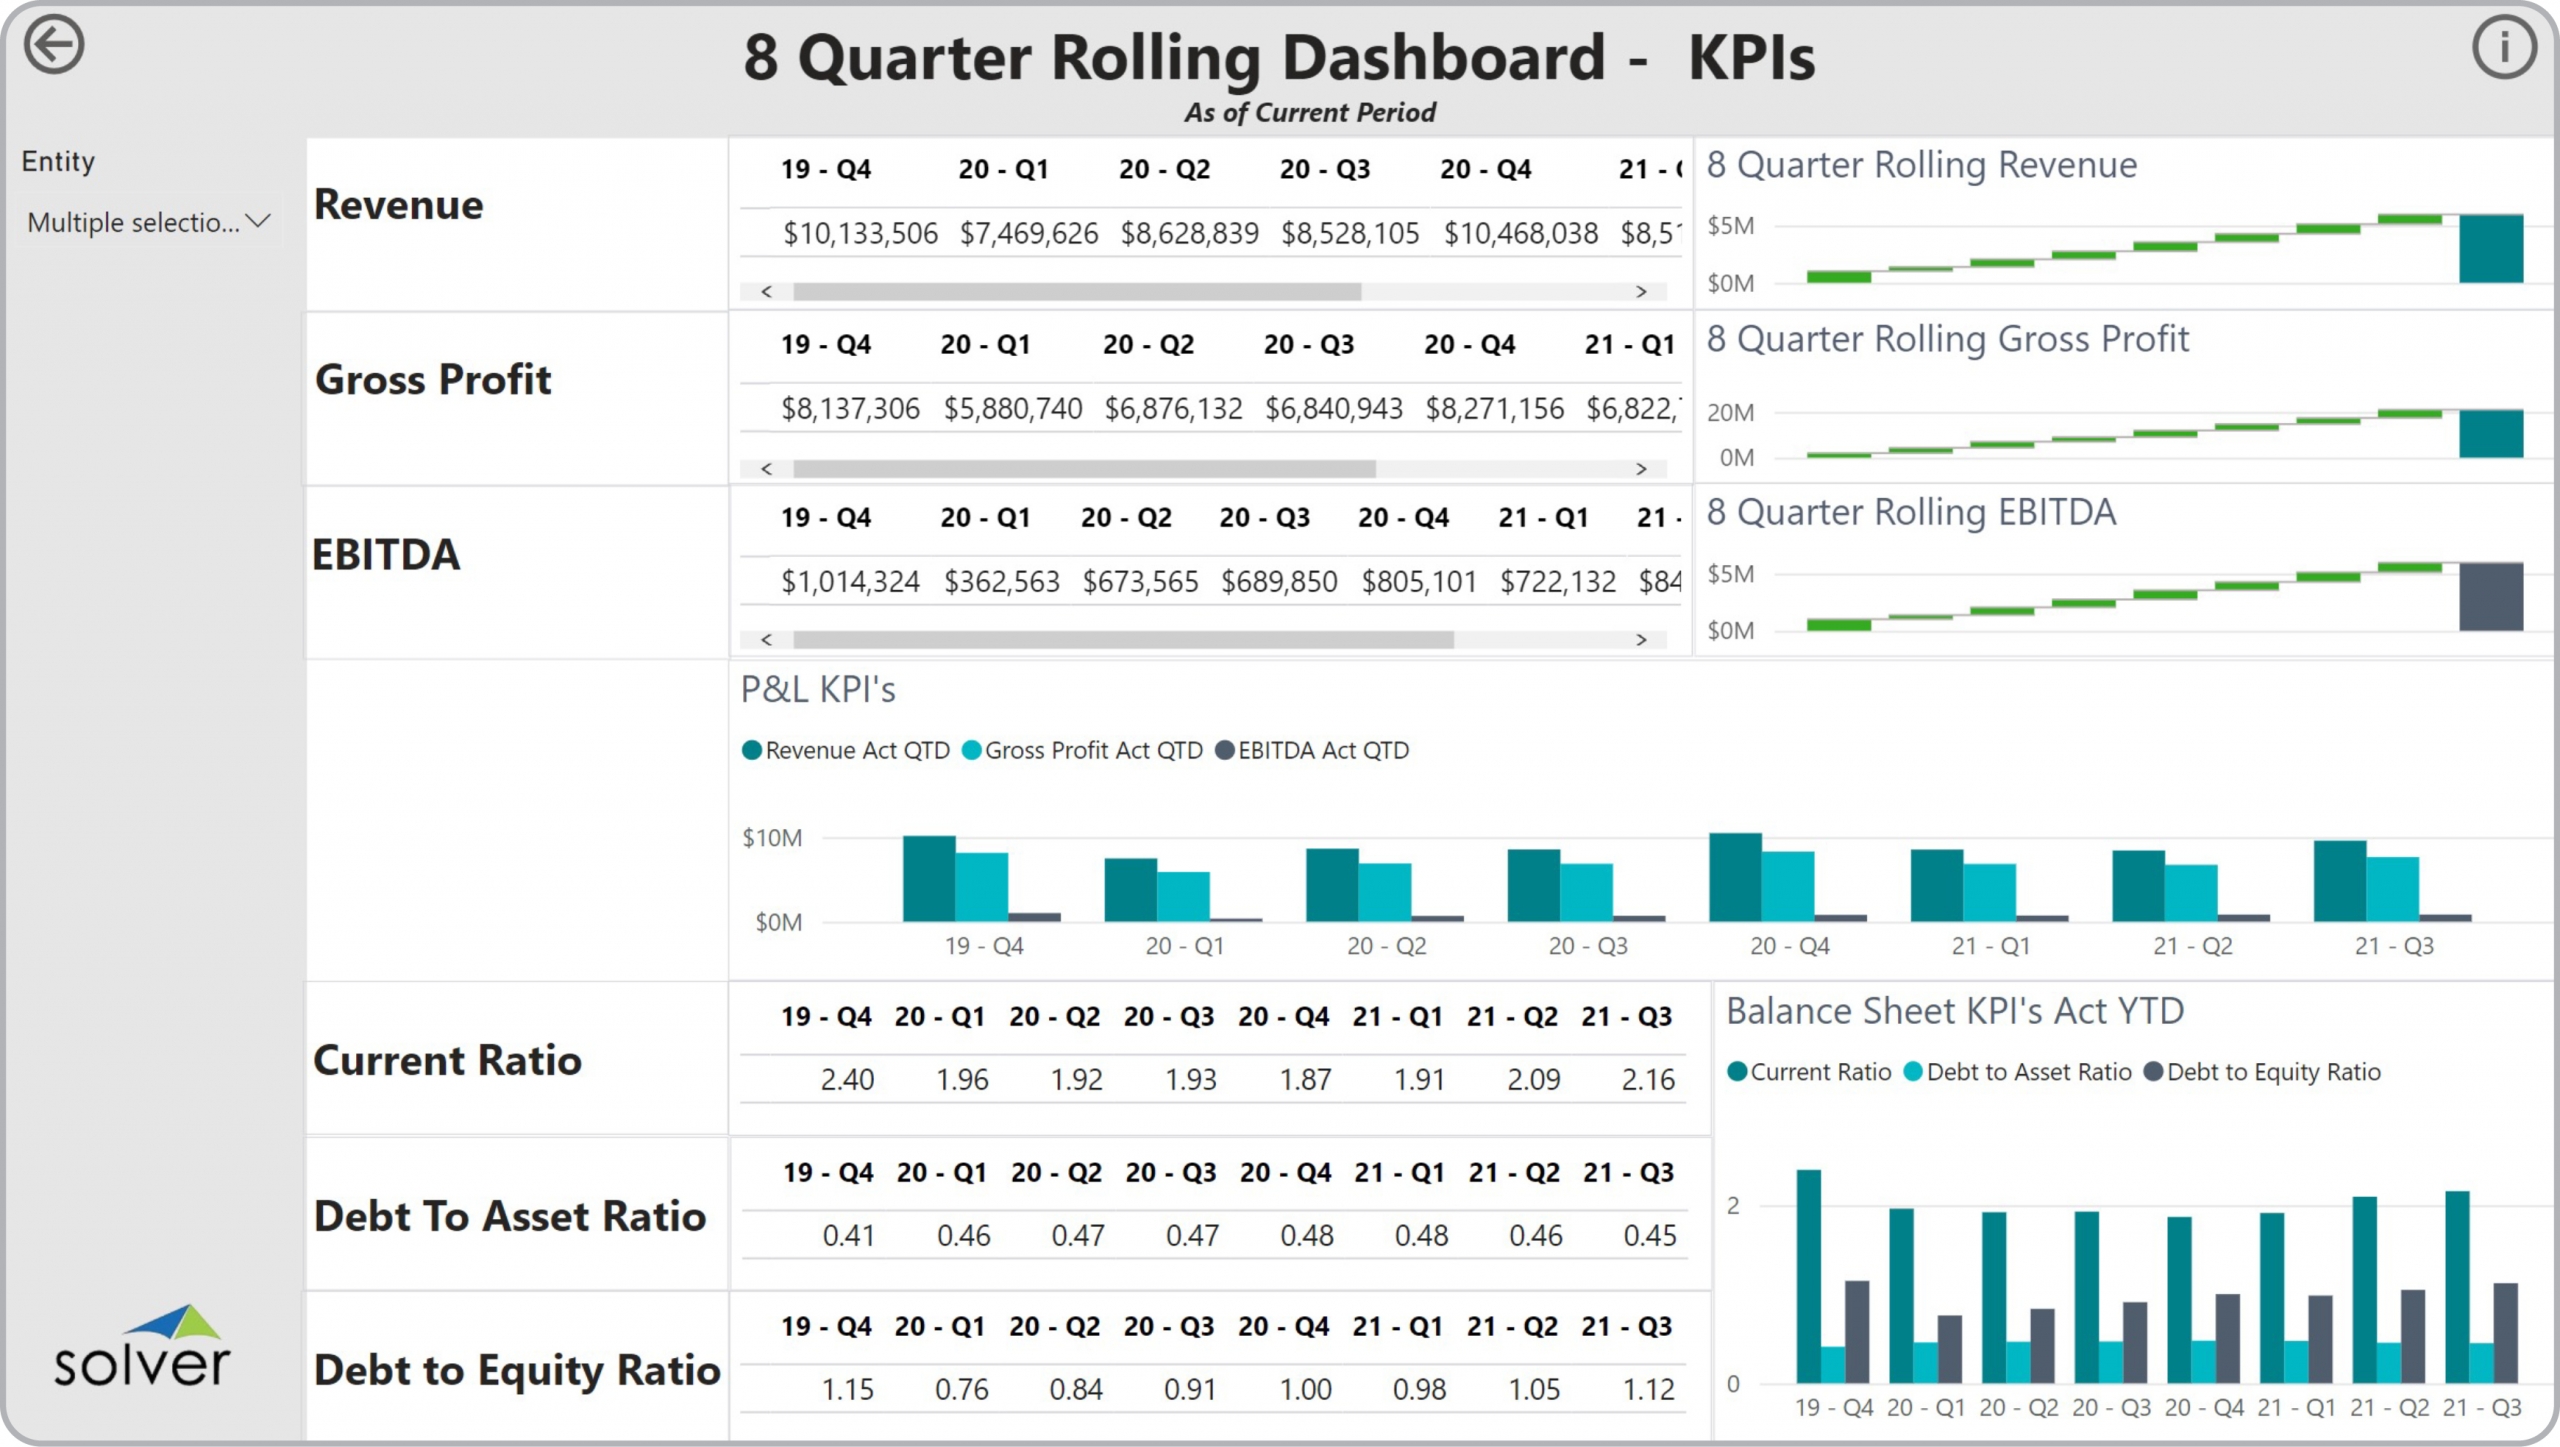
Using 8 Quarter Rolling KPI Dashboards to Streamline the Monthly Reporting Process
How can Financial Dashboard s Drive Faster and Better Decisions? As CFOs increasingly become key ...
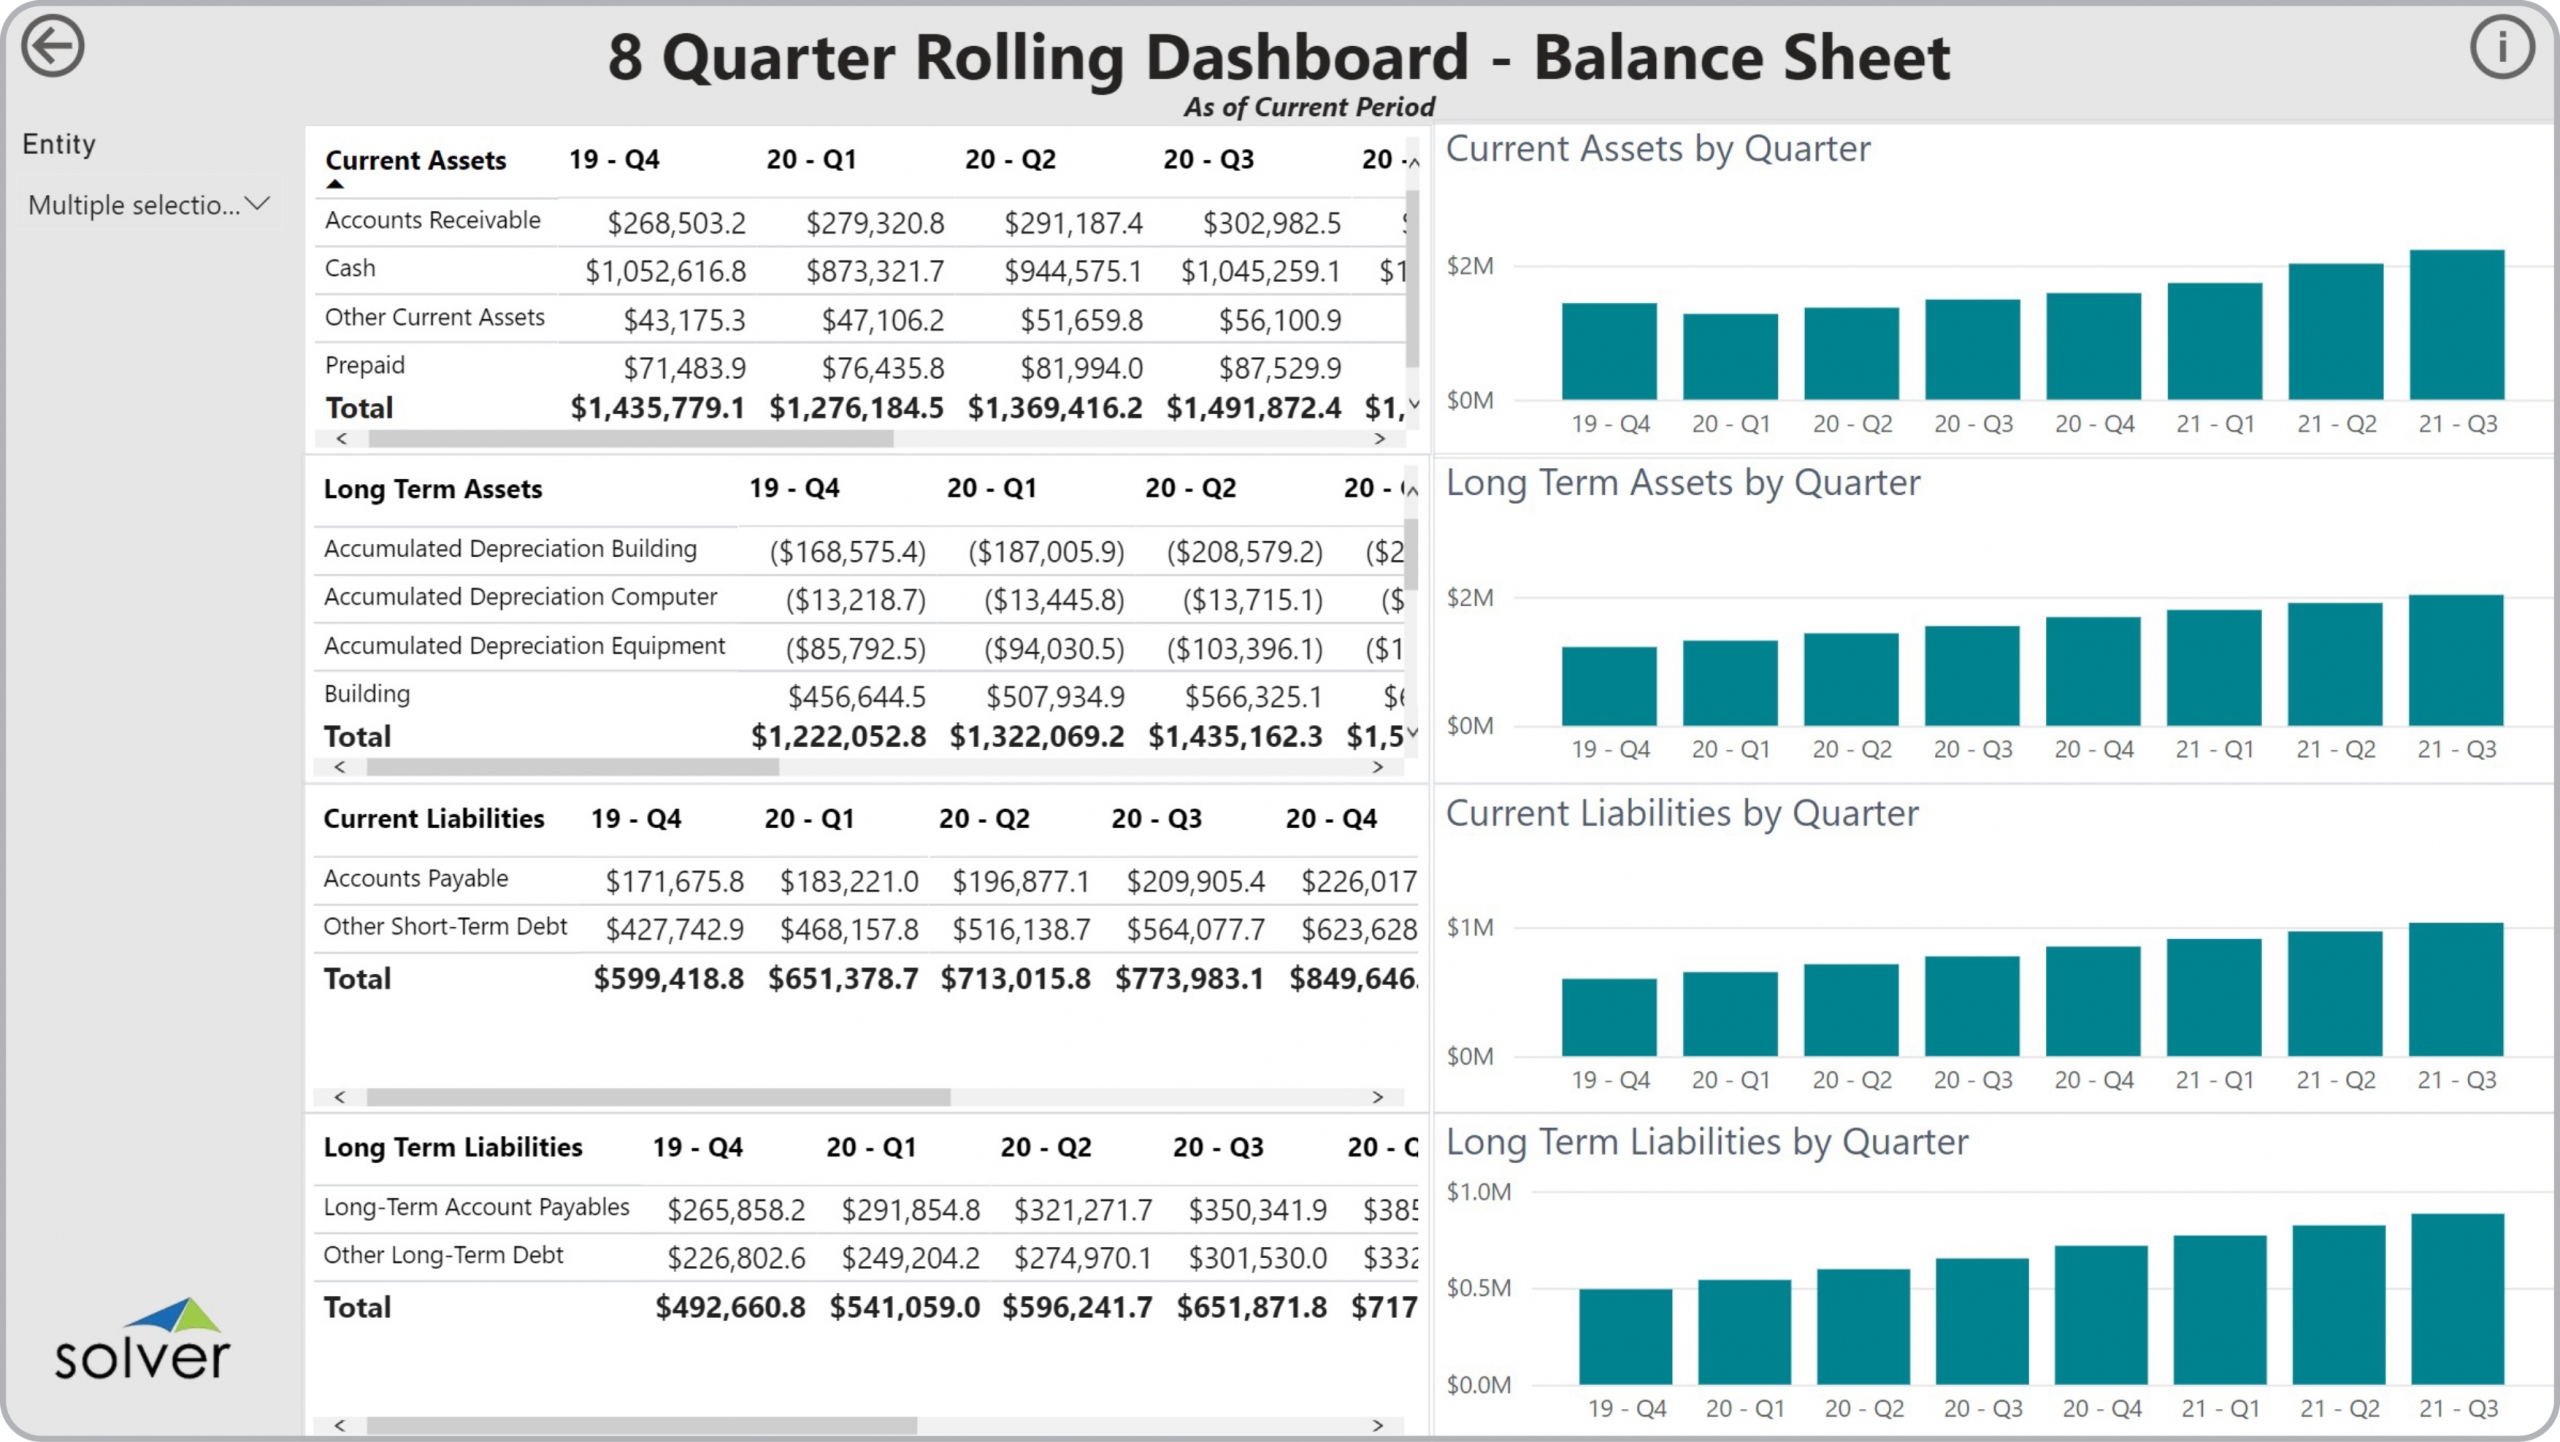
Using 8 Quarter Rolling Balance Sheet Dashboards to Streamline the Monthly Reporting Process
How can Financial Dashboard s Drive Faster and Better Decisions? As CFOs increasingly become key ...
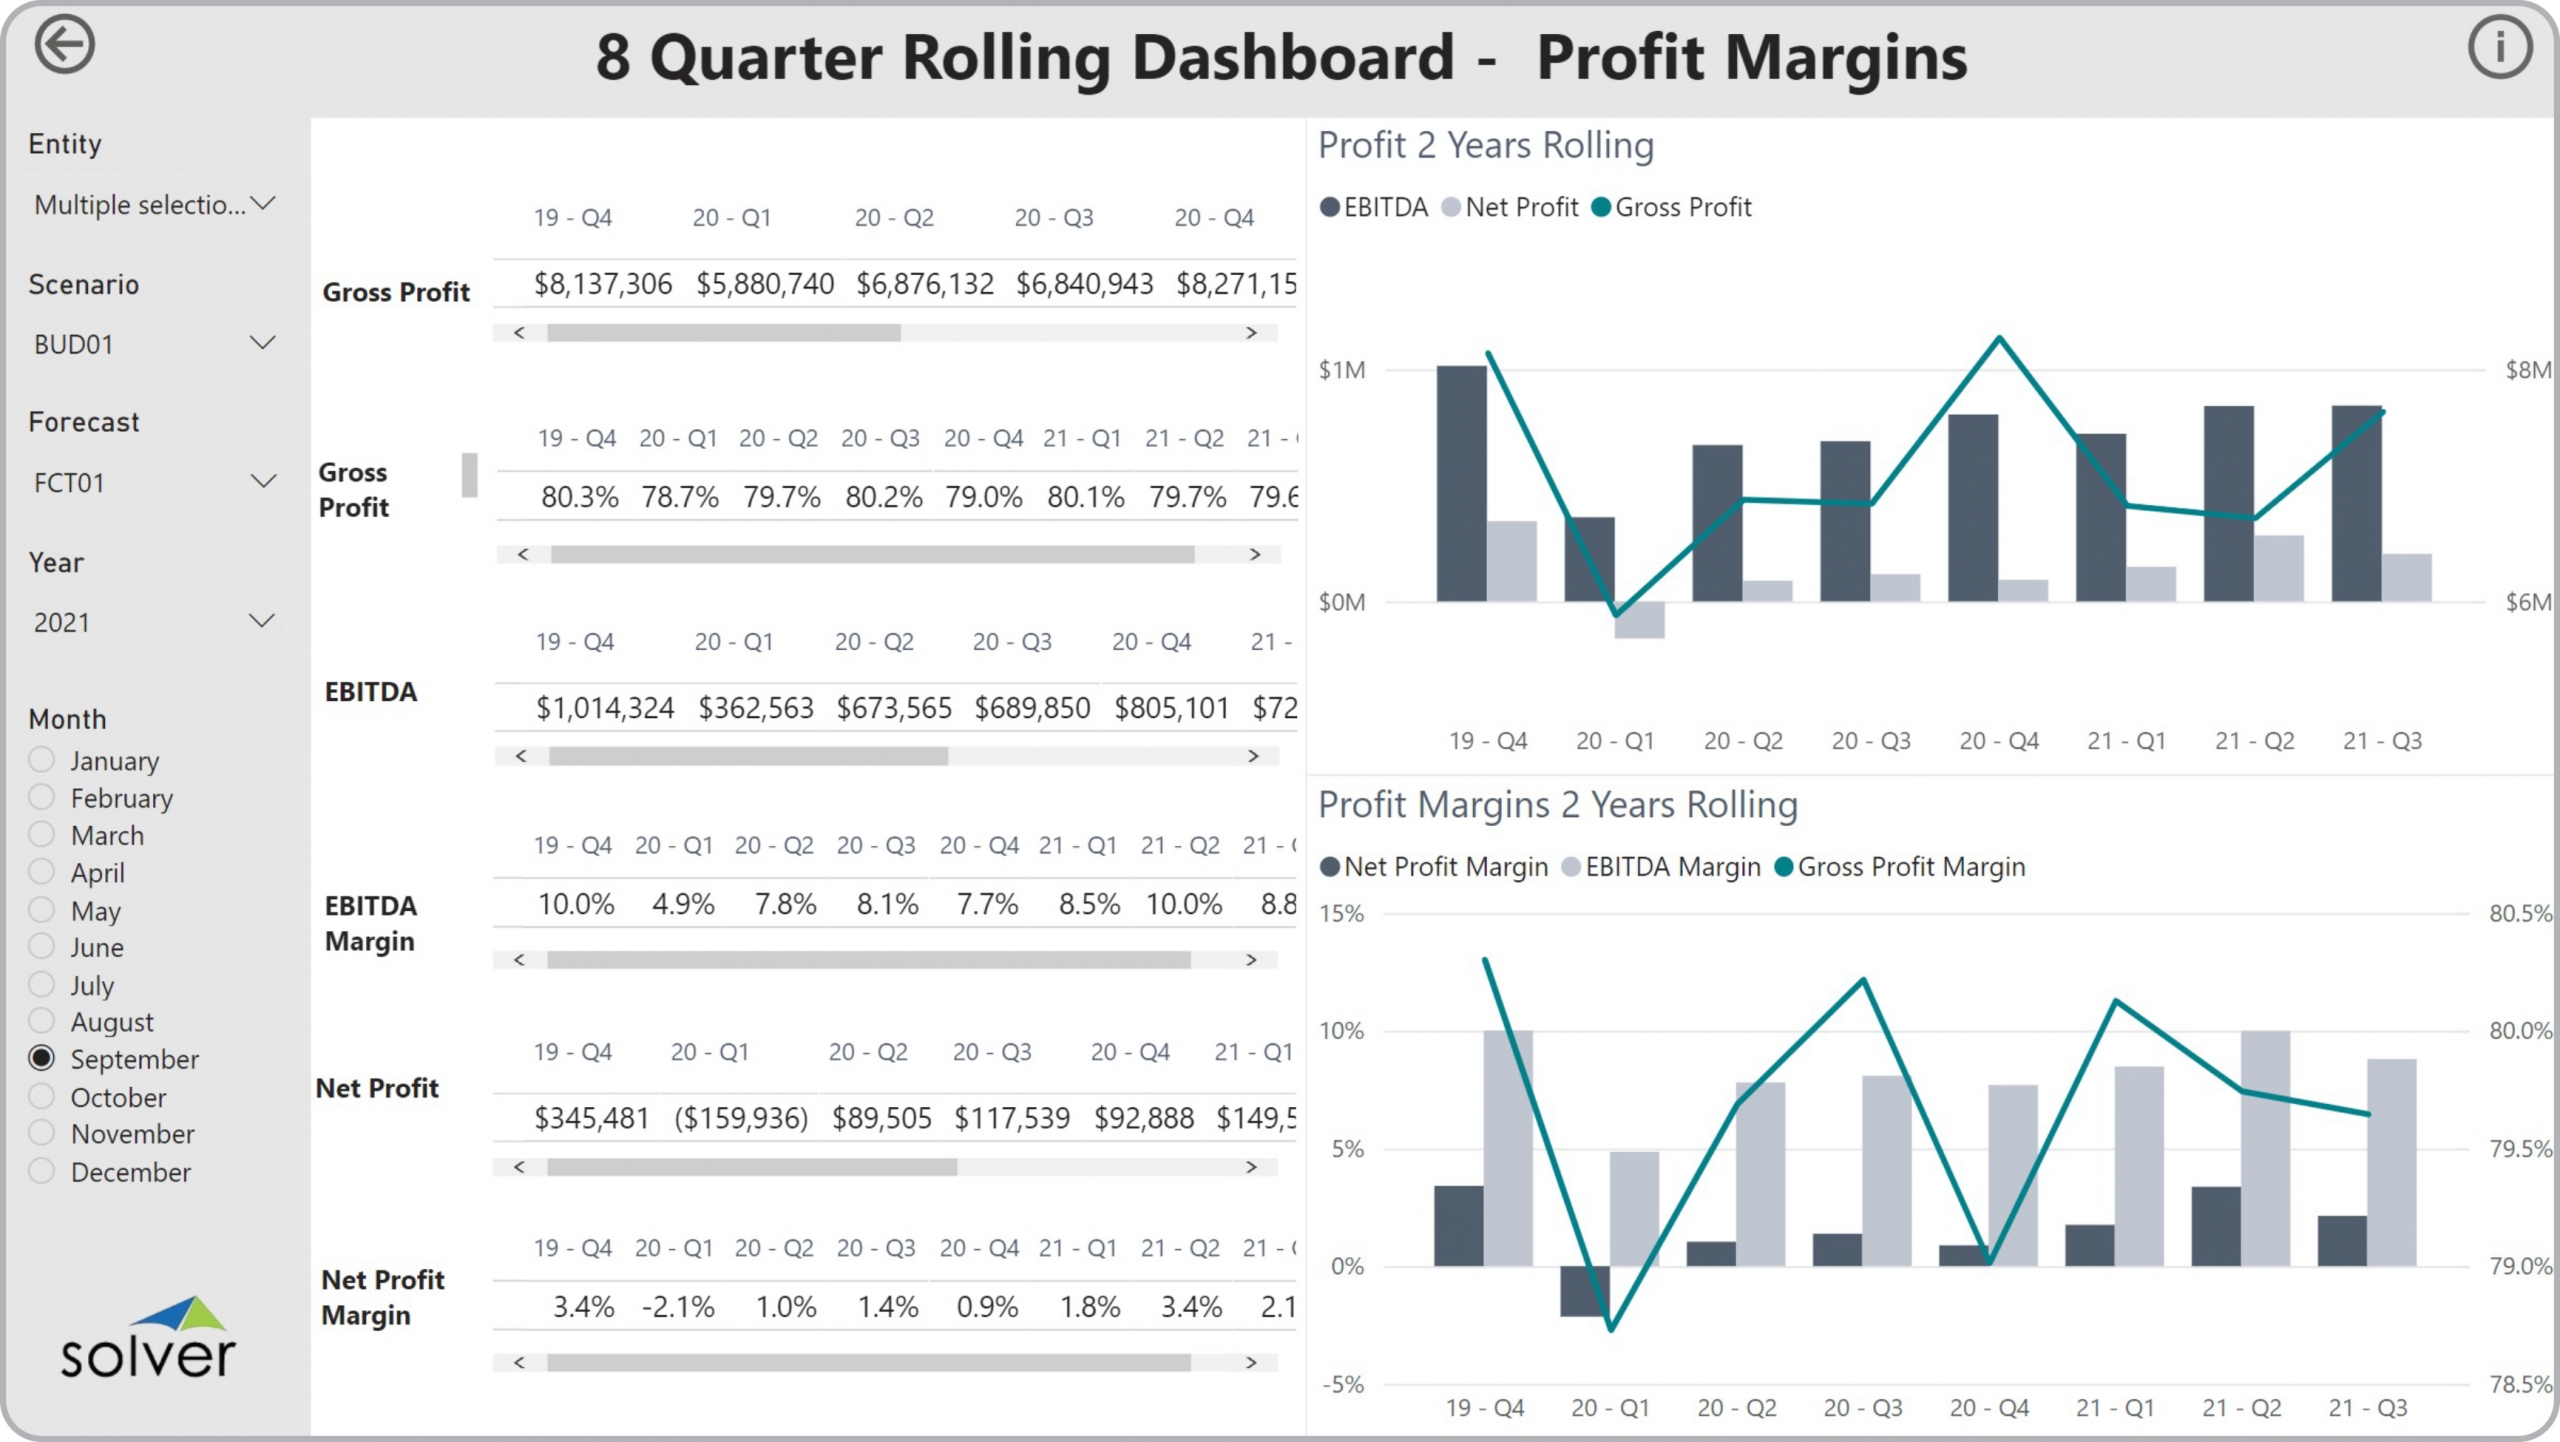
Using 8 Quarter Rolling Profit Margin Dashboards to Streamline the Monthly Reporting Process
How can Financial Dashboard s Drive Faster and Better Decisions? As CFOs increasingly become key ...
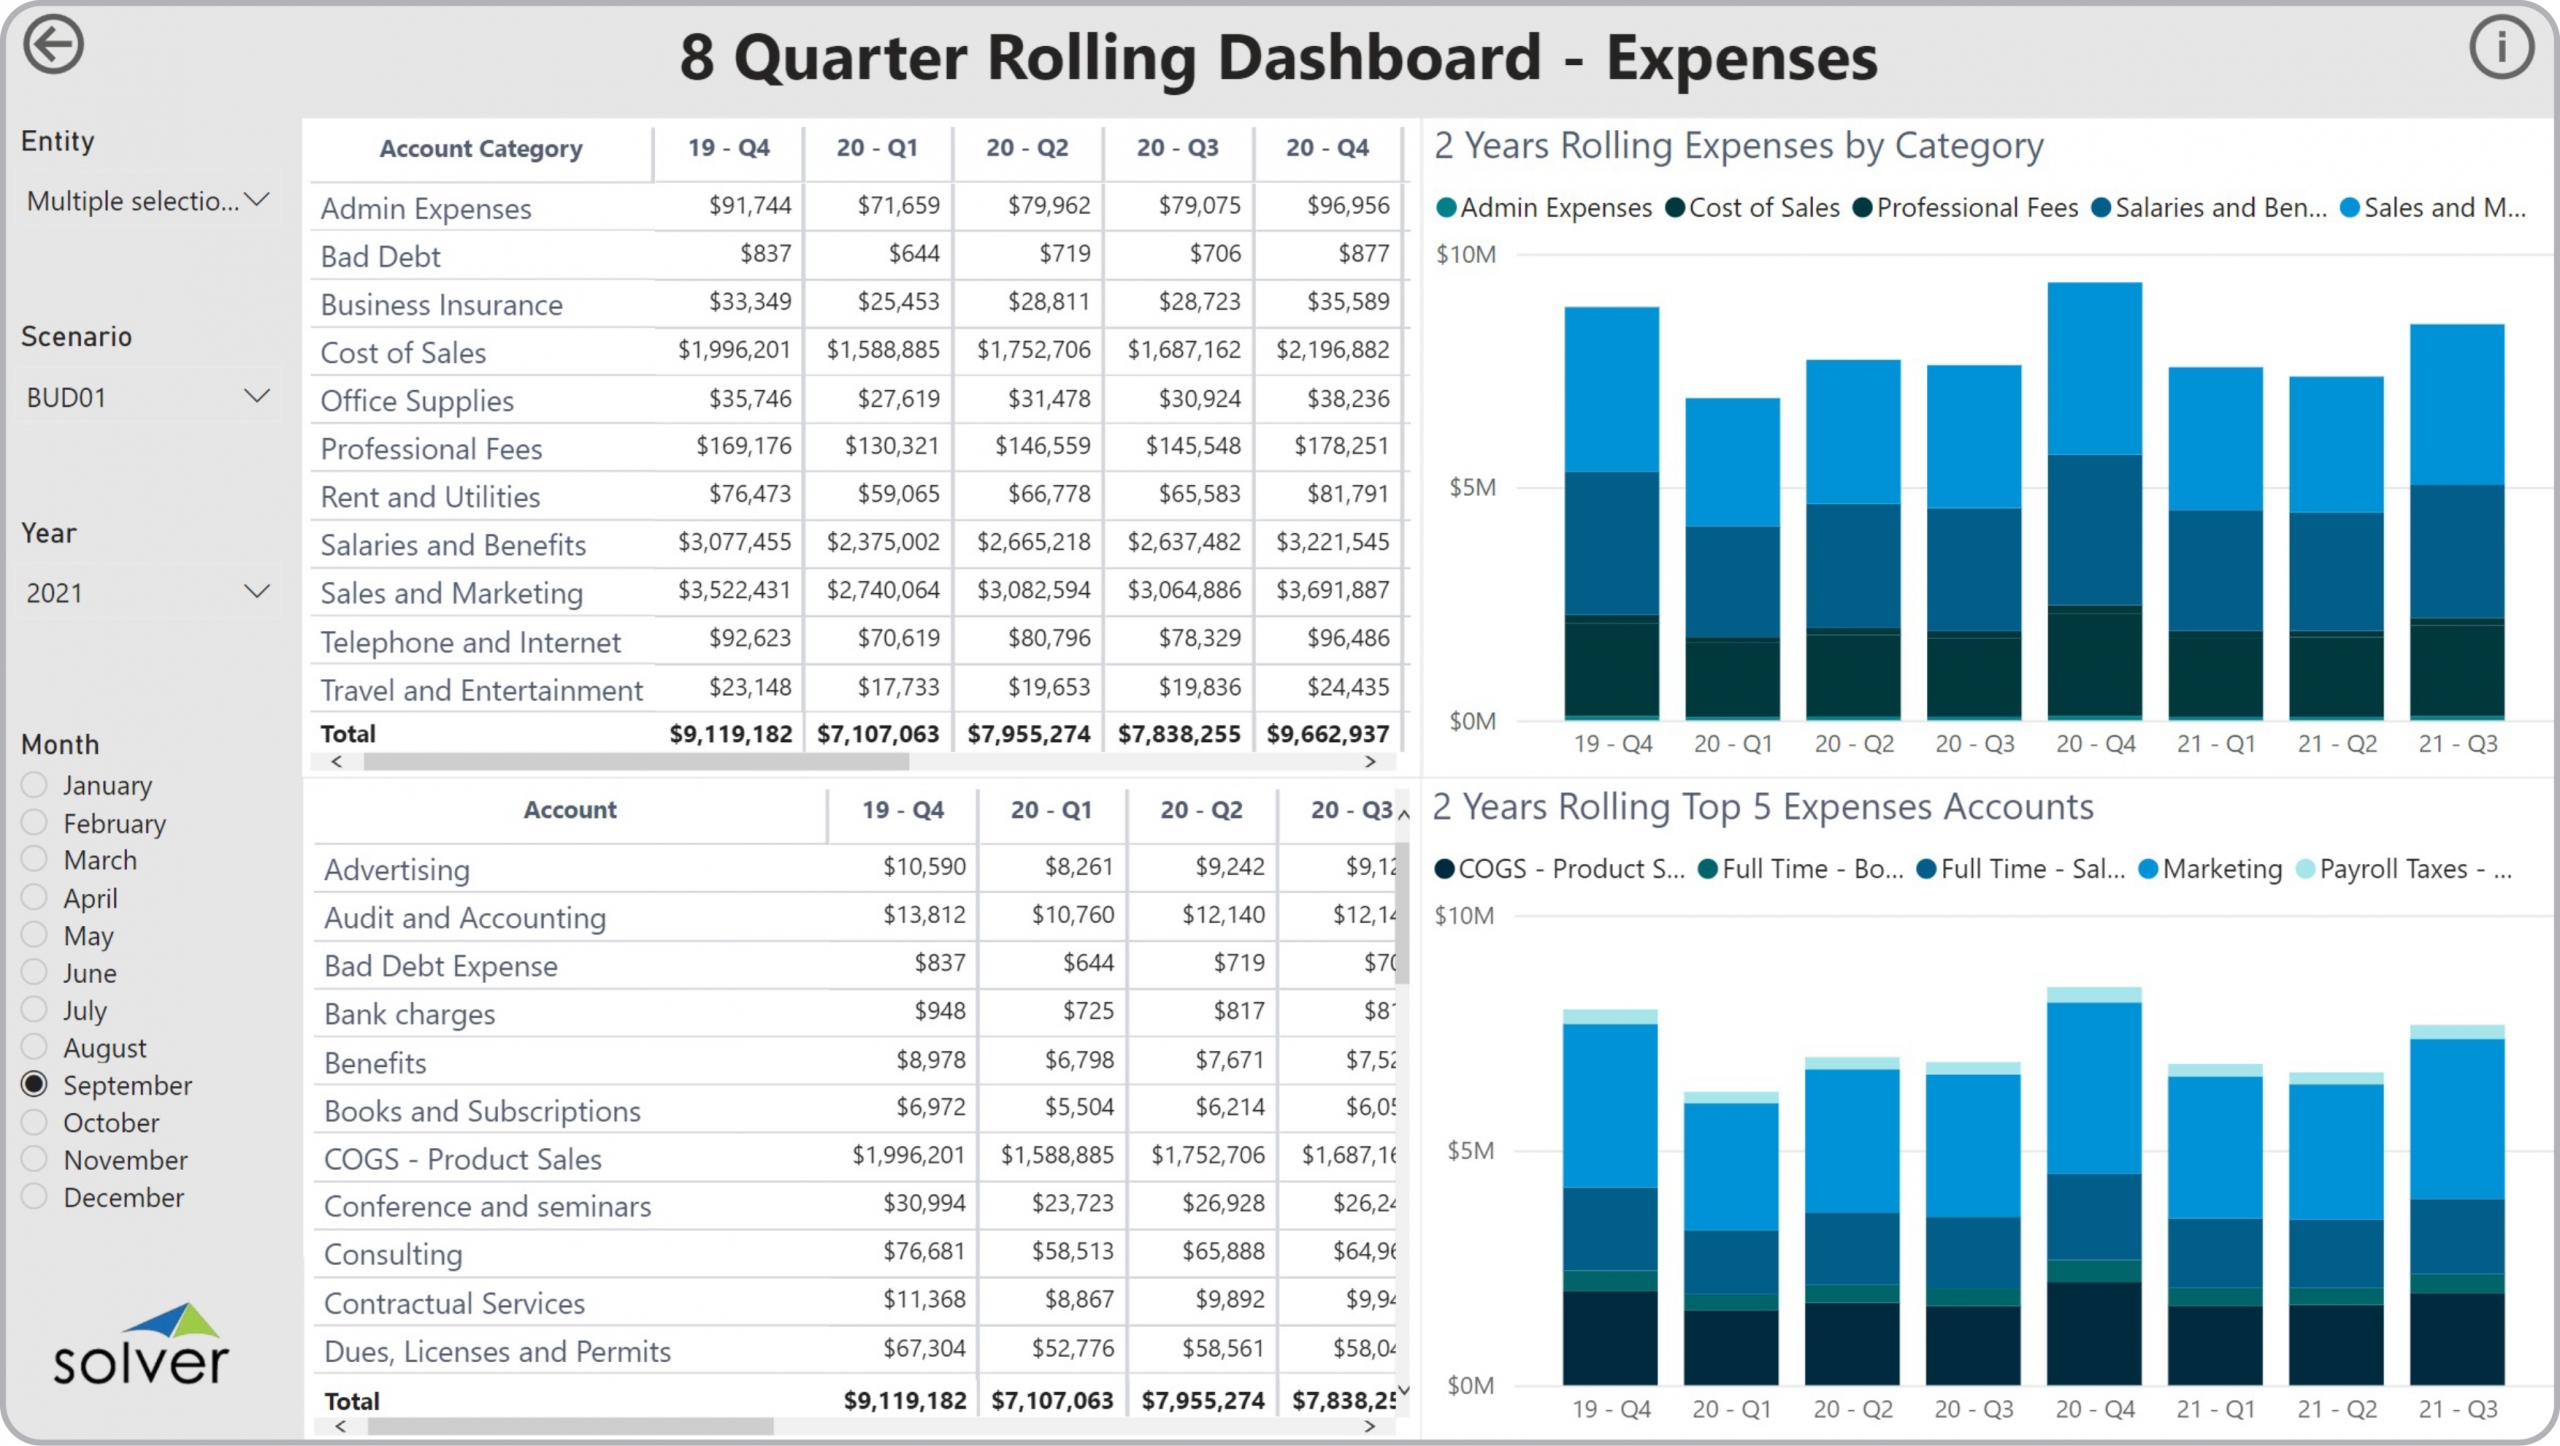
Using 8 Quarter Rolling Expense Dashboards to Streamline the Monthly Reporting Process
How can Financial Dashboard s Drive Faster and Better Decisions? As CFOs increasingly become key ...
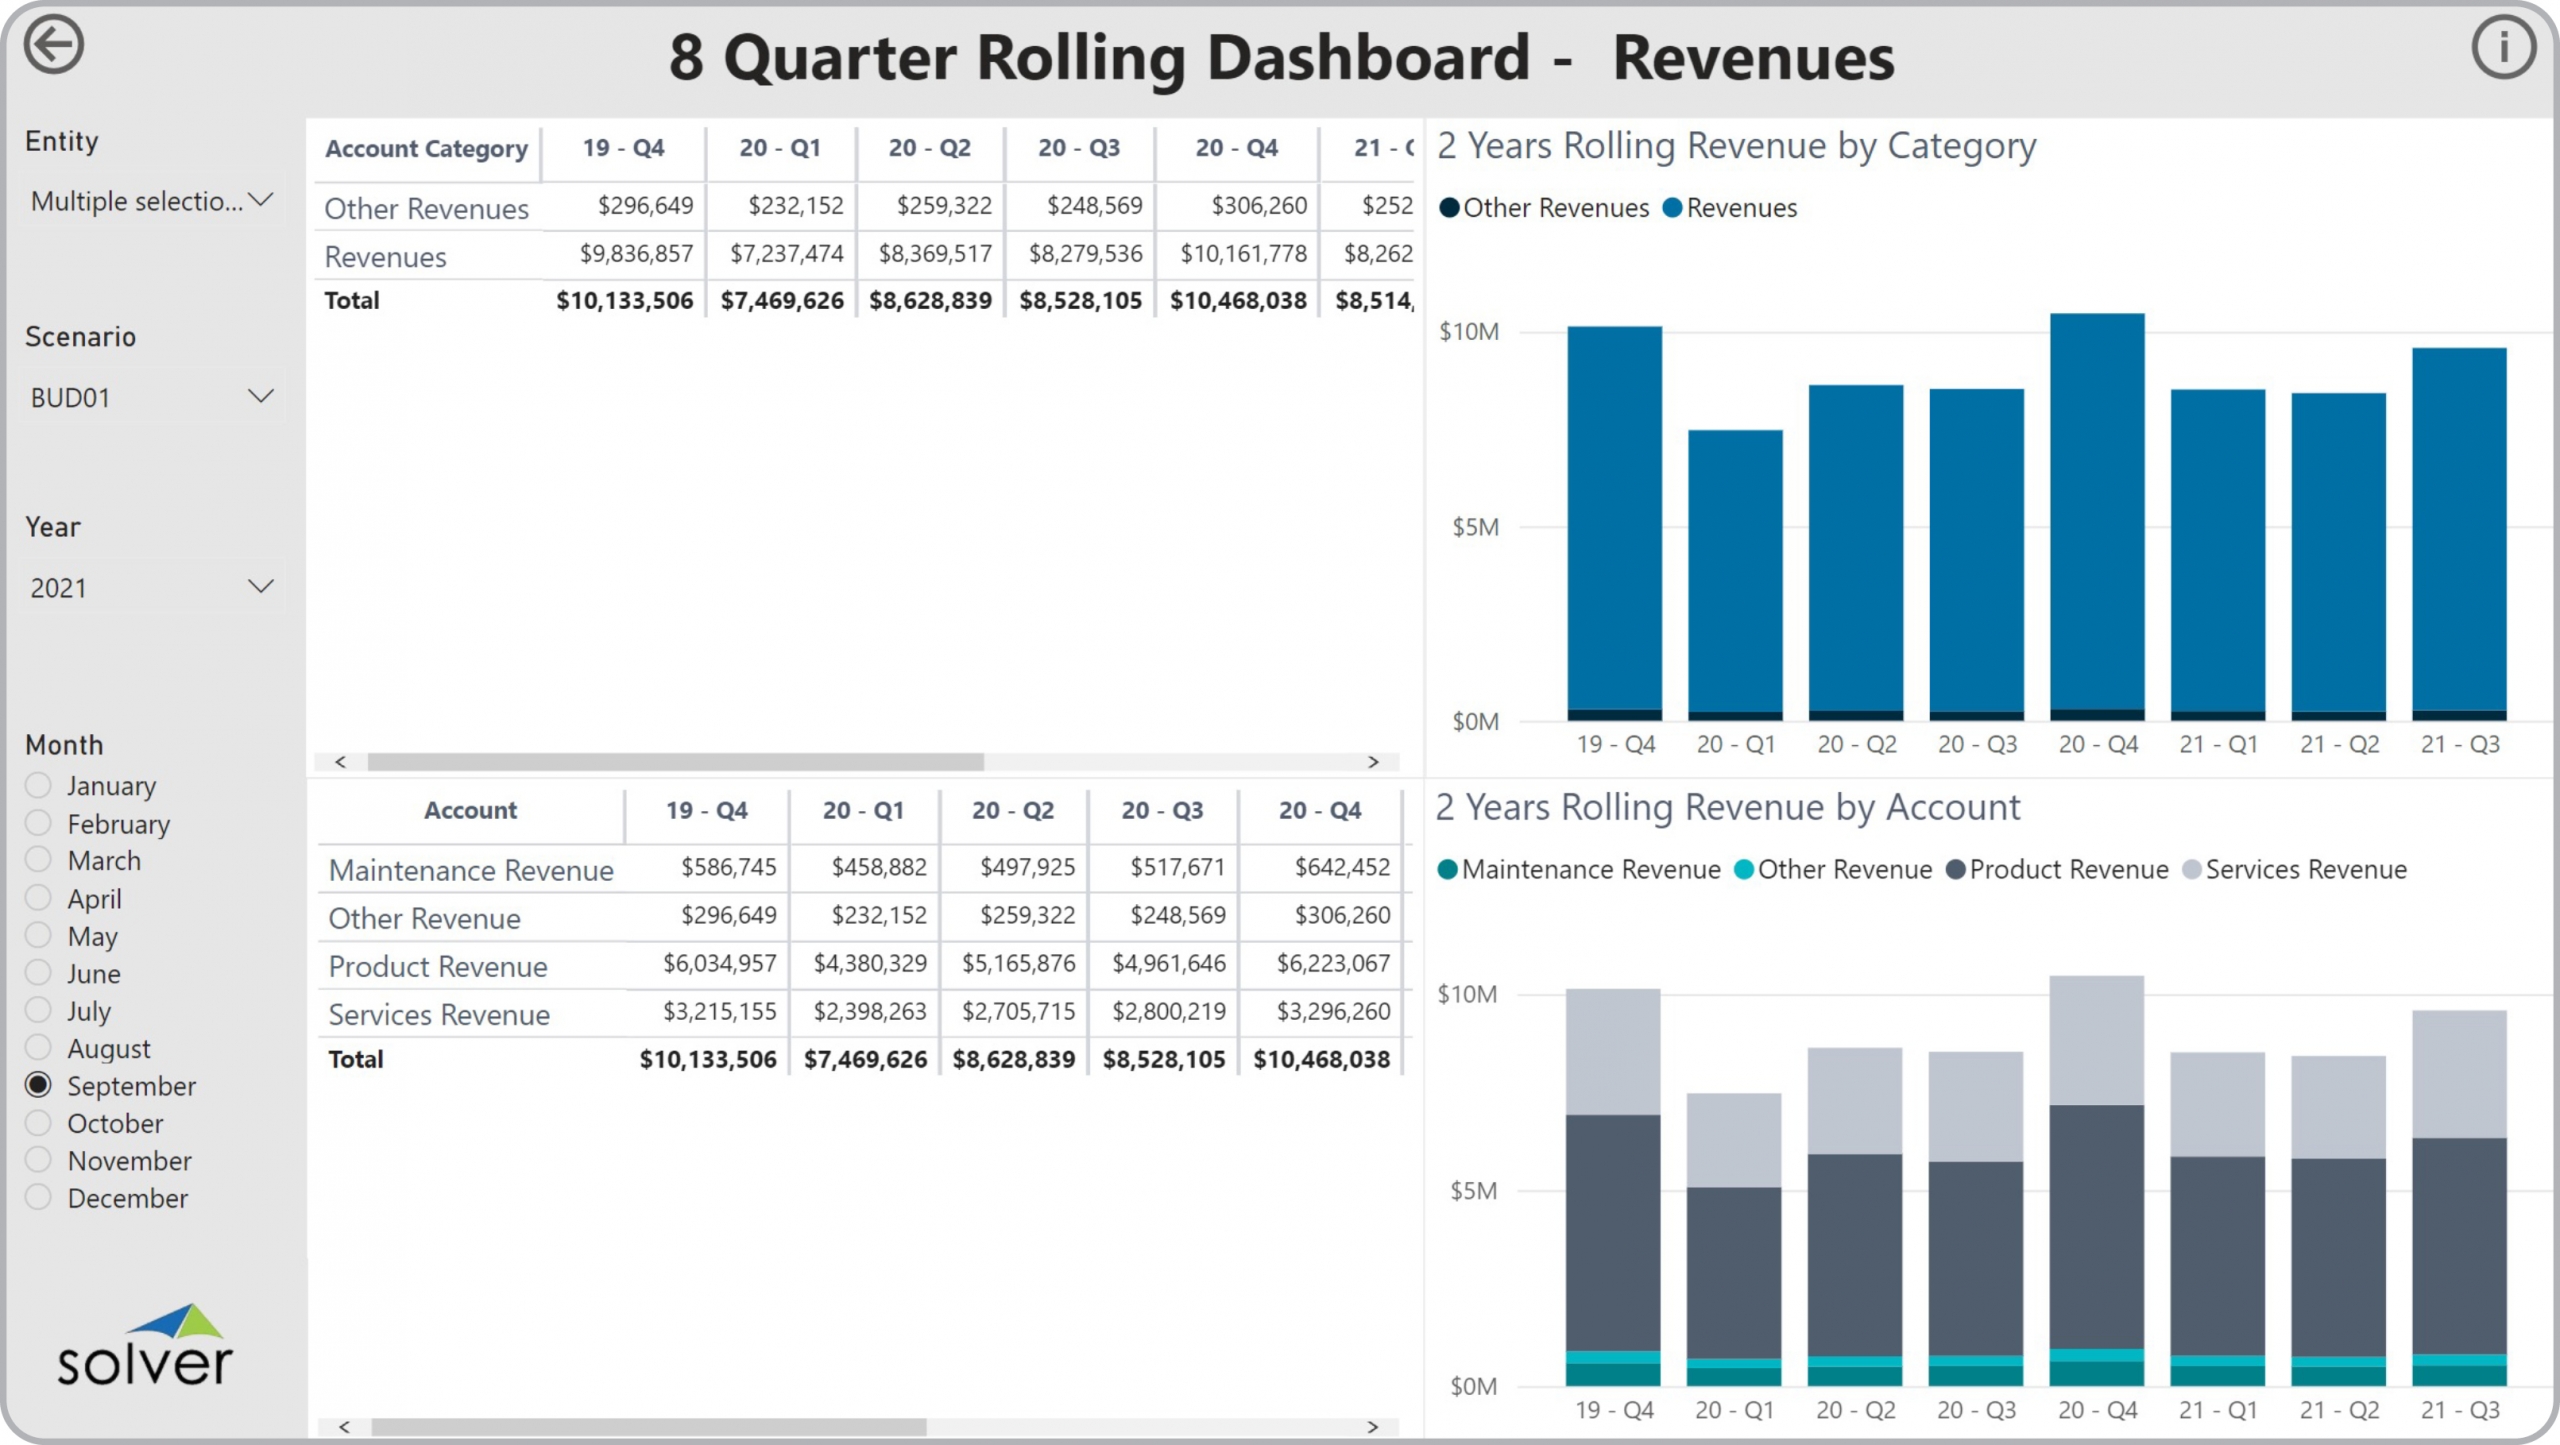
Using 8 Quarter Rolling Revenue Dashboards to Streamline the Monthly Reporting Process
How can Financial Dashboard s Drive Faster and Better Decisions? As CFOs increasingly become key ...
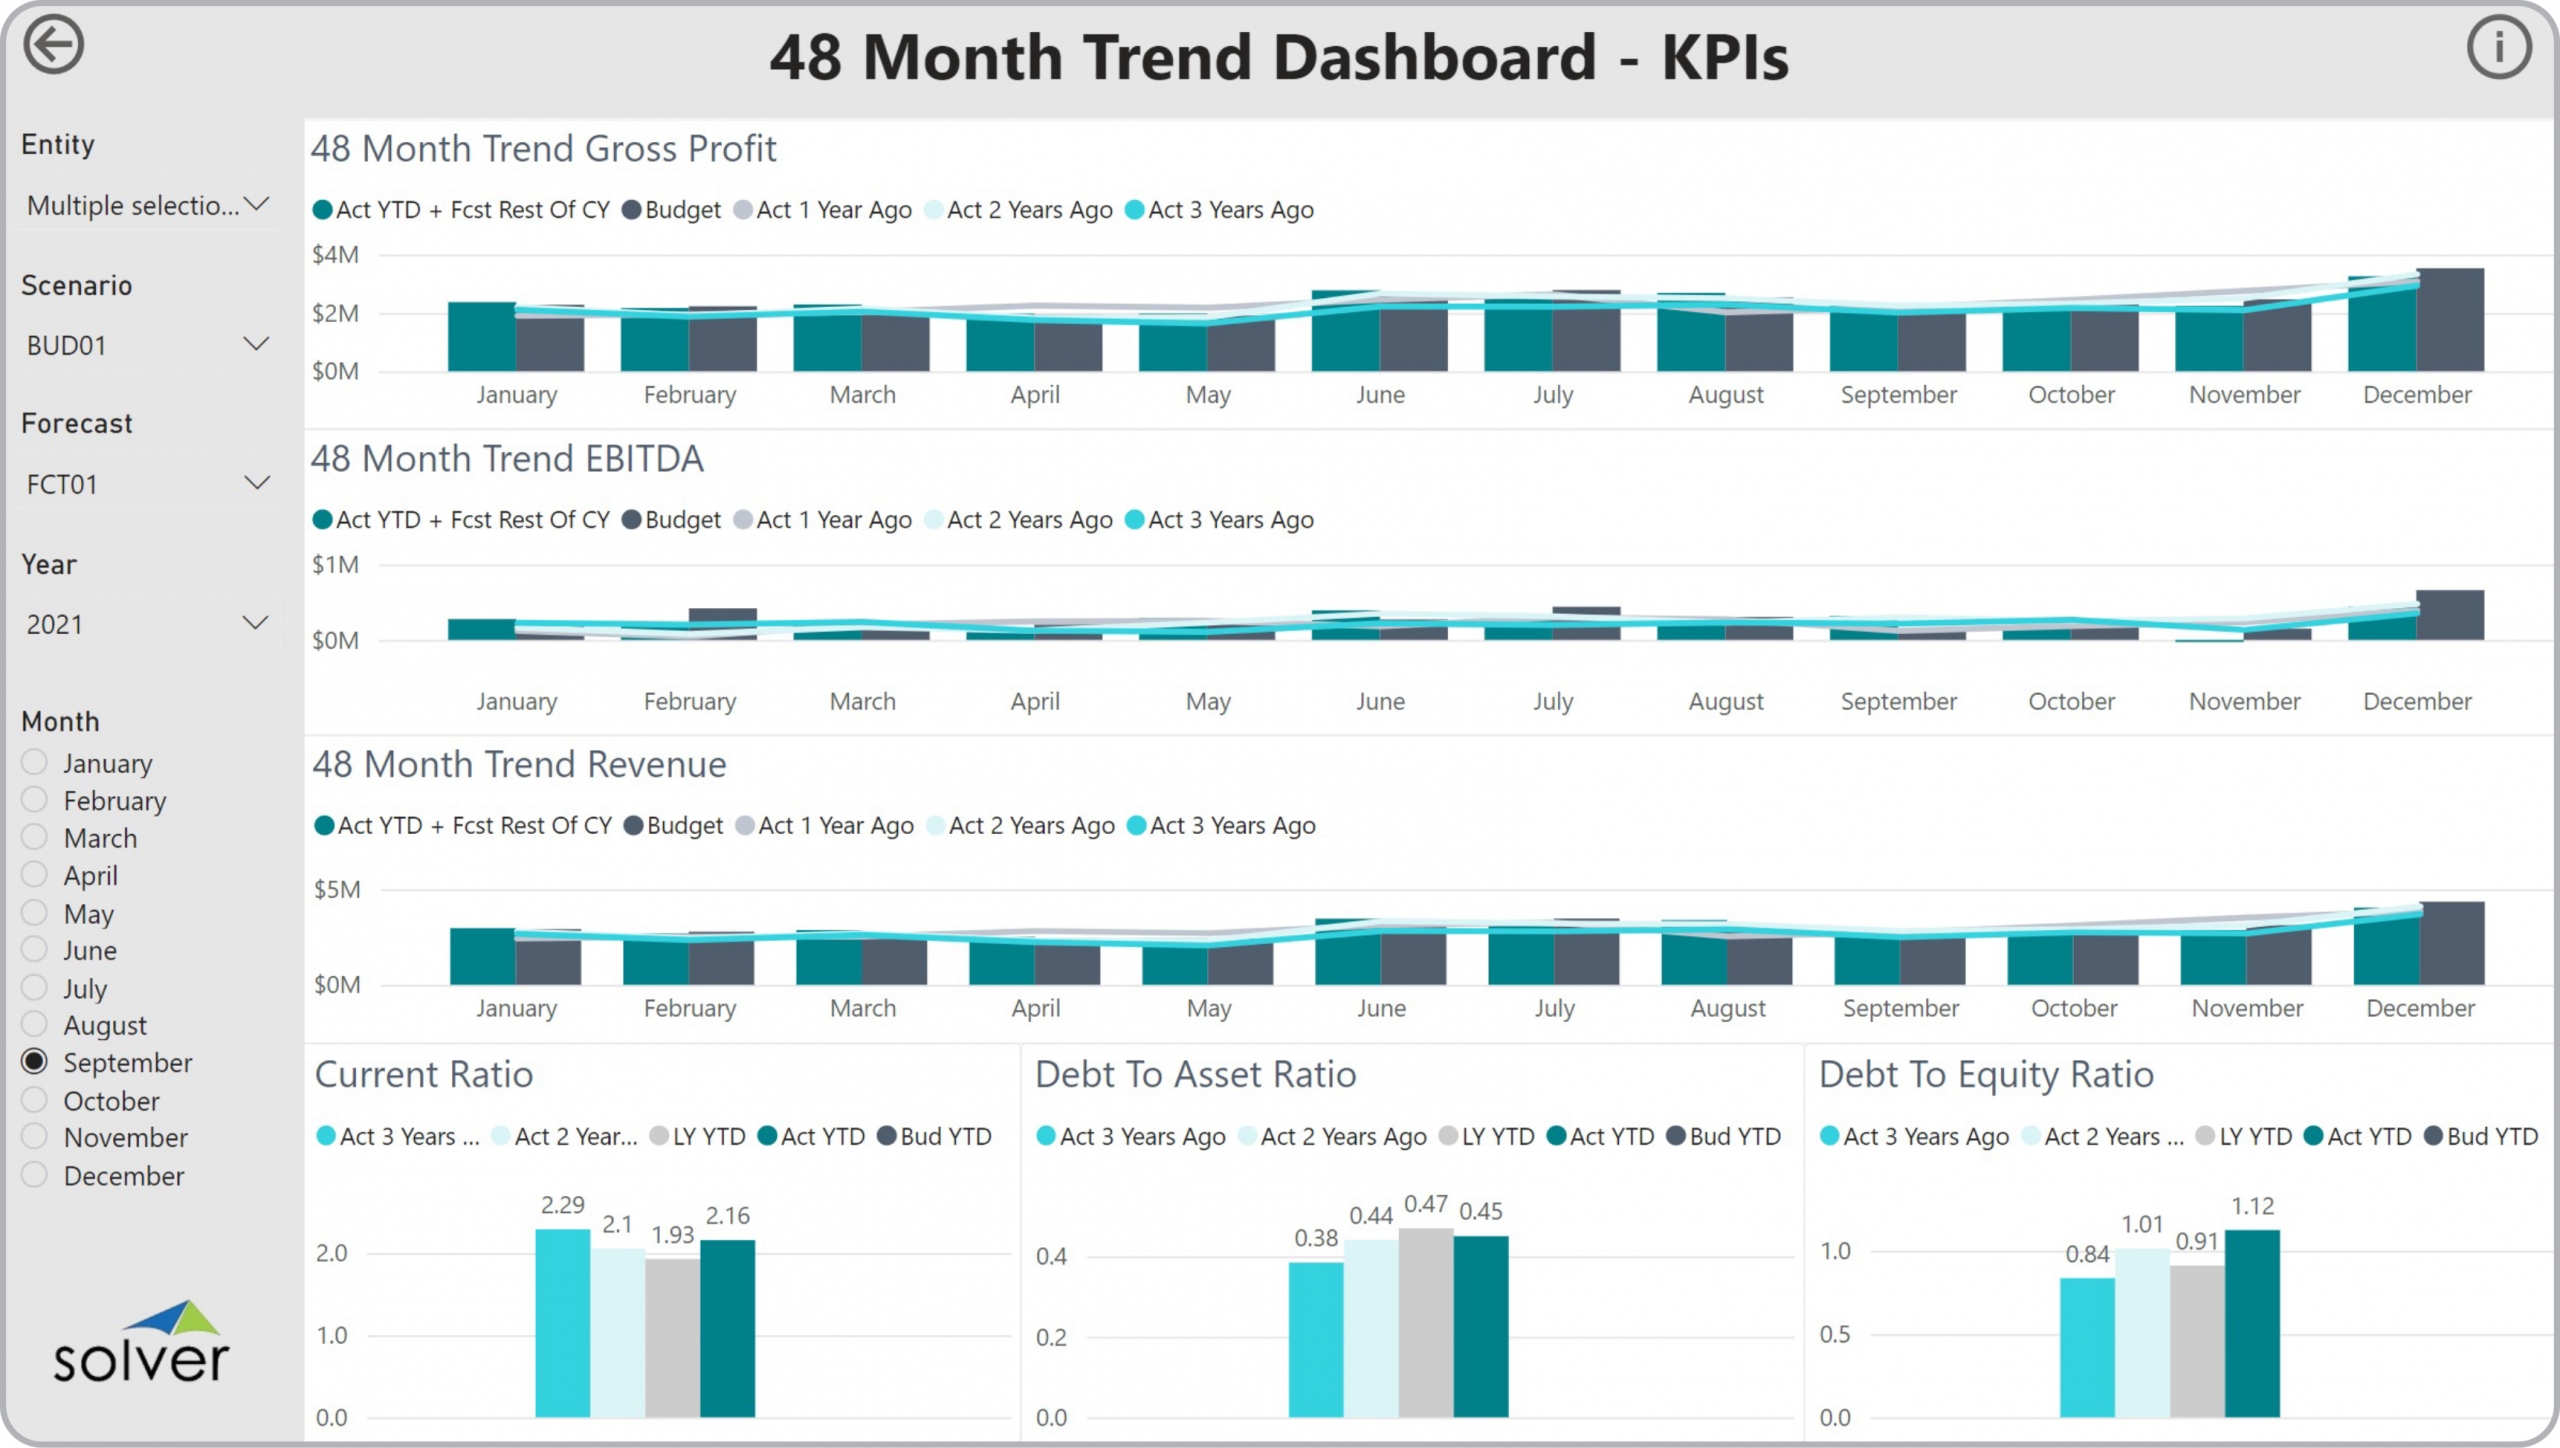
Using 48 Month KPI Trend Dashboards to Streamline the Monthly Reporting Process
How can Financial Dashboard s Drive Faster and Better Decisions? As CFOs increasingly become key ...
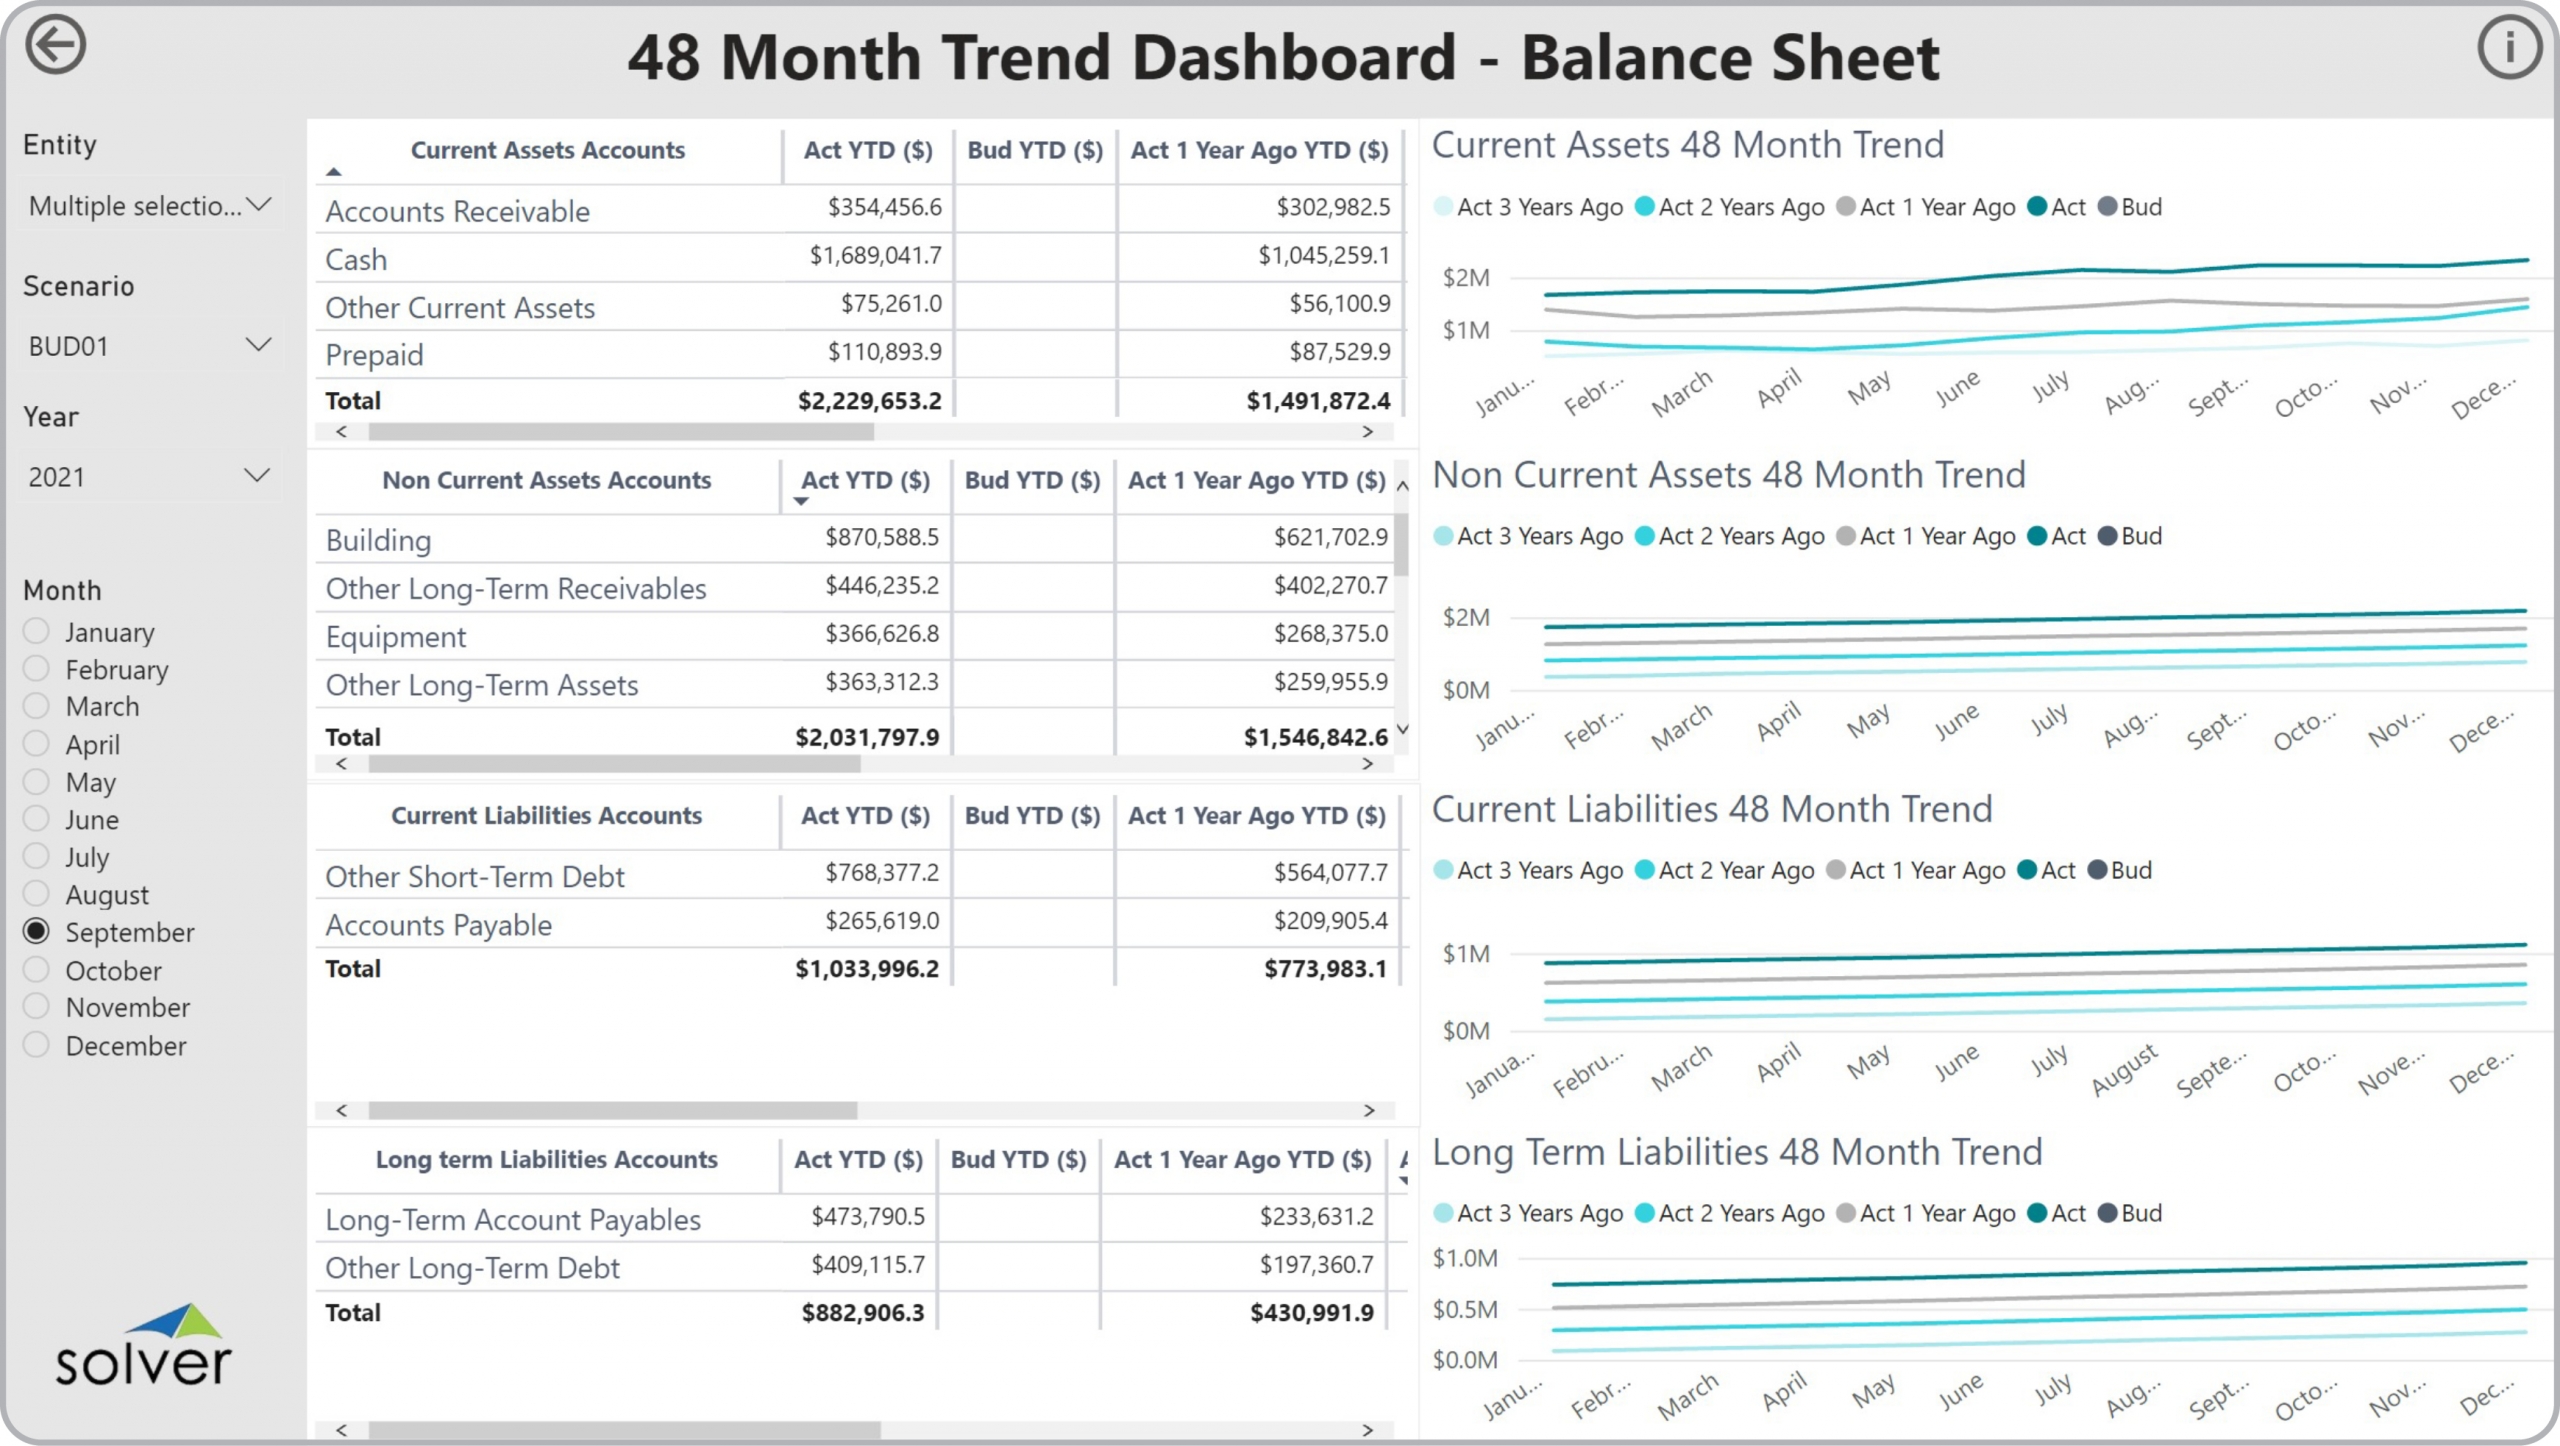
Using 48 Month Balance Sheet Trend Dashboards to Streamline the Monthly Reporting Process
How can Financial Dashboard s Drive Faster and Better Decisions? As CFOs increasingly become key ...
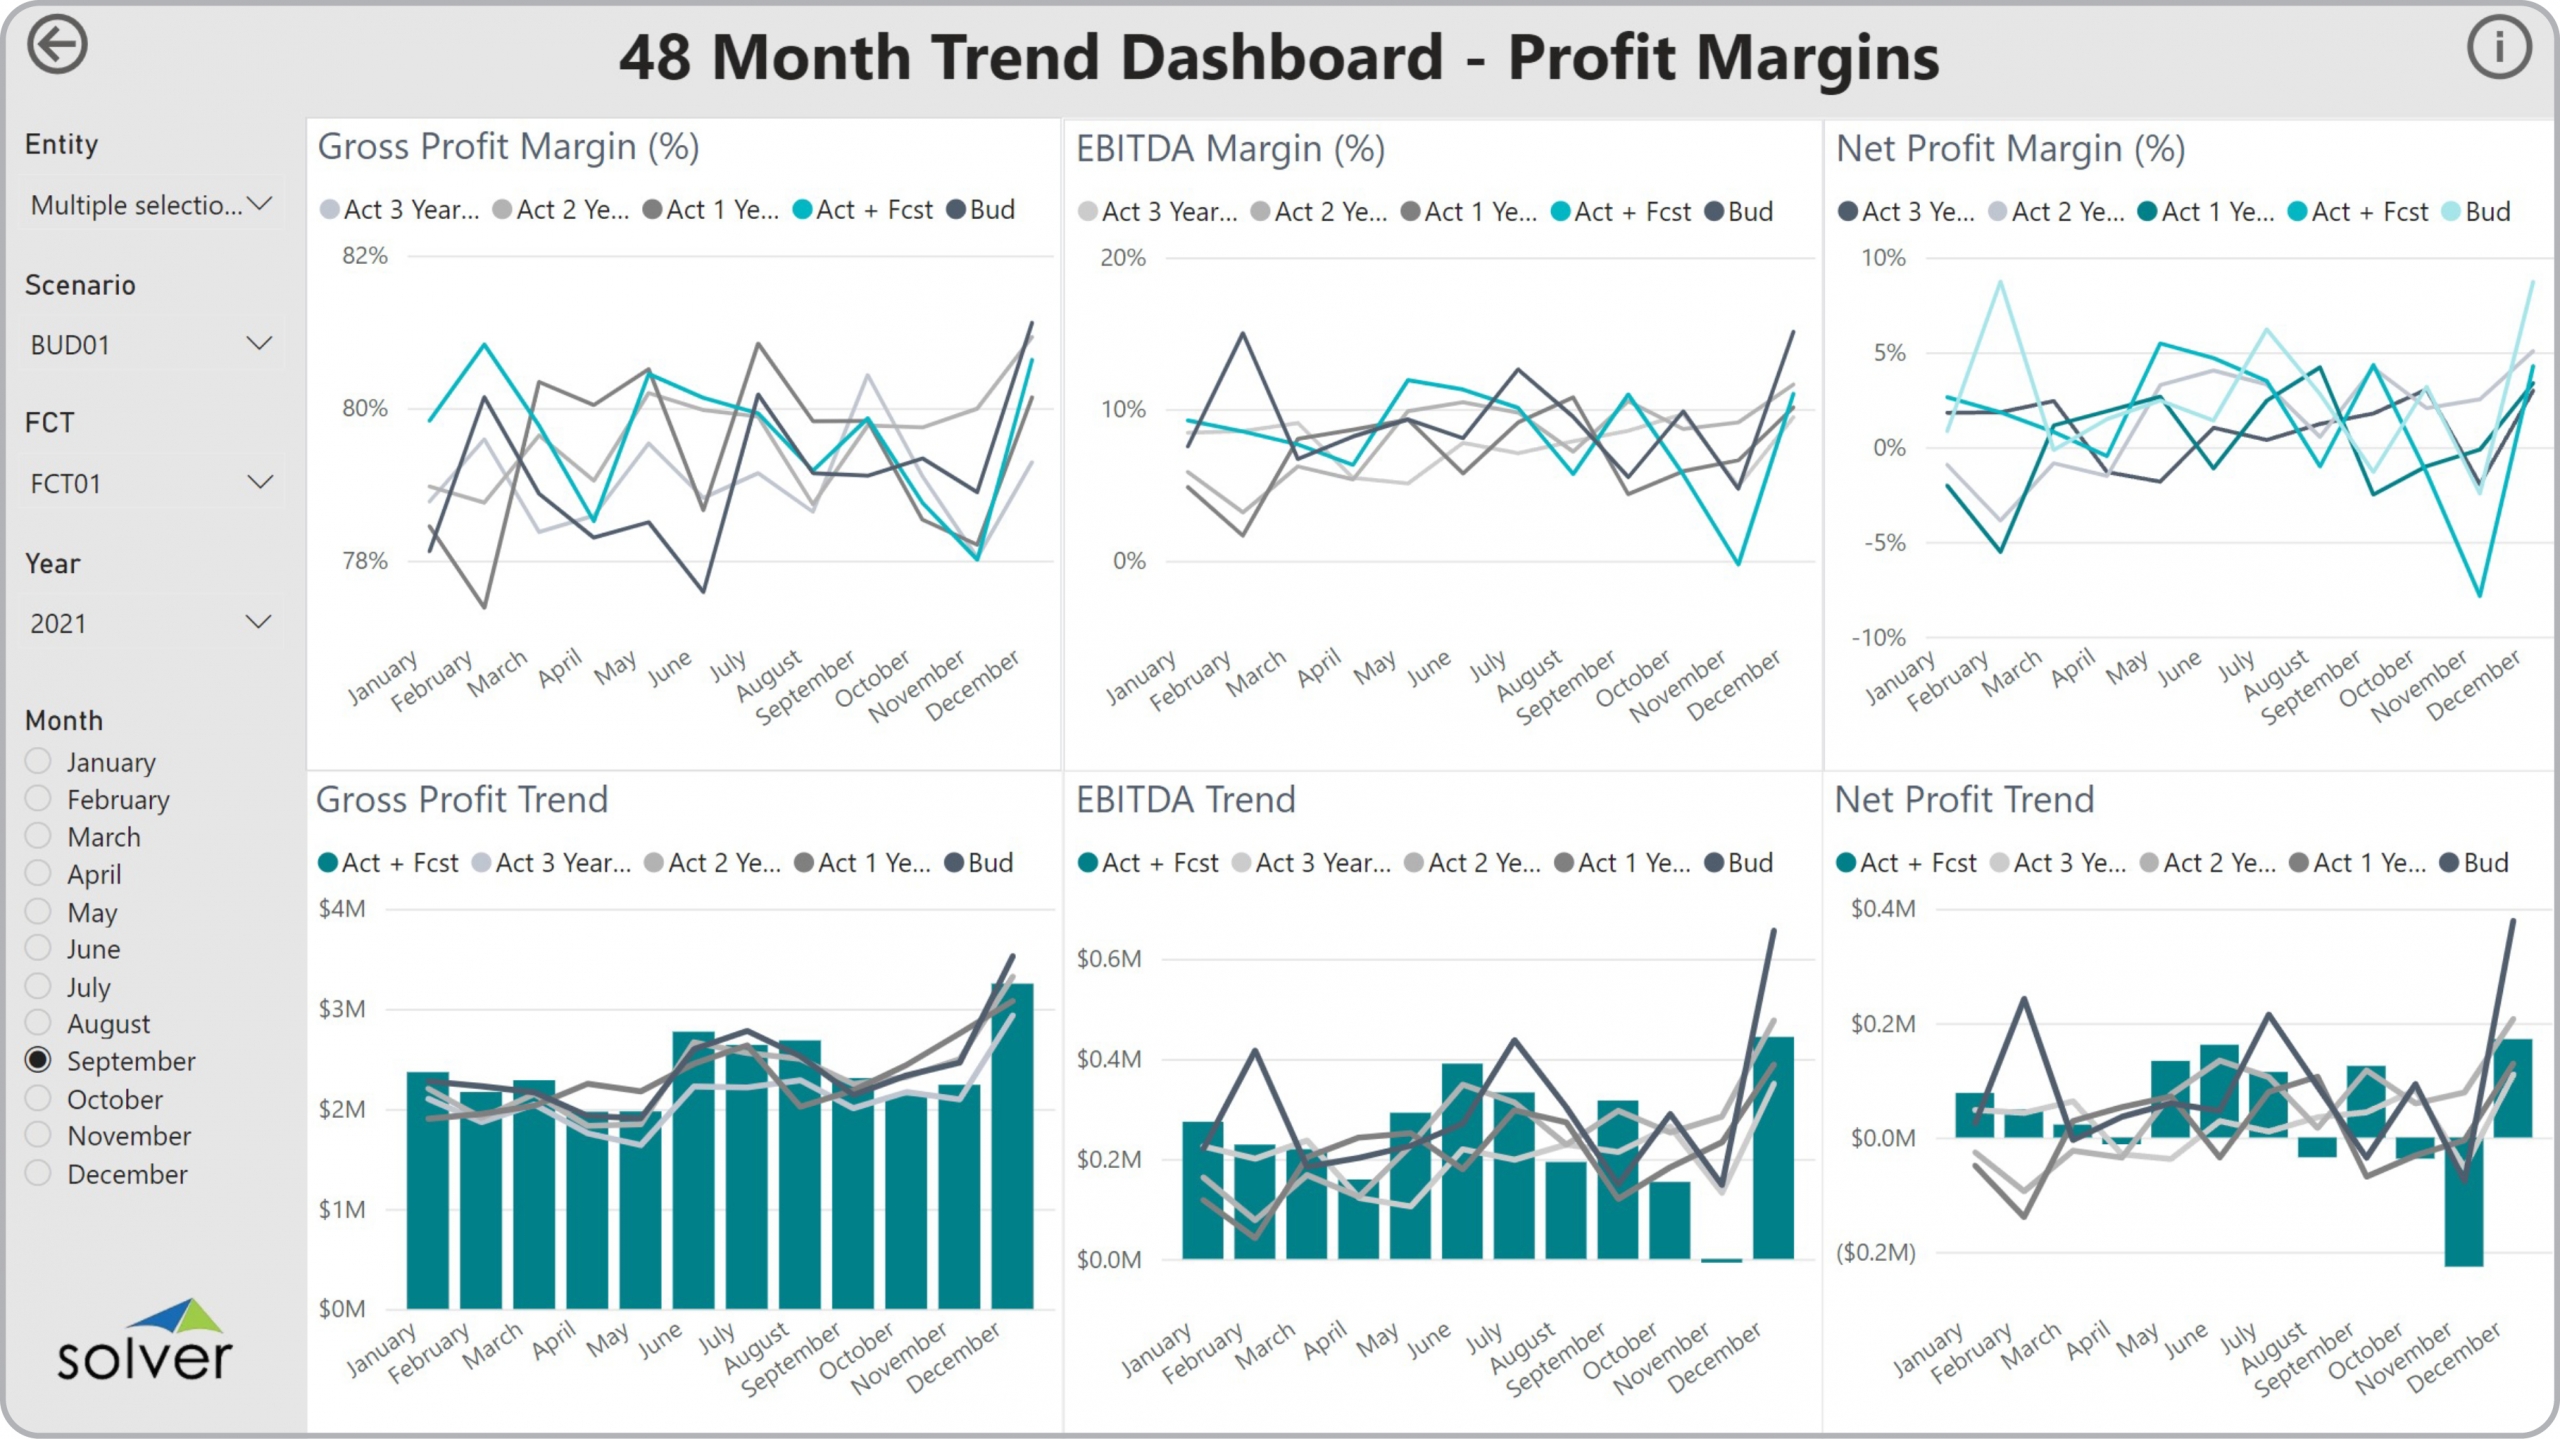
Using 48 Month Profitability Trend Dashboards to Streamline the Monthly Reporting Process
How can Financial Dashboard s Drive Faster and Better Decisions? As CFOs increasingly become key ...
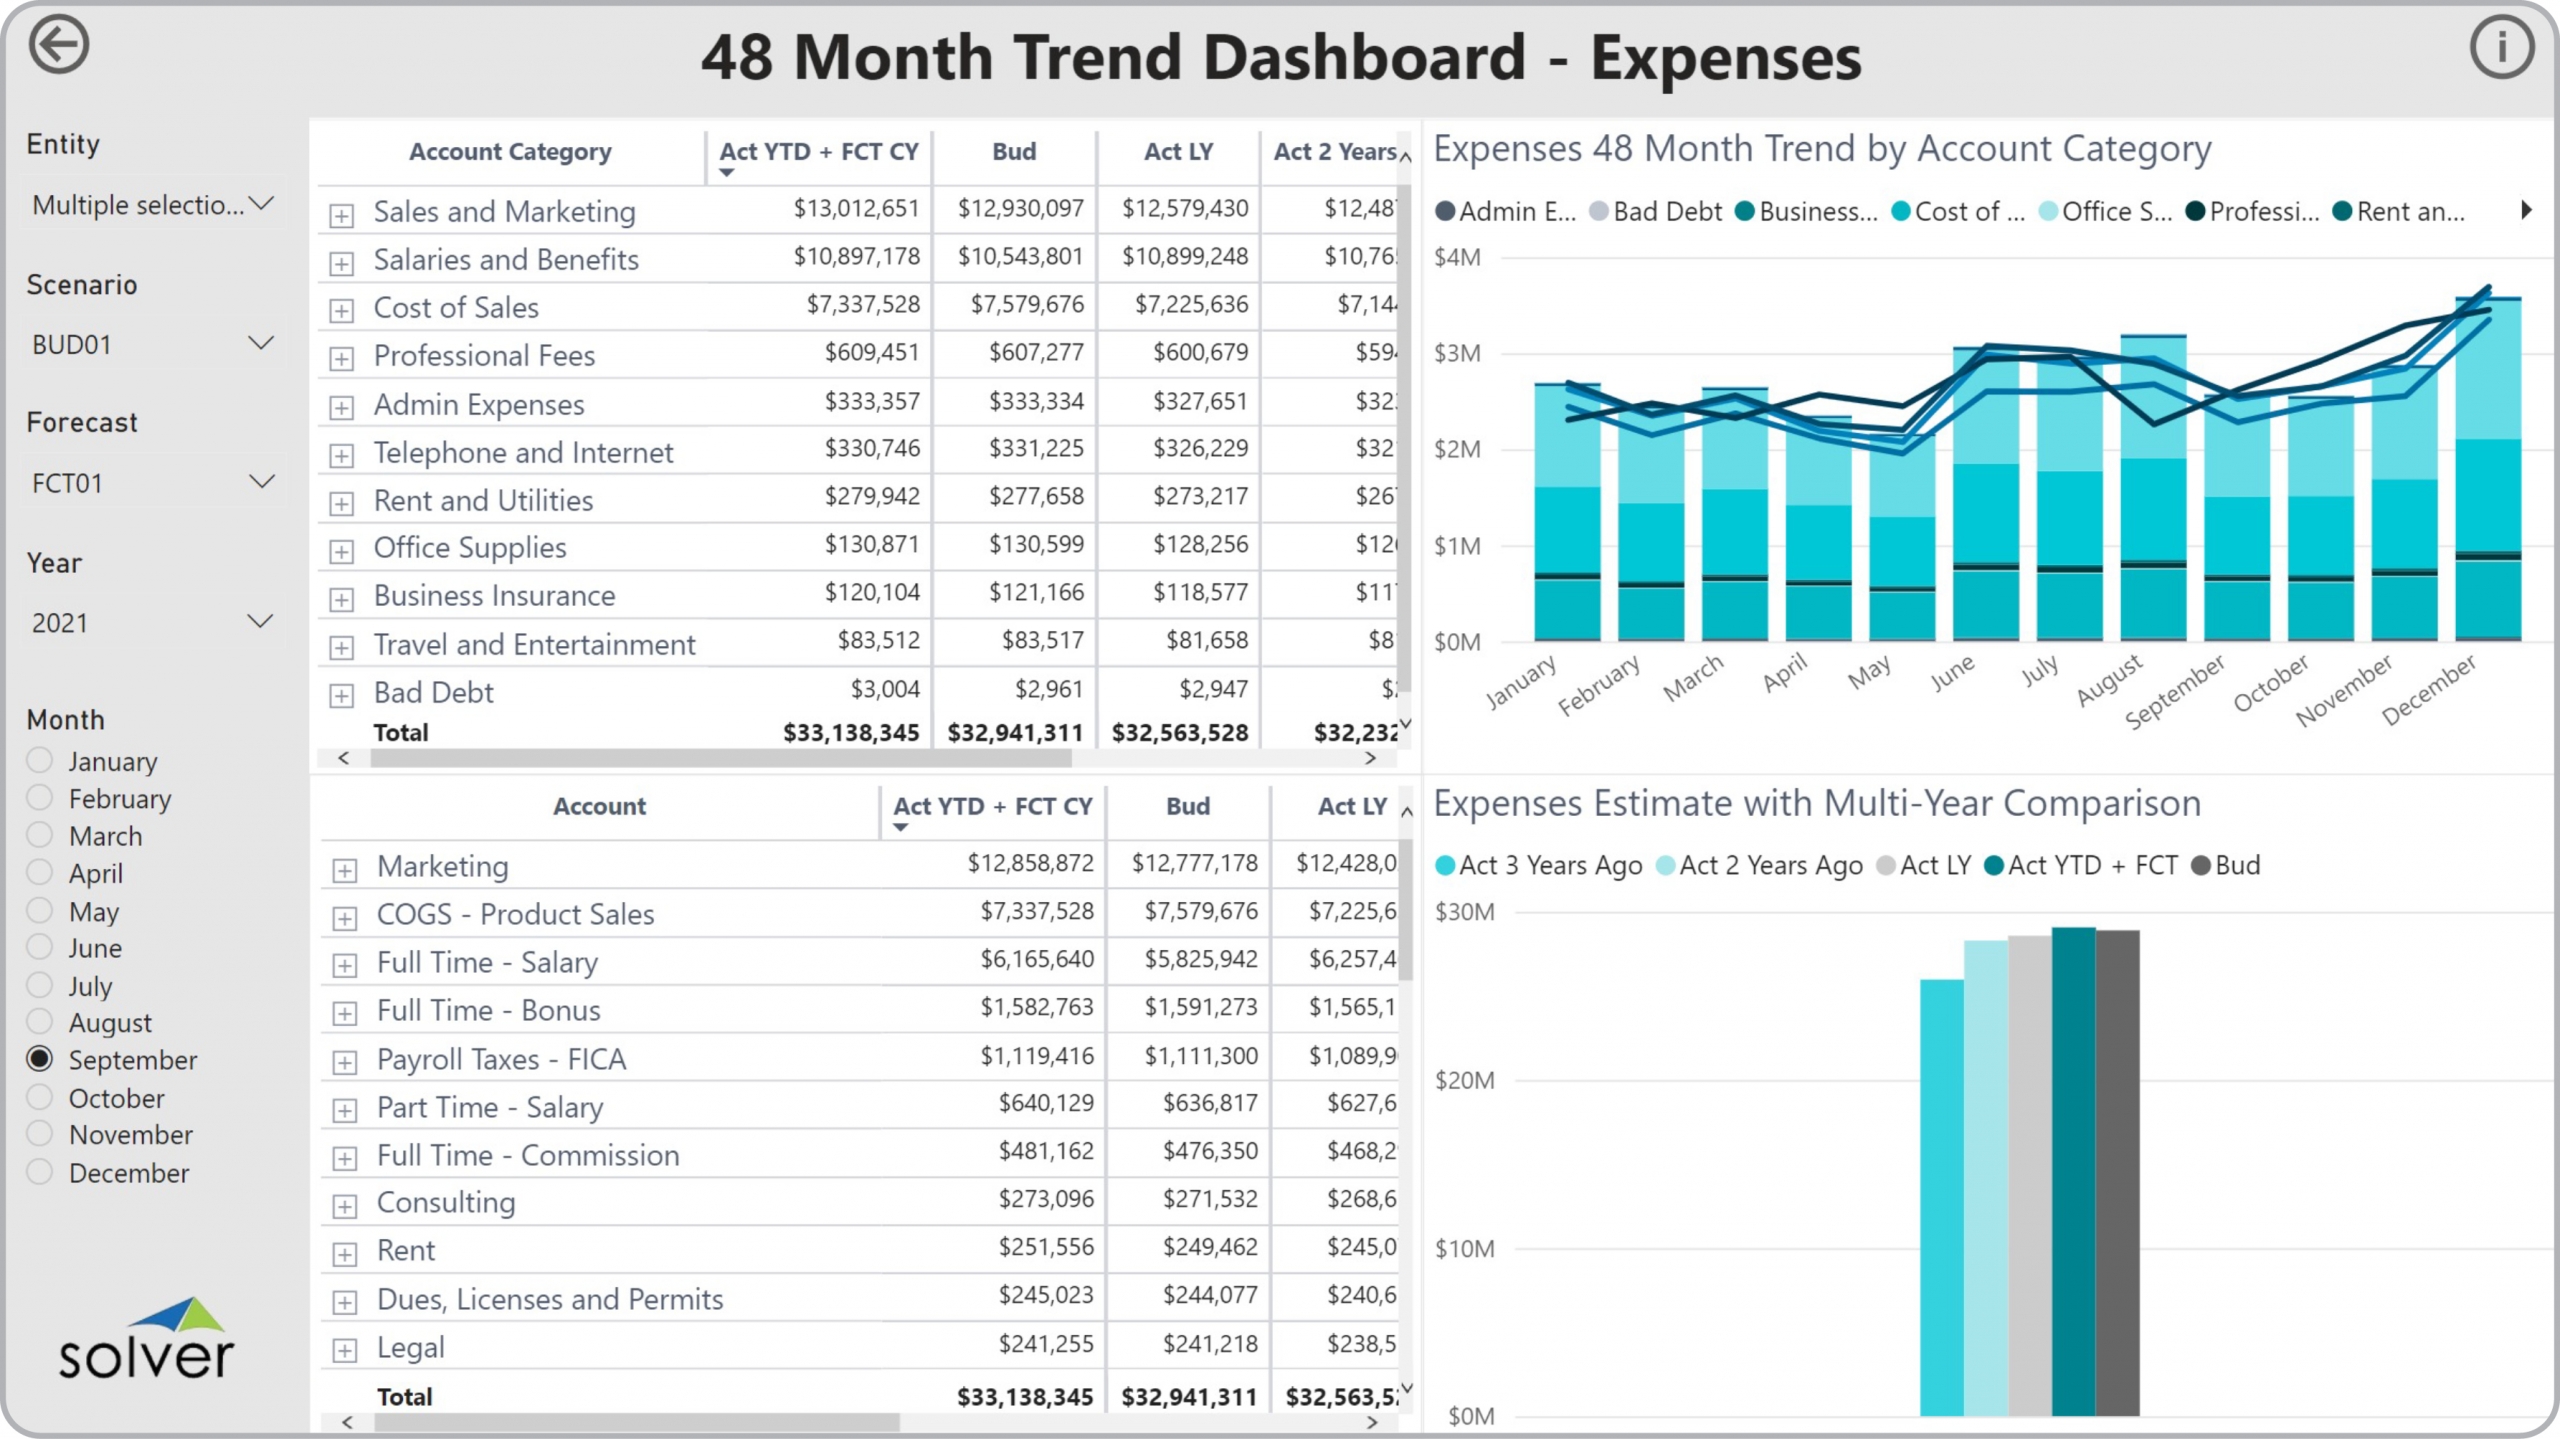
Using 48 Month Expense Trend Dashboards to Streamline the Monthly Reporting Process
How can Financial Dashboard s Drive Faster and Better Decisions? As CFOs increasingly become key ...
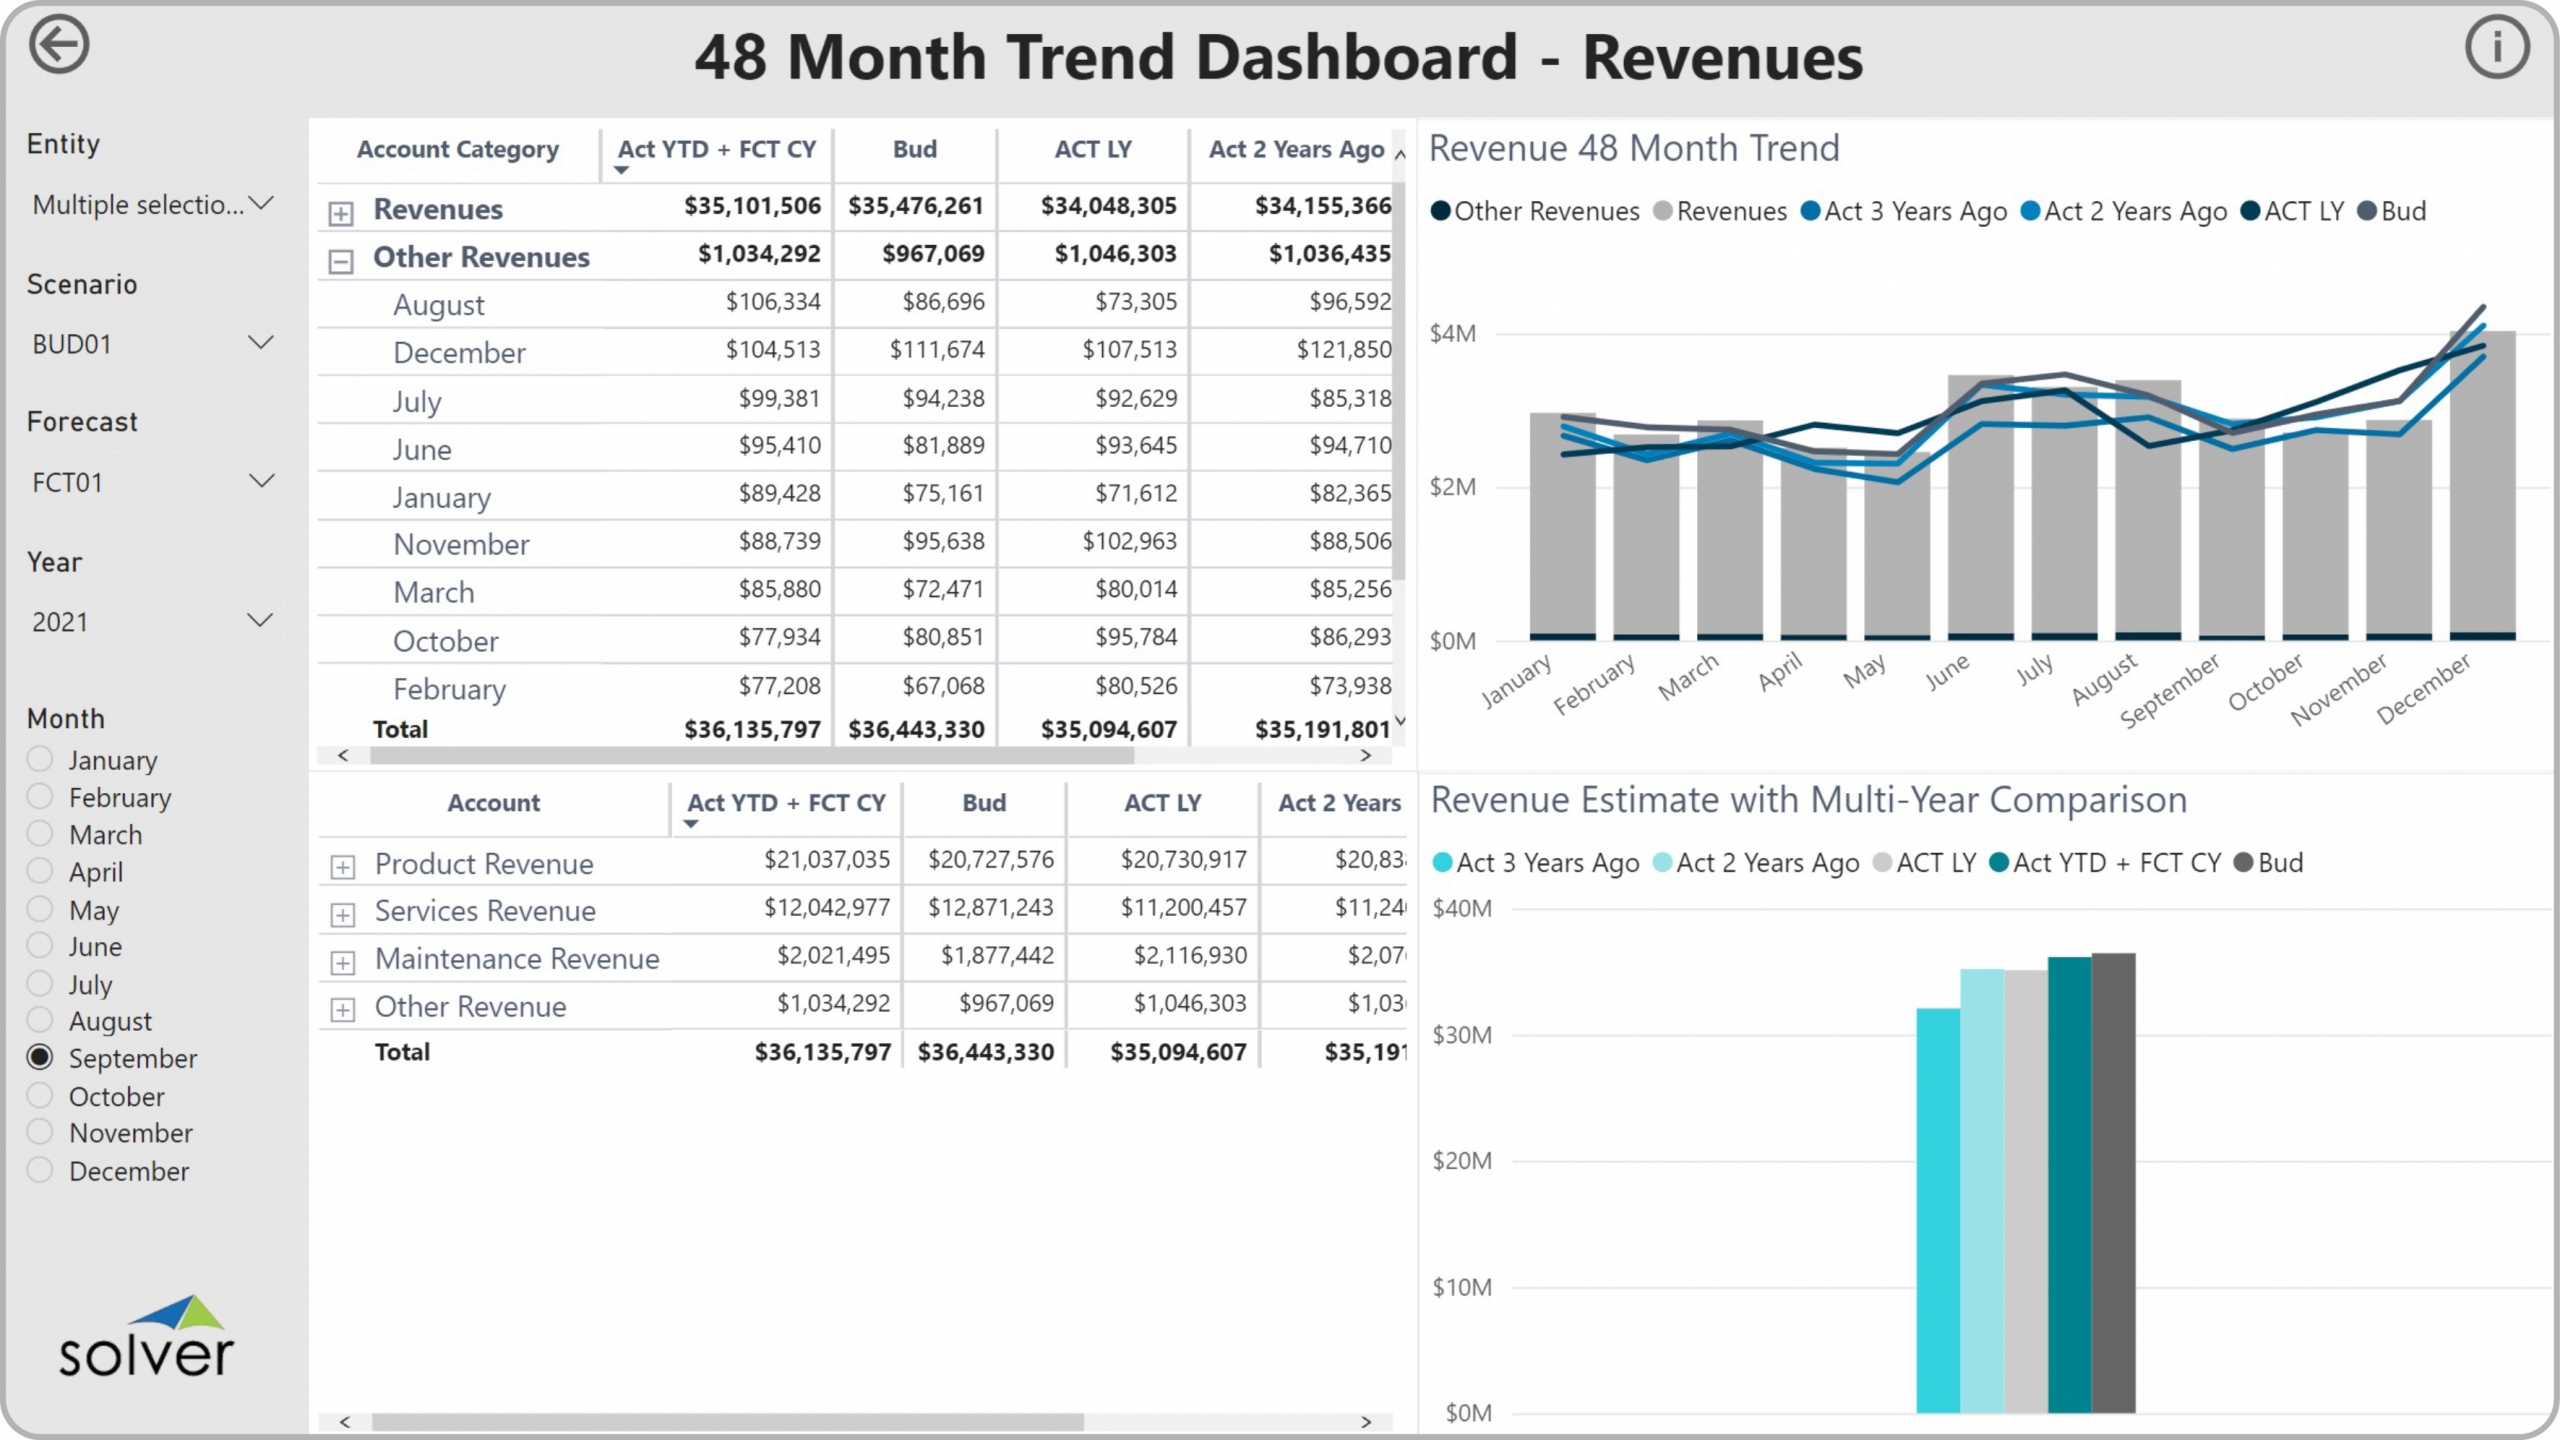
Using 48 Month Revenue Trend Dashboards to Streamline the Monthly Reporting Process
How can Financial Dashboard s Drive Faster and Better Decisions? As CFOs increasingly become key ...
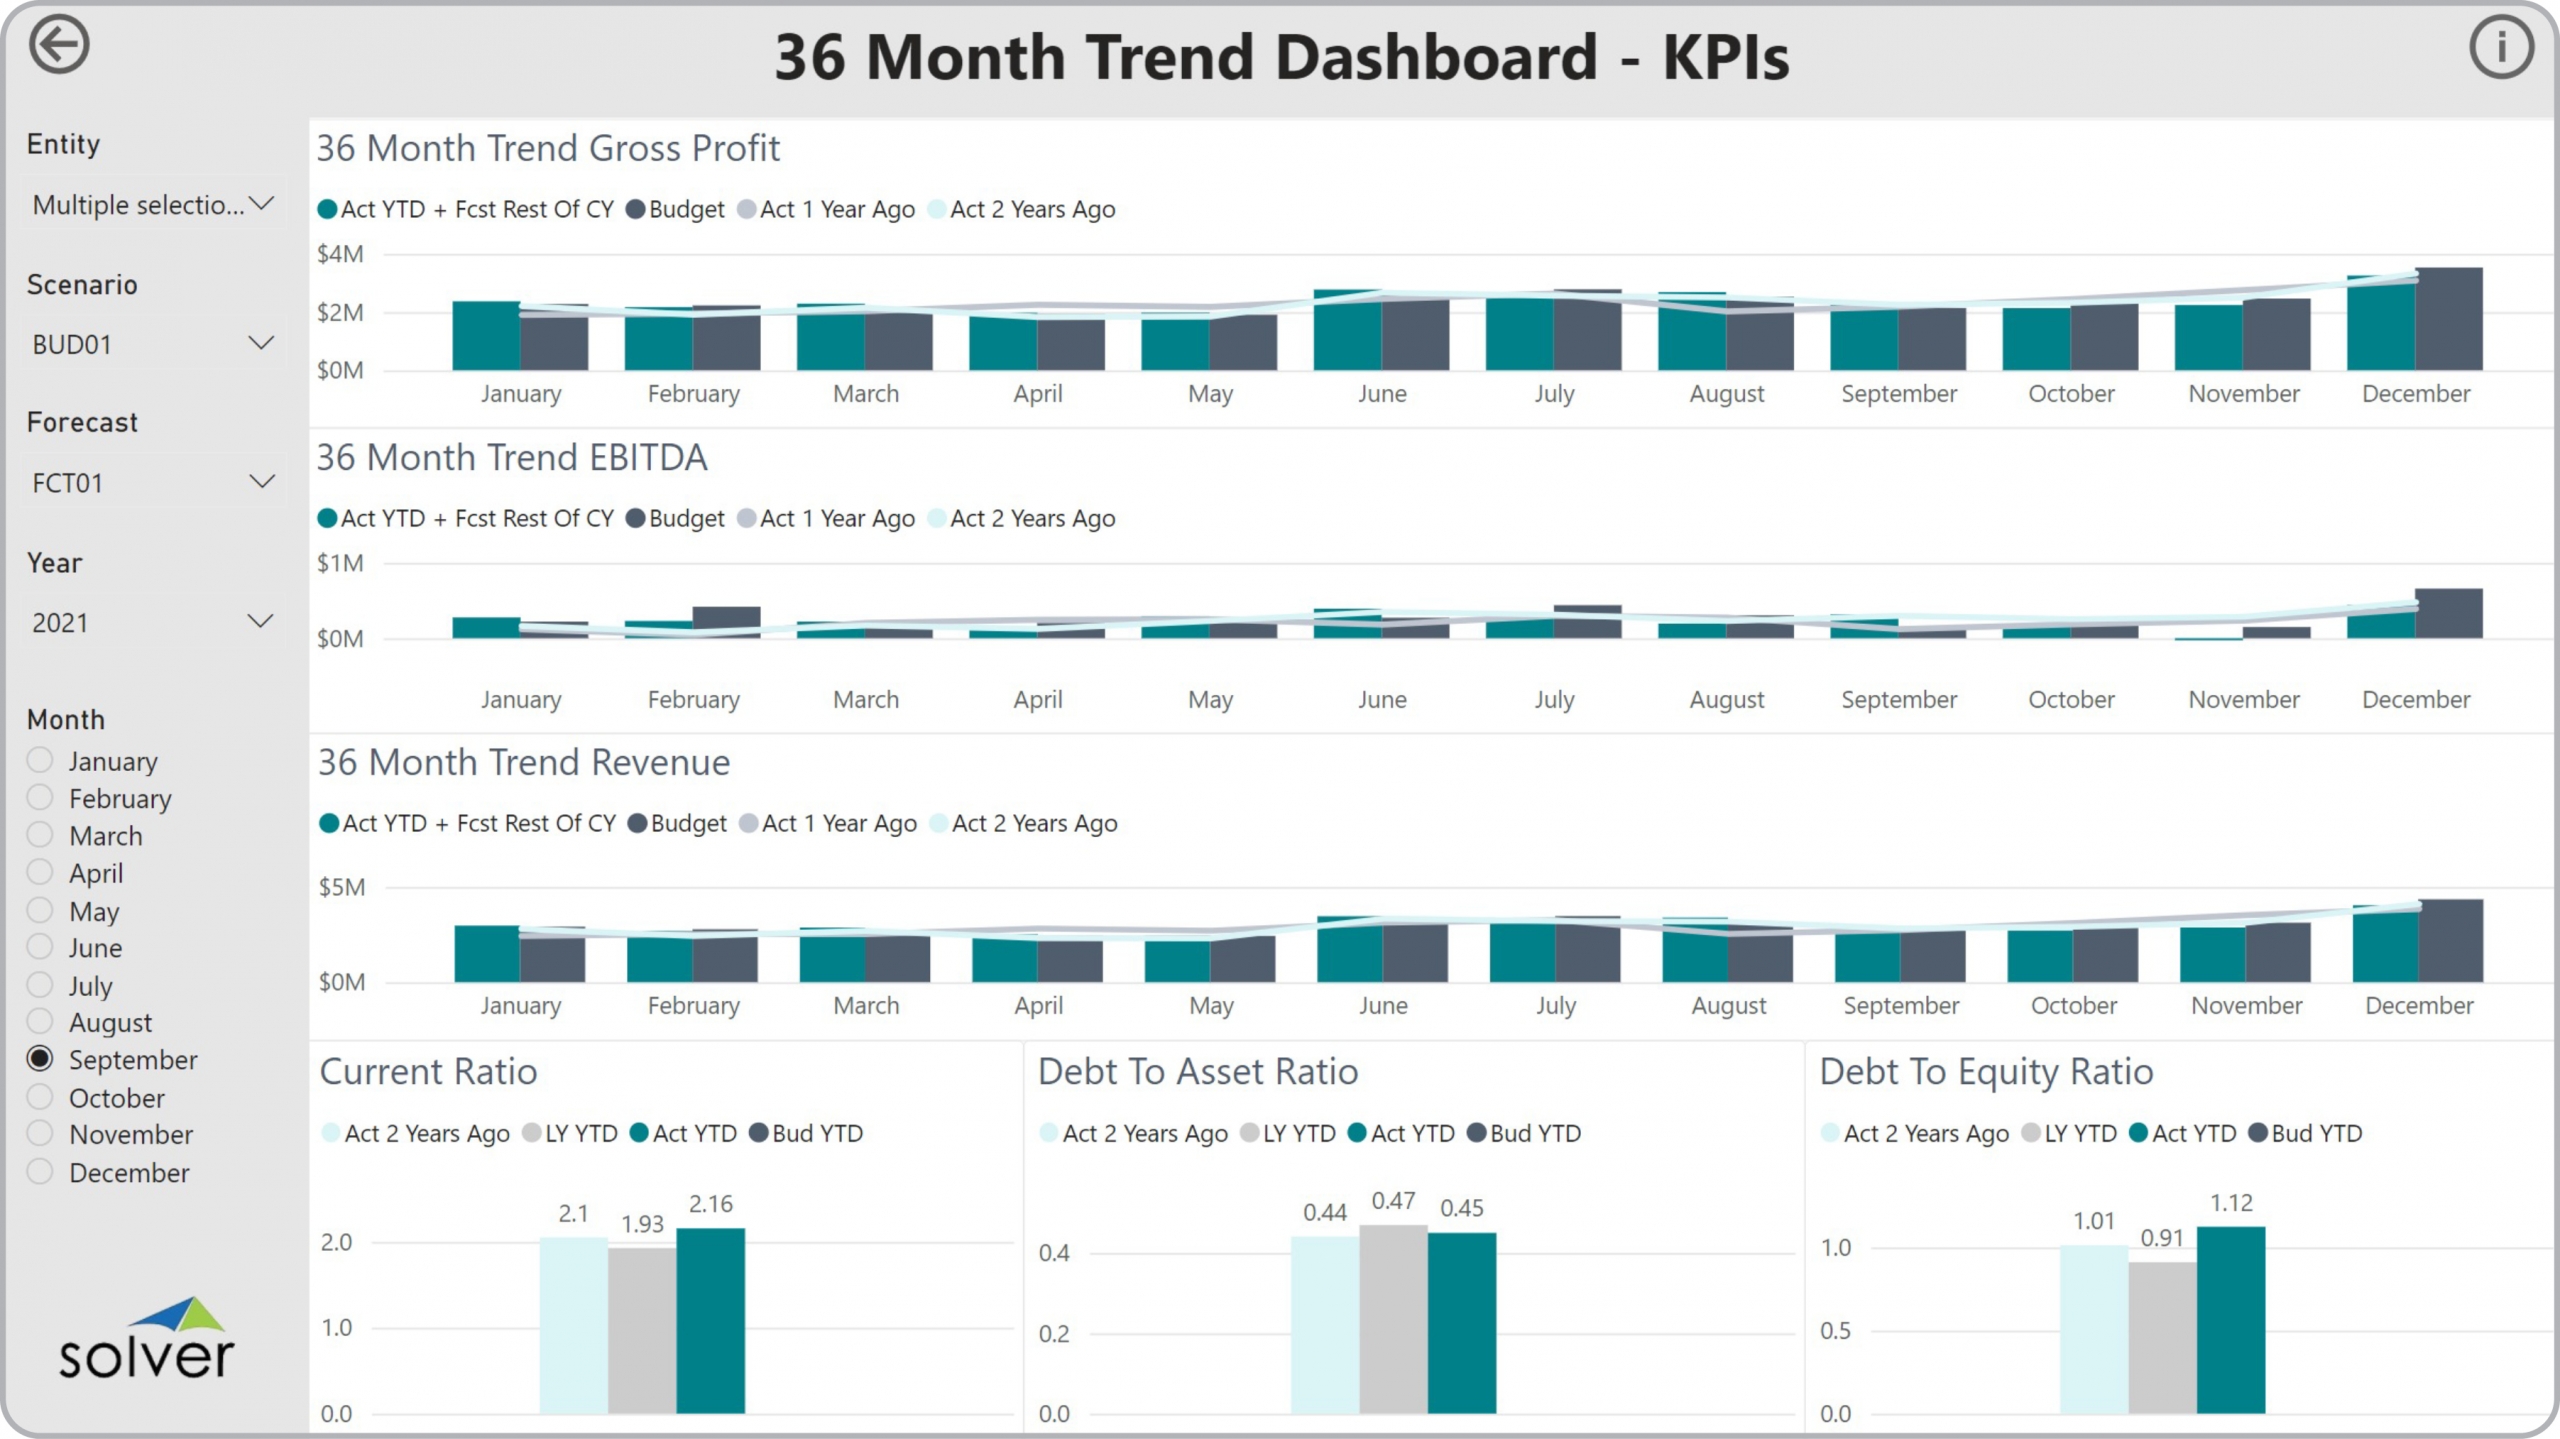
Using 36 Month KPI Trend Dashboards to Streamline the Monthly Reporting Process
How can Financial Dashboard s Drive Faster and Better Decisions? As CFOs increasingly become key ...
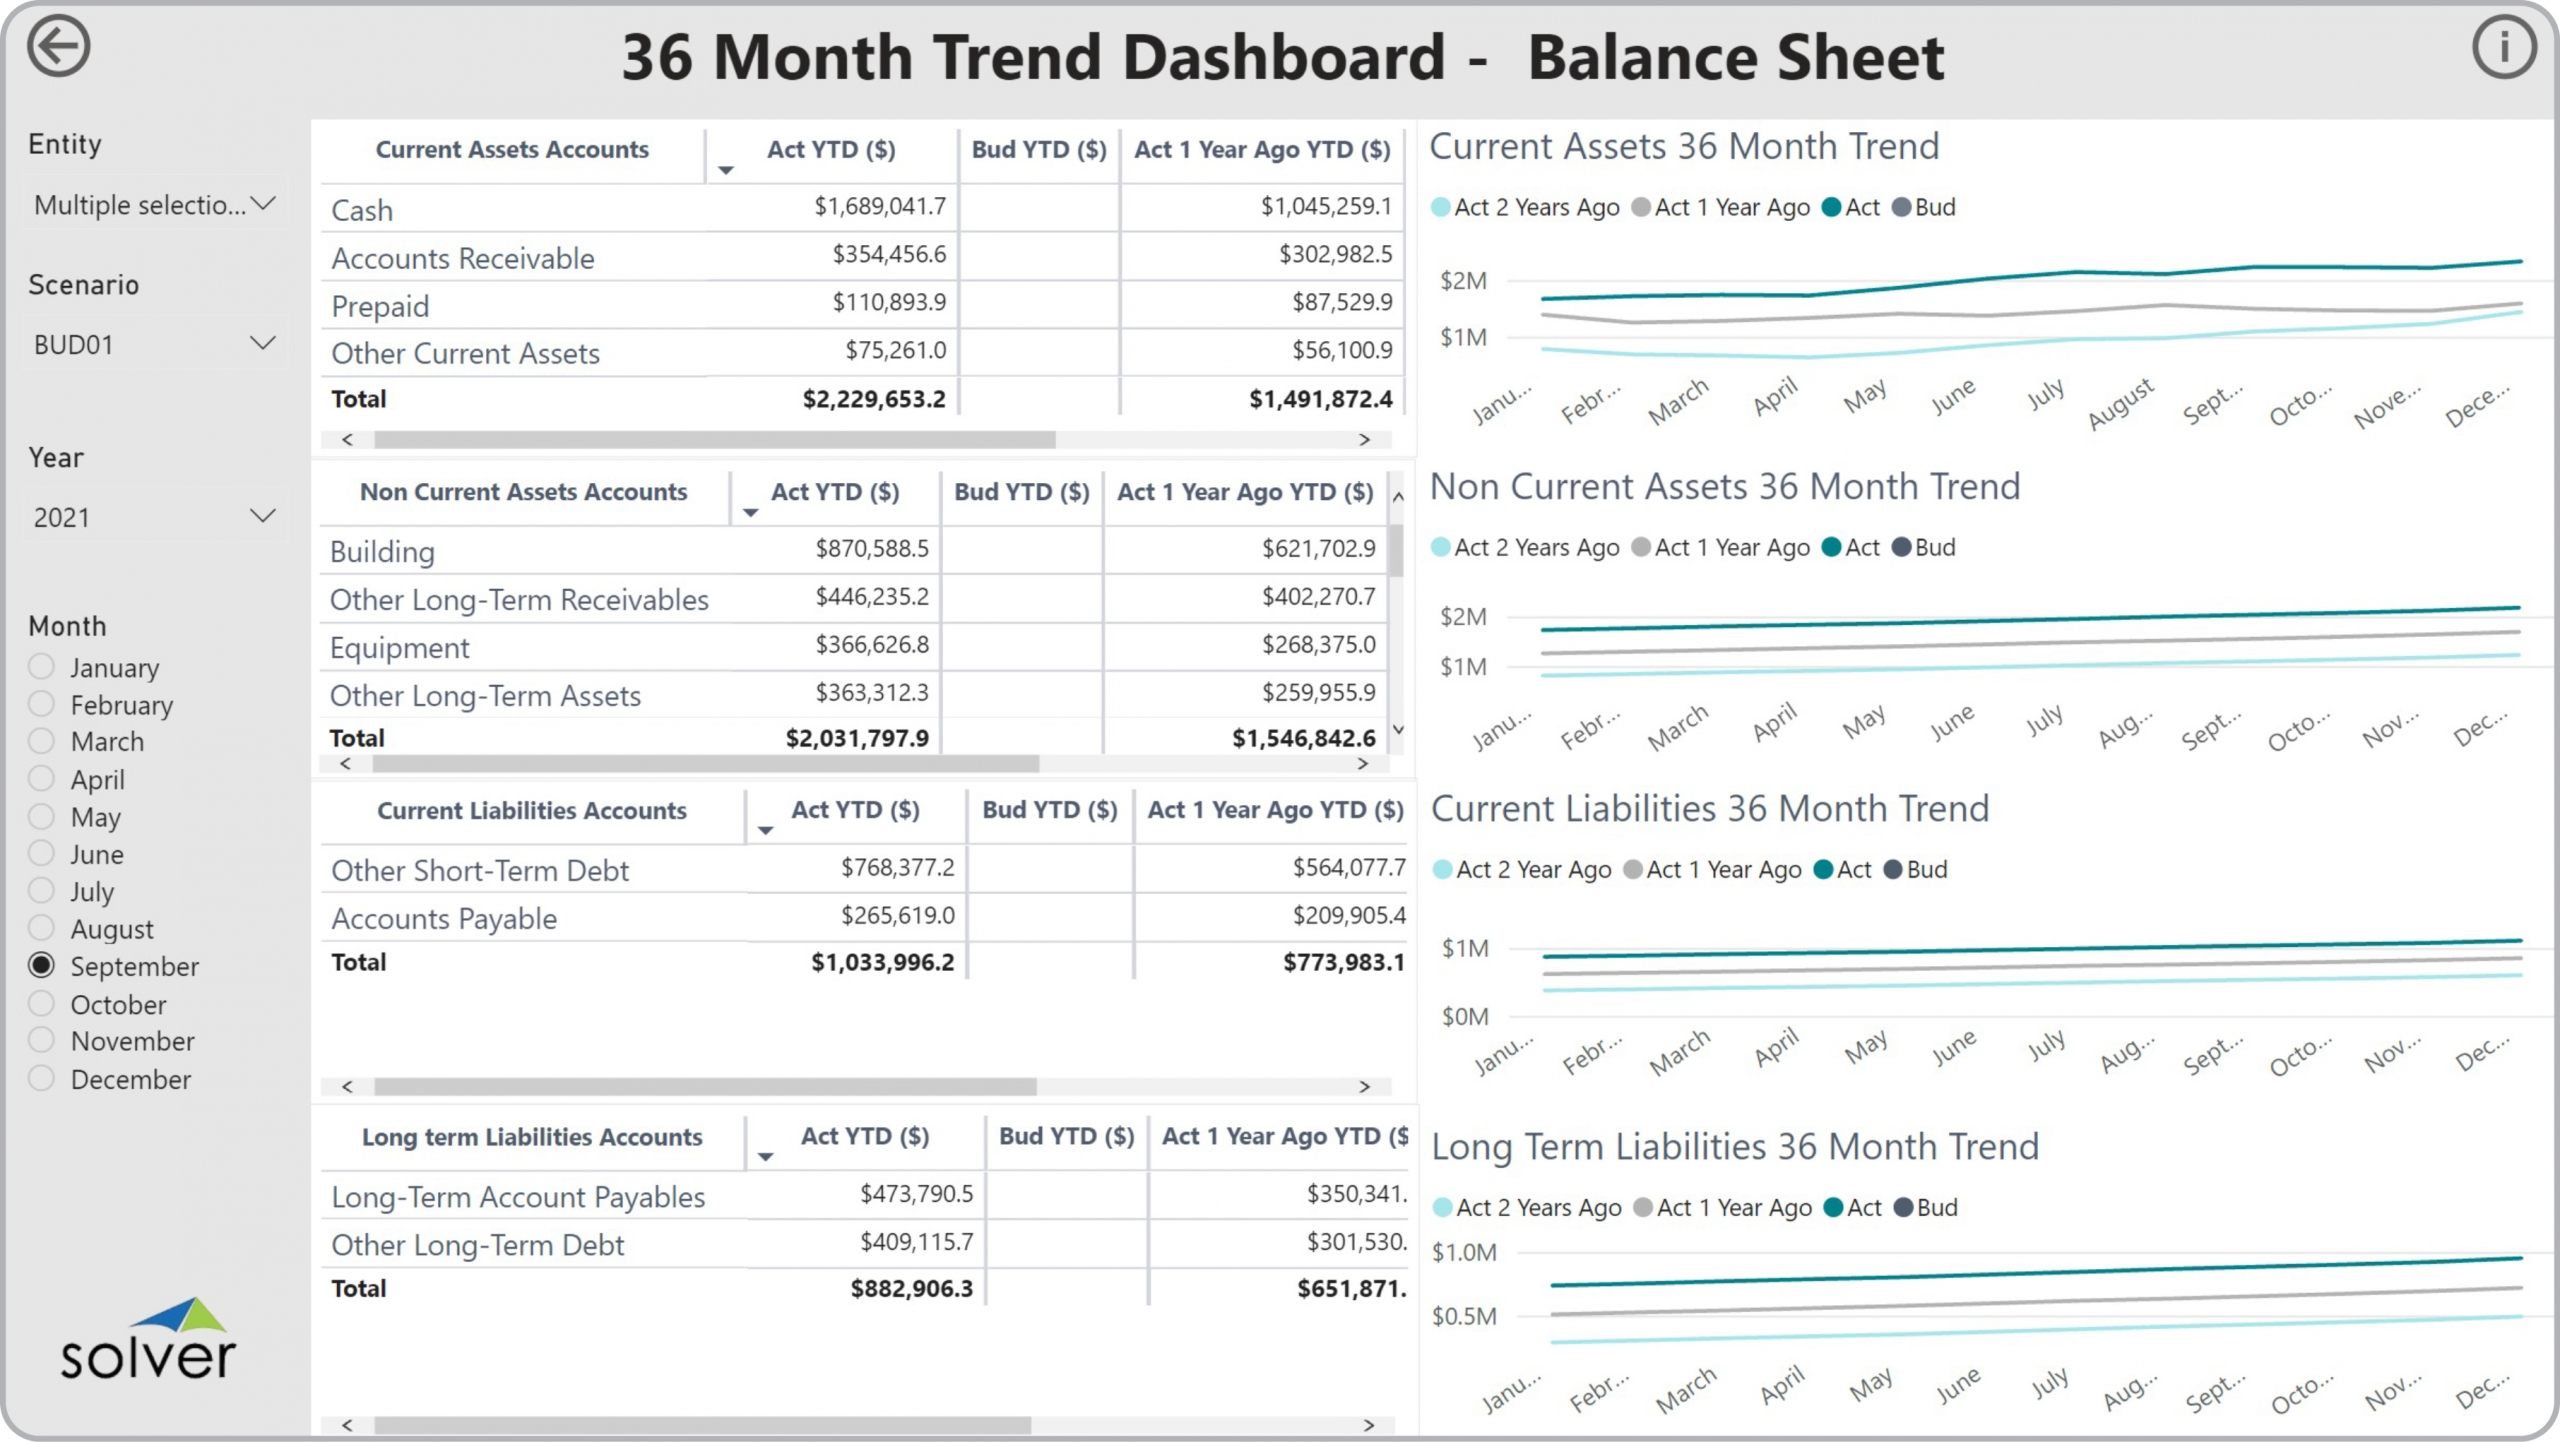
Using 36 Month Balance Sheet Trend Dashboards to Streamline the Monthly Reporting Process
How can Financial Dashboard s Drive Faster and Better Decisions? As CFOs increasingly focus on ...
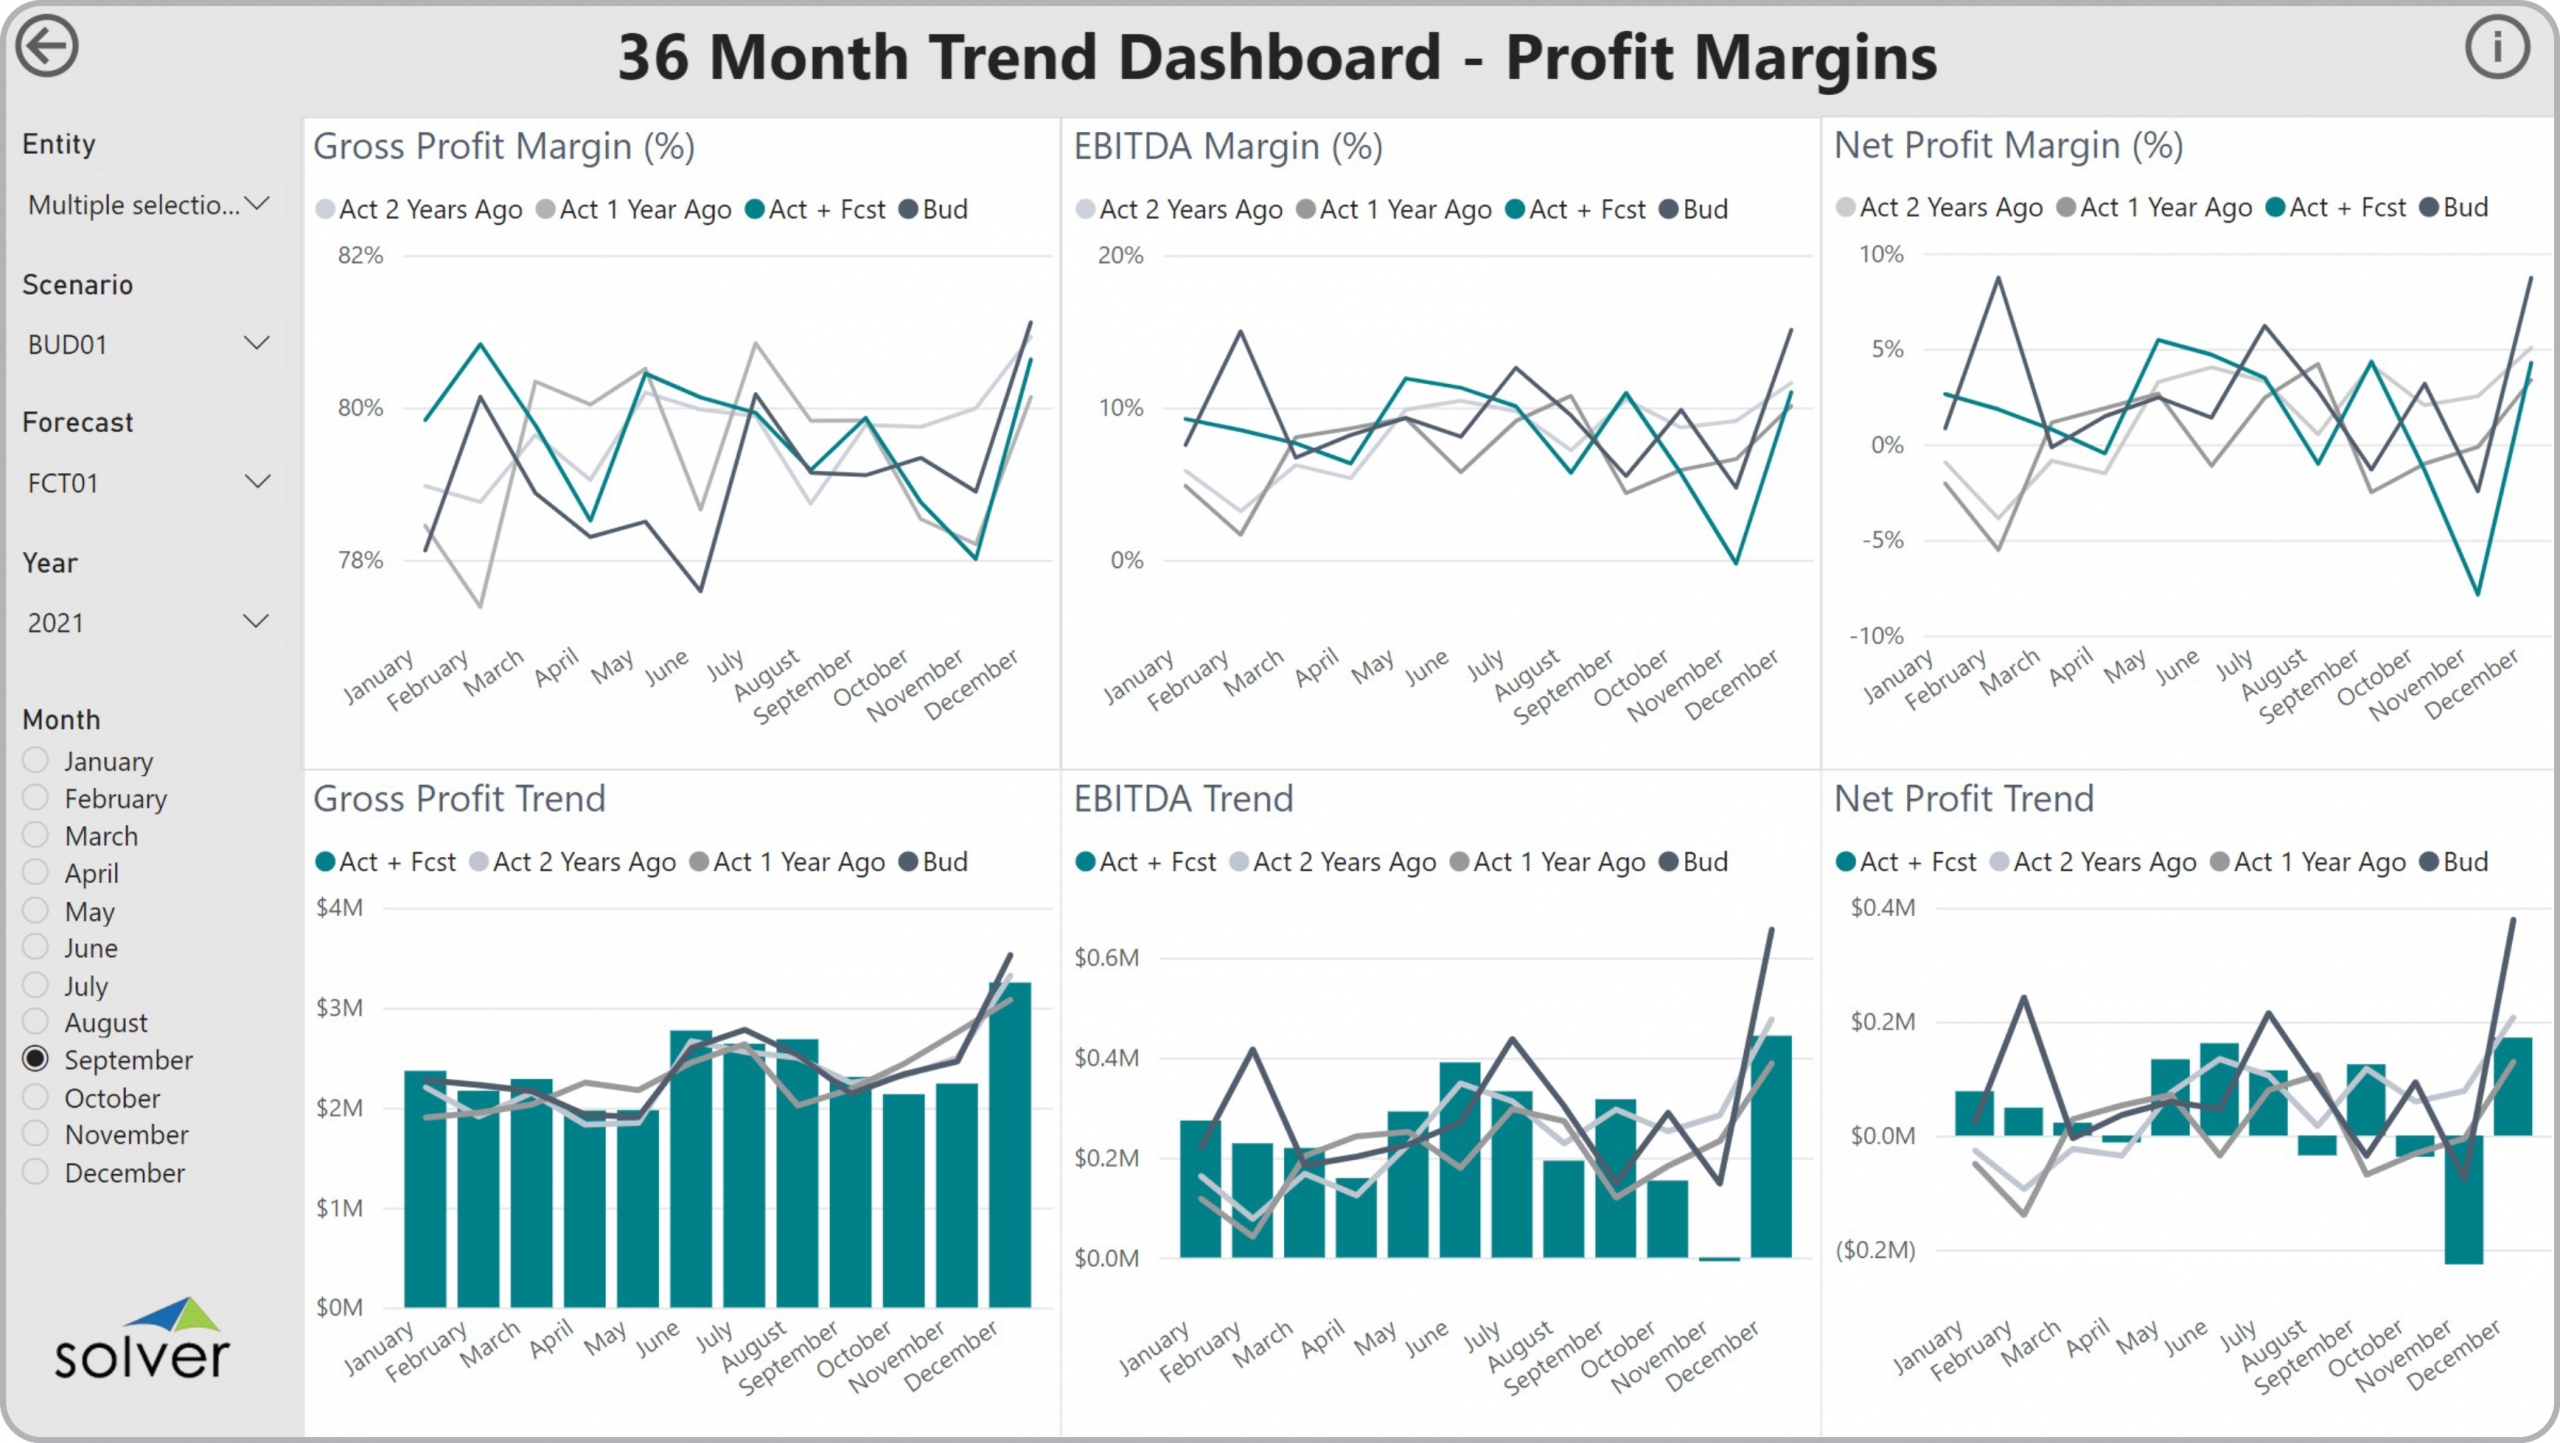
Using 36 Month Profitability Trend Dashboards to Streamline the Monthly Reporting Process
How can Financial Dashboard s Drive Faster and Better Decisions? As CFOs increasingly become key ...
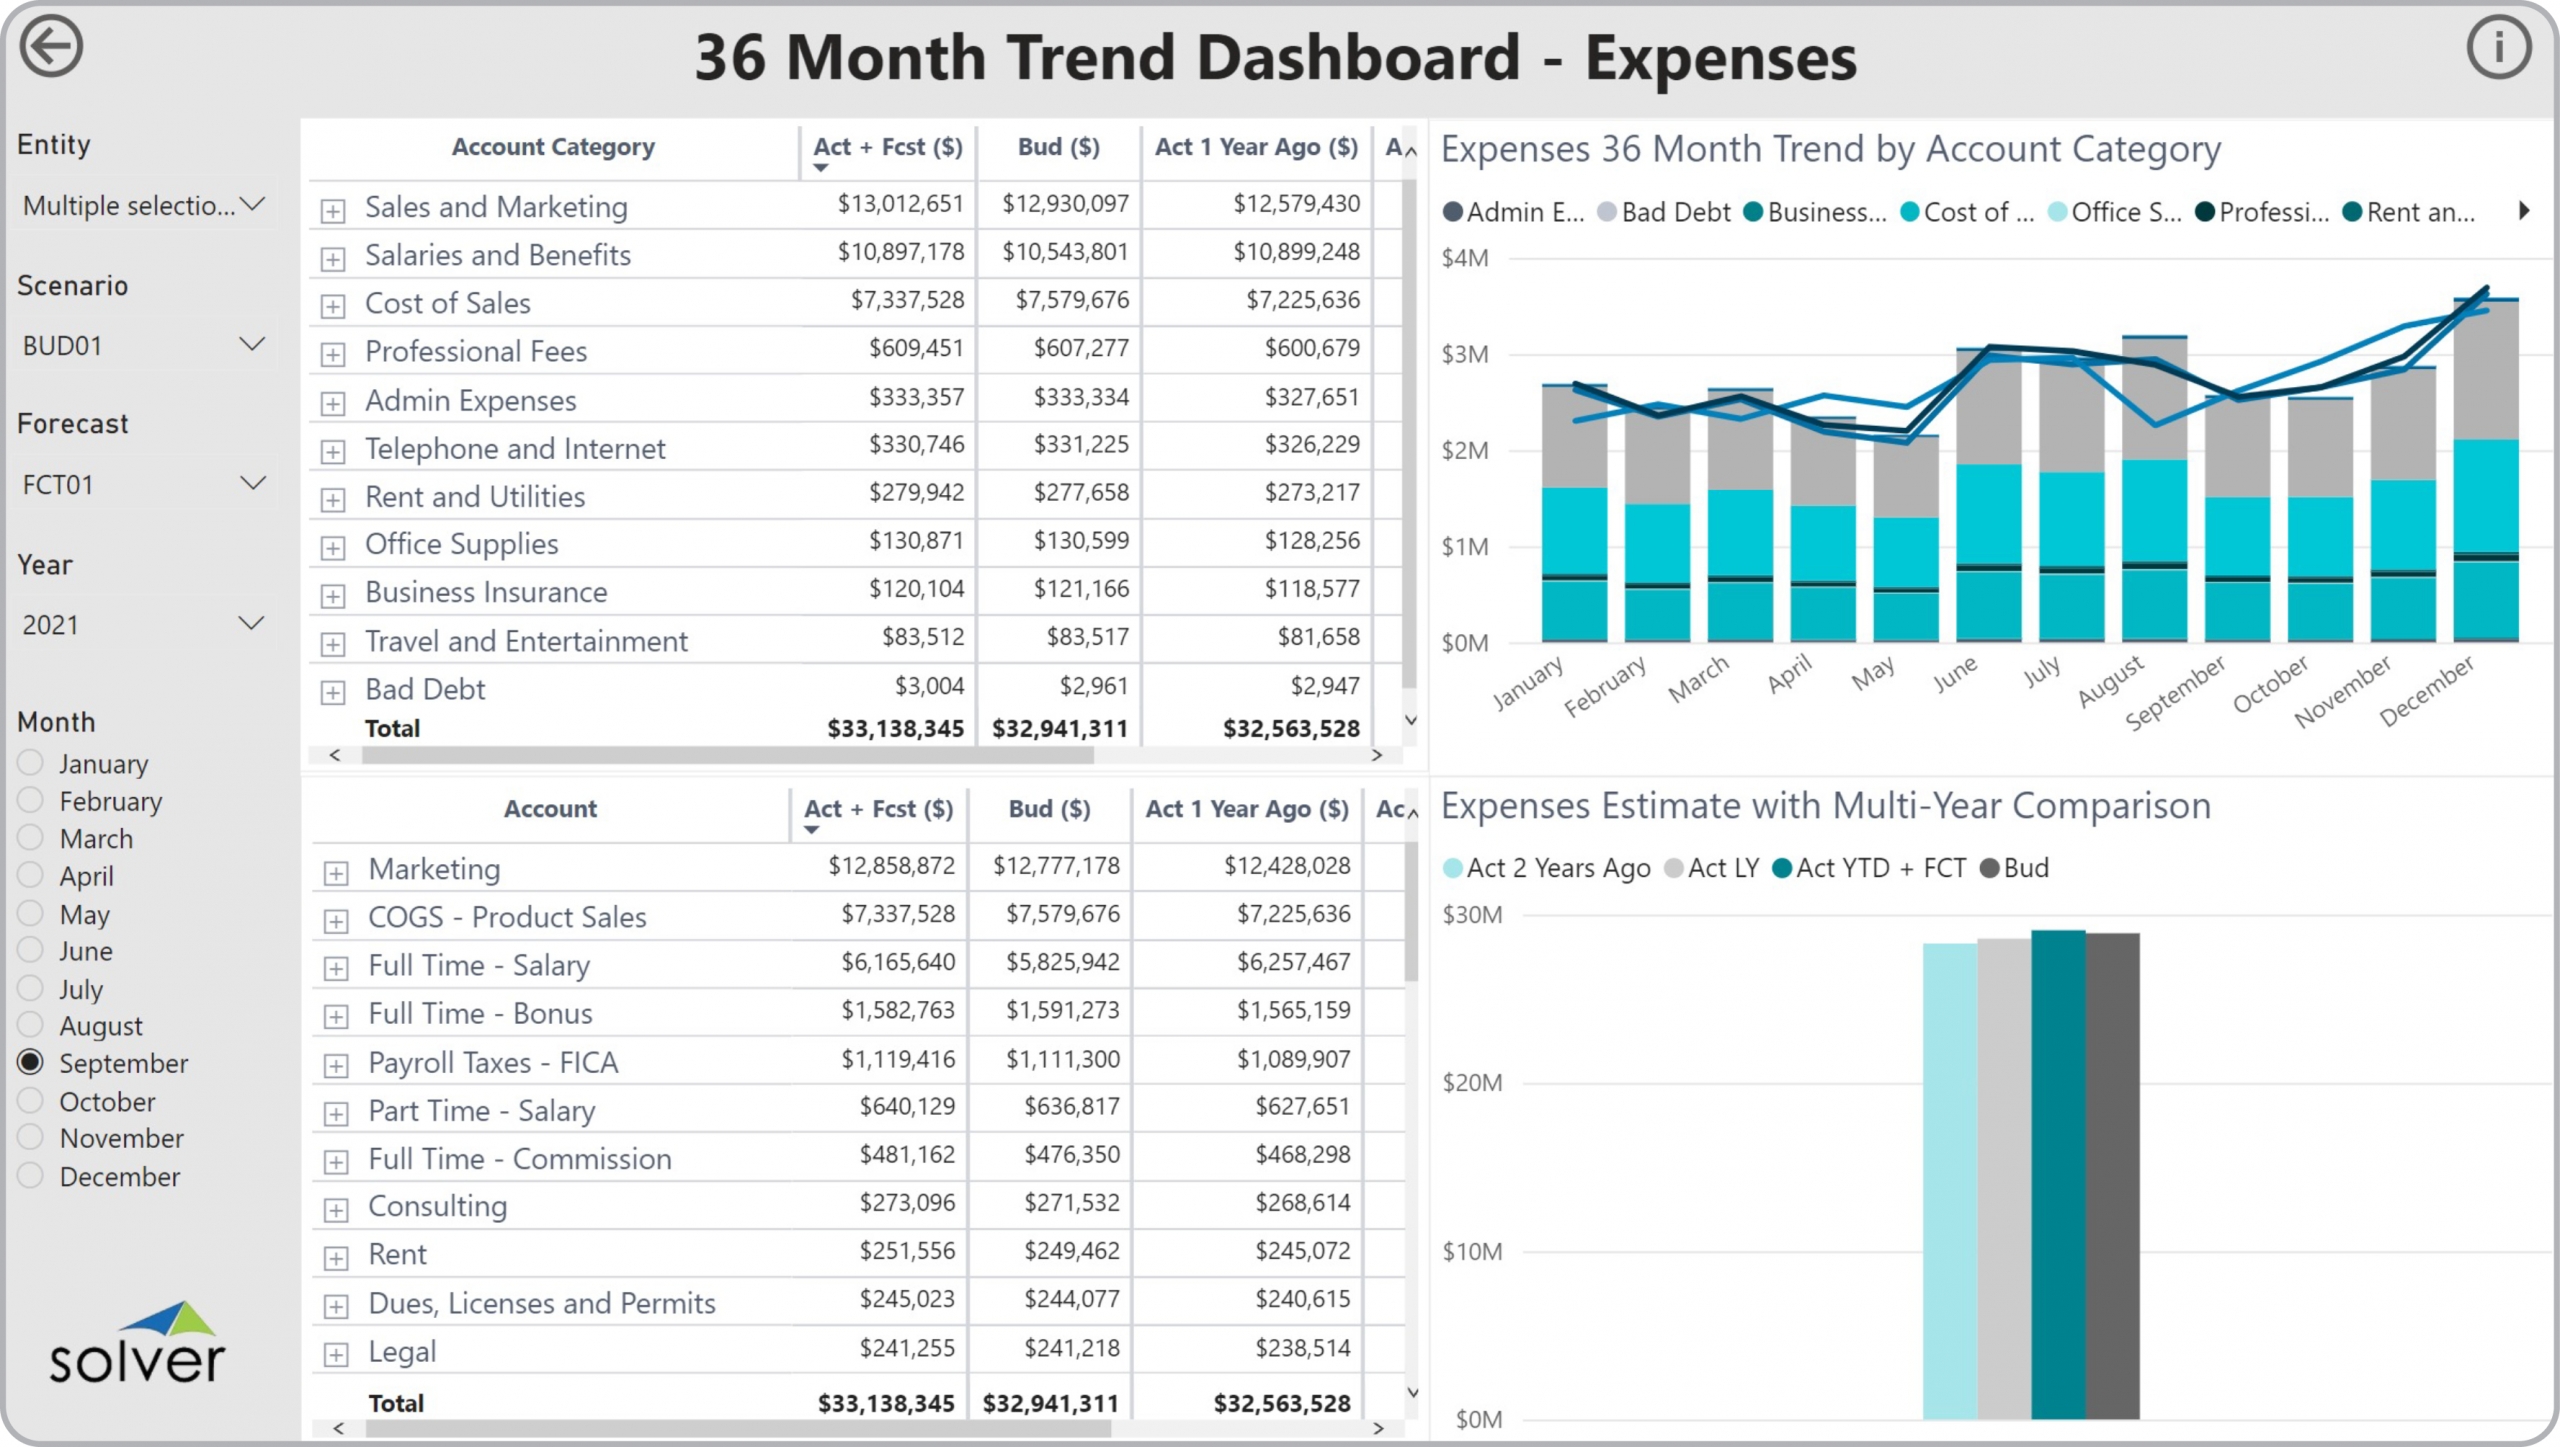
Using 36 Month Expense Trend Dashboards to Streamline the Monthly Reporting Process
How can Financial Dashboard s Drive Faster and Better Decisions? As CFOs increasingly become ...
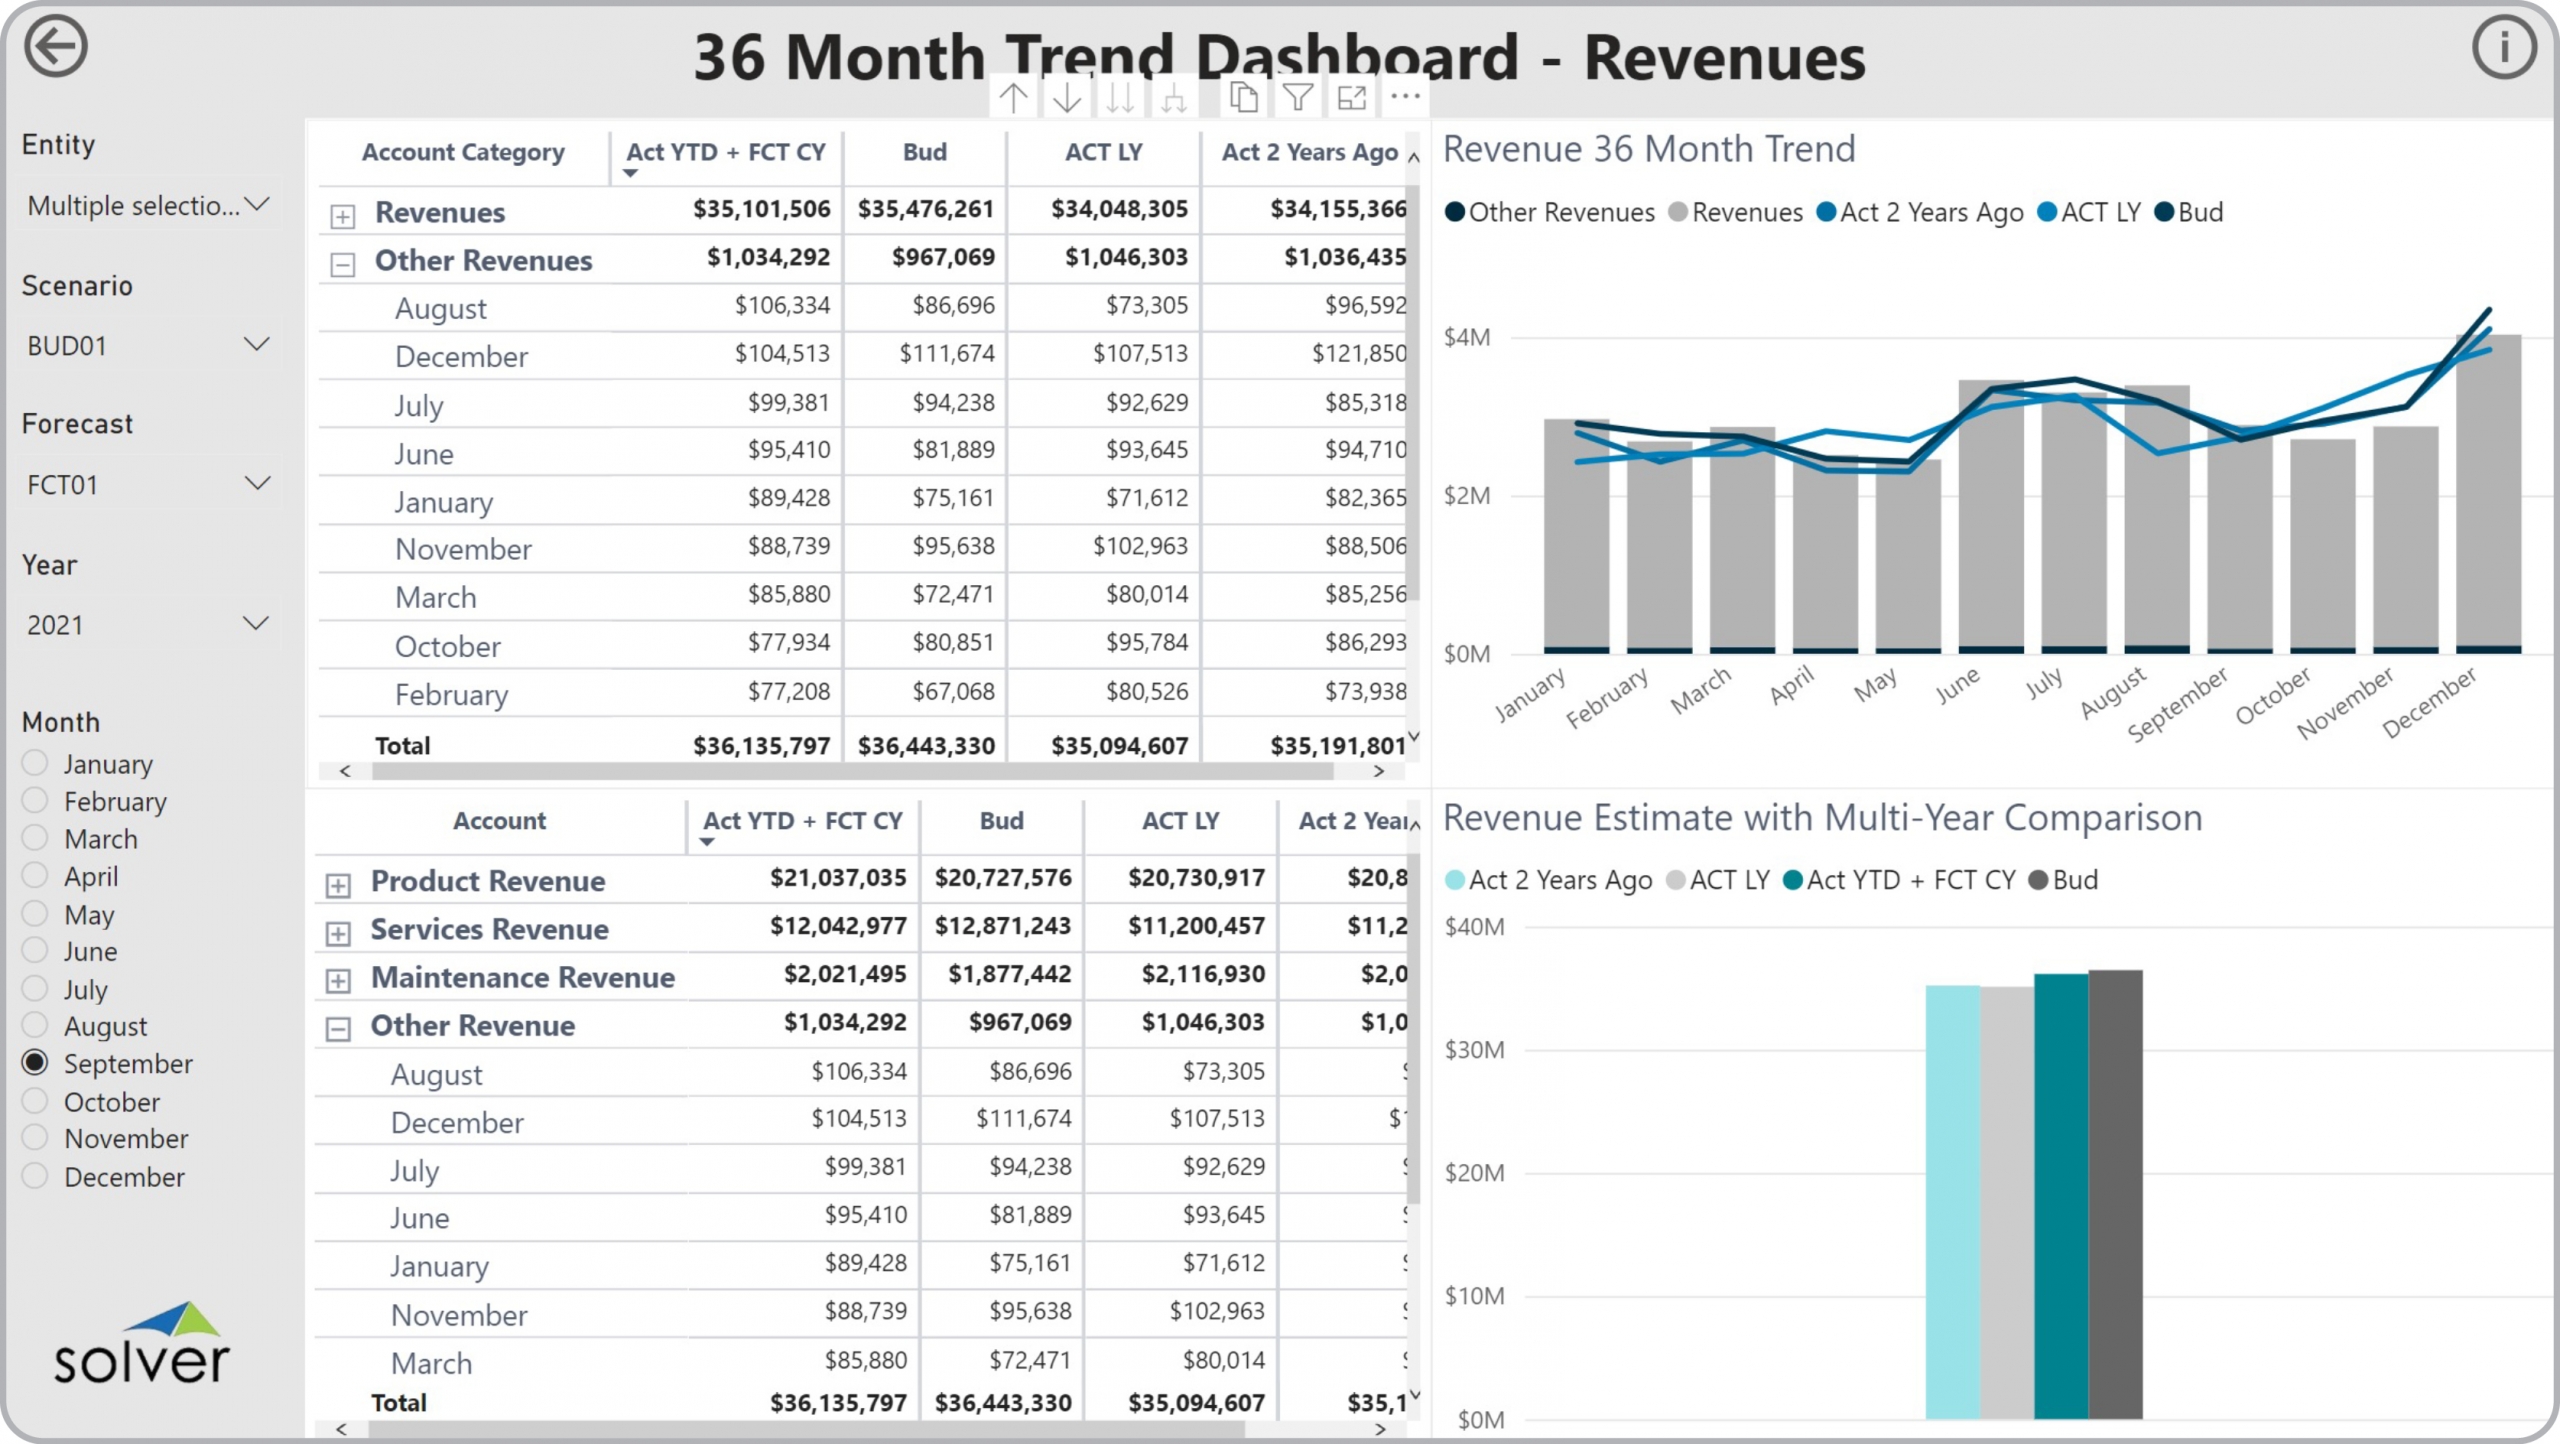
Using 36 Month Revenue Trend Dashboards to Streamline the Monthly Reporting Process
How can Financial Dashboard s Drive Faster and Better Decisions? As CFOs increasingly become key ...
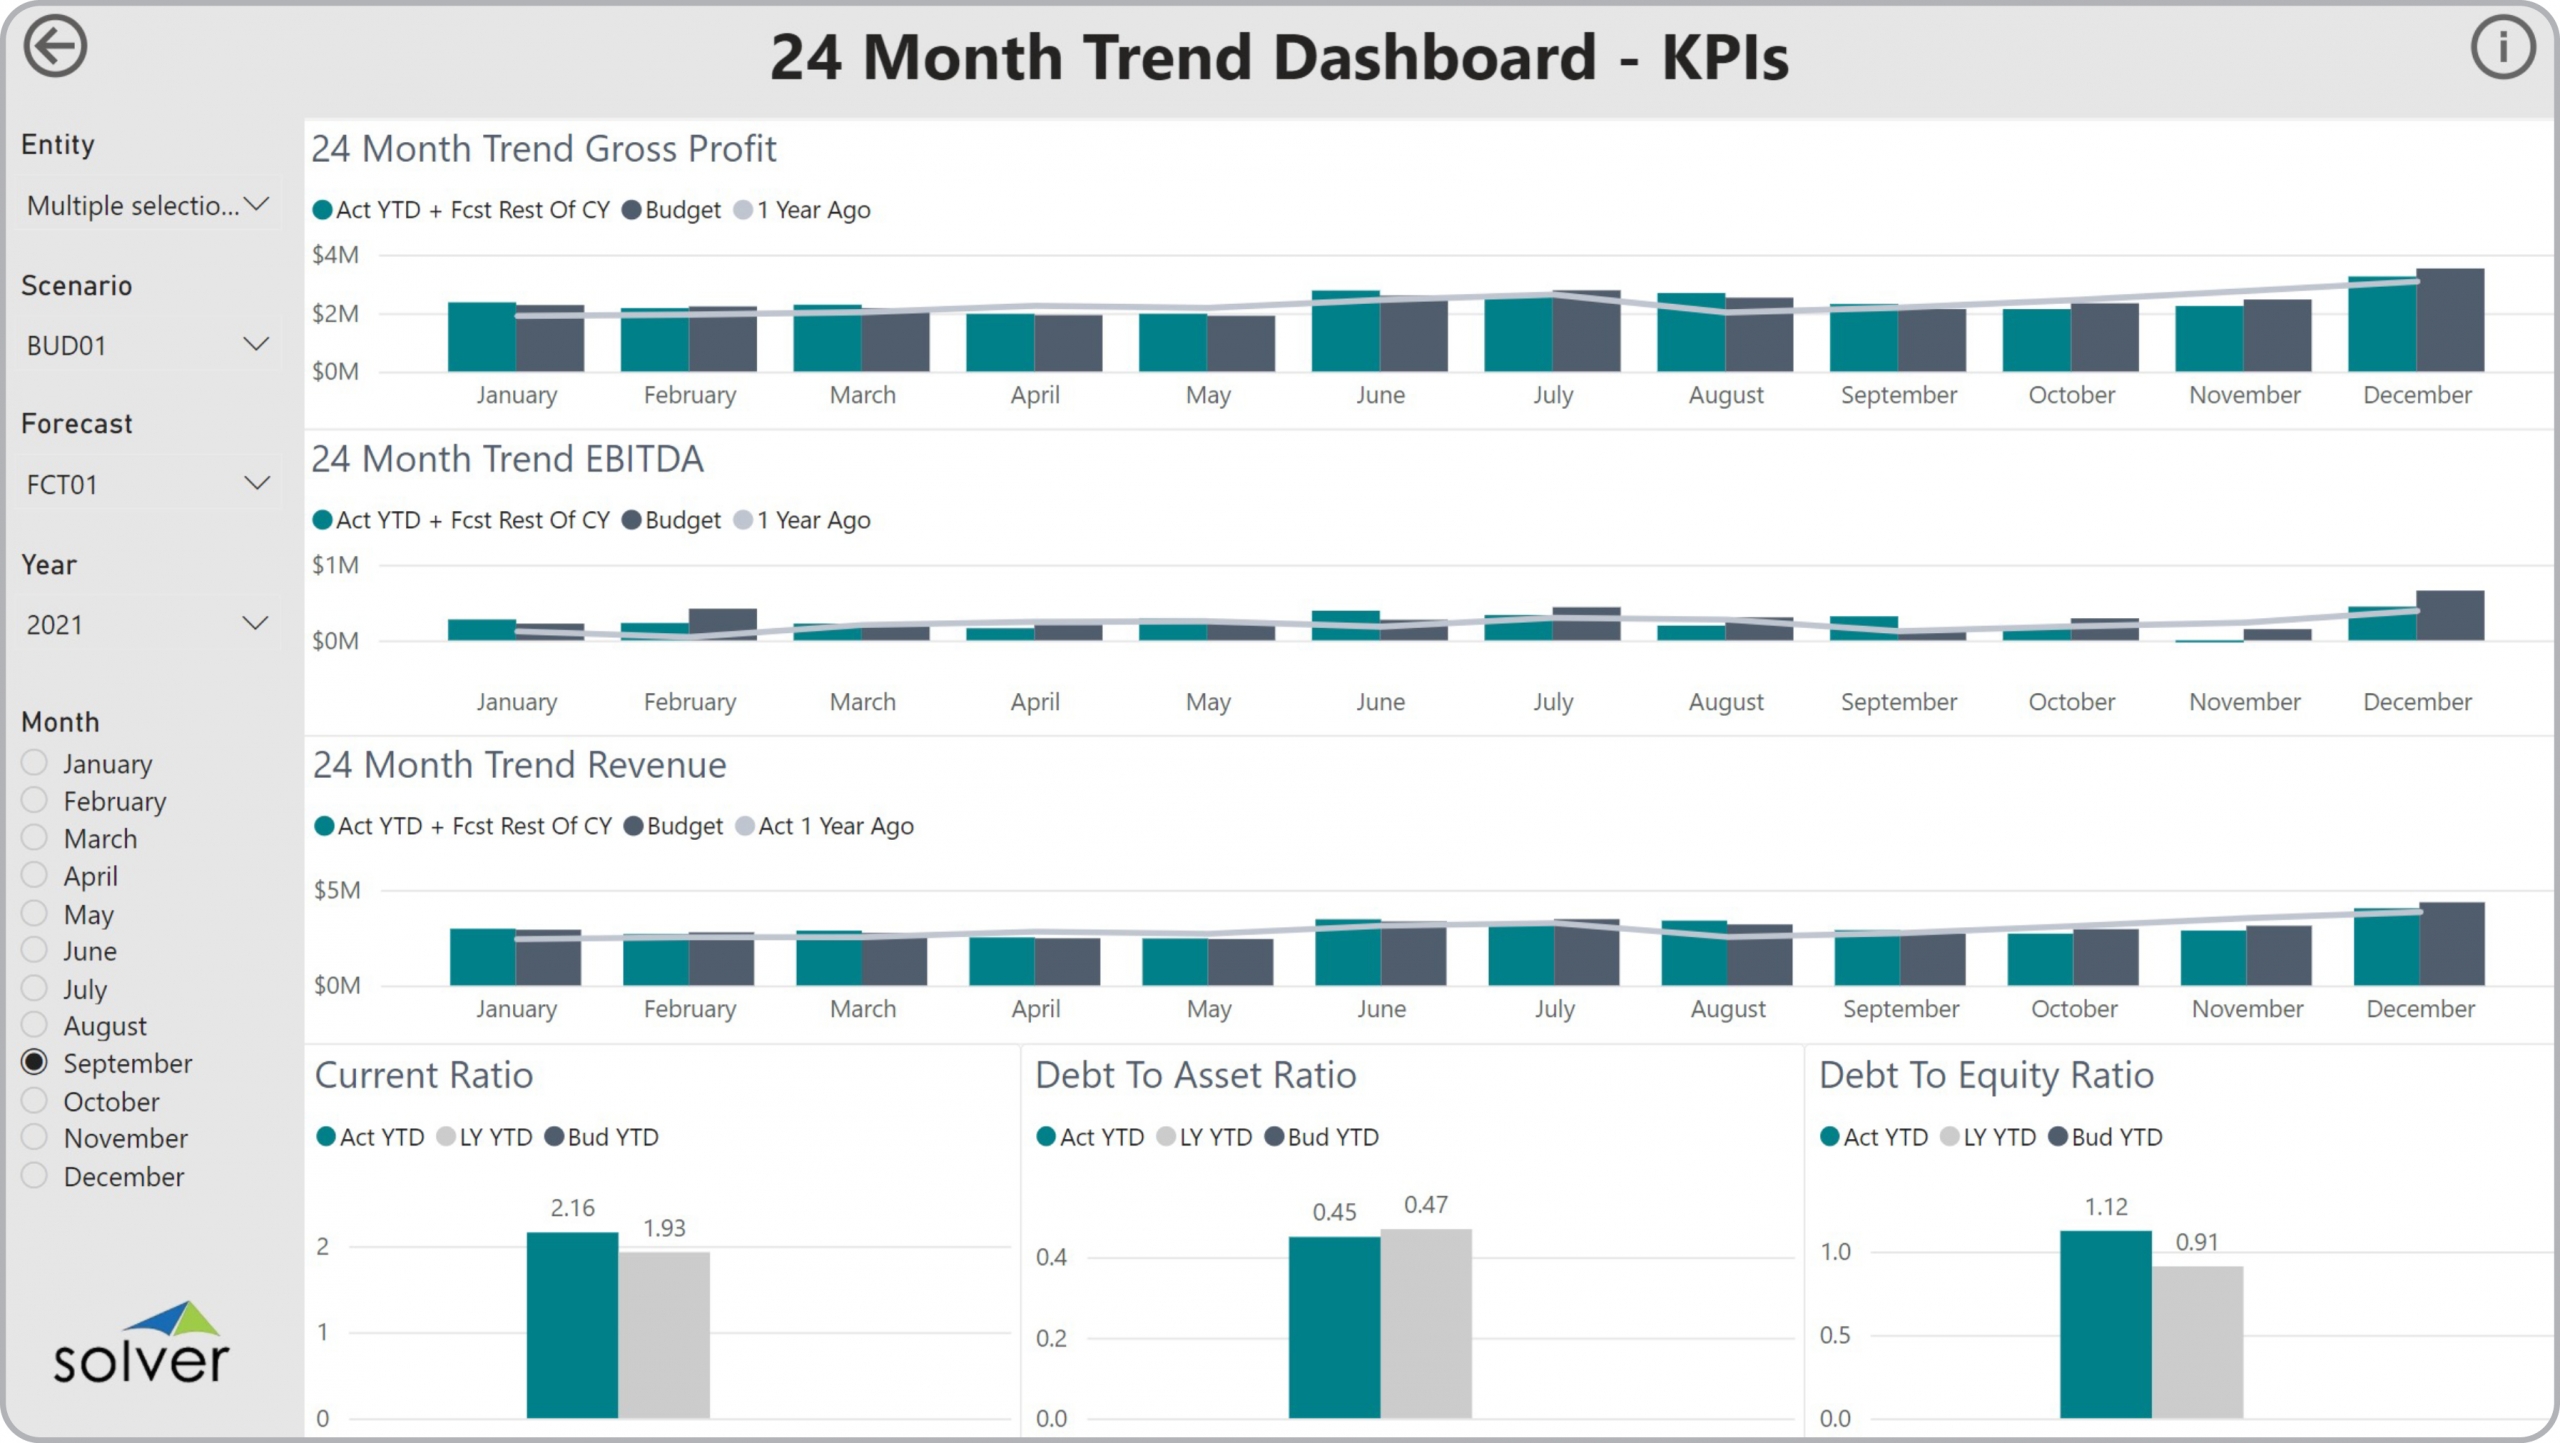
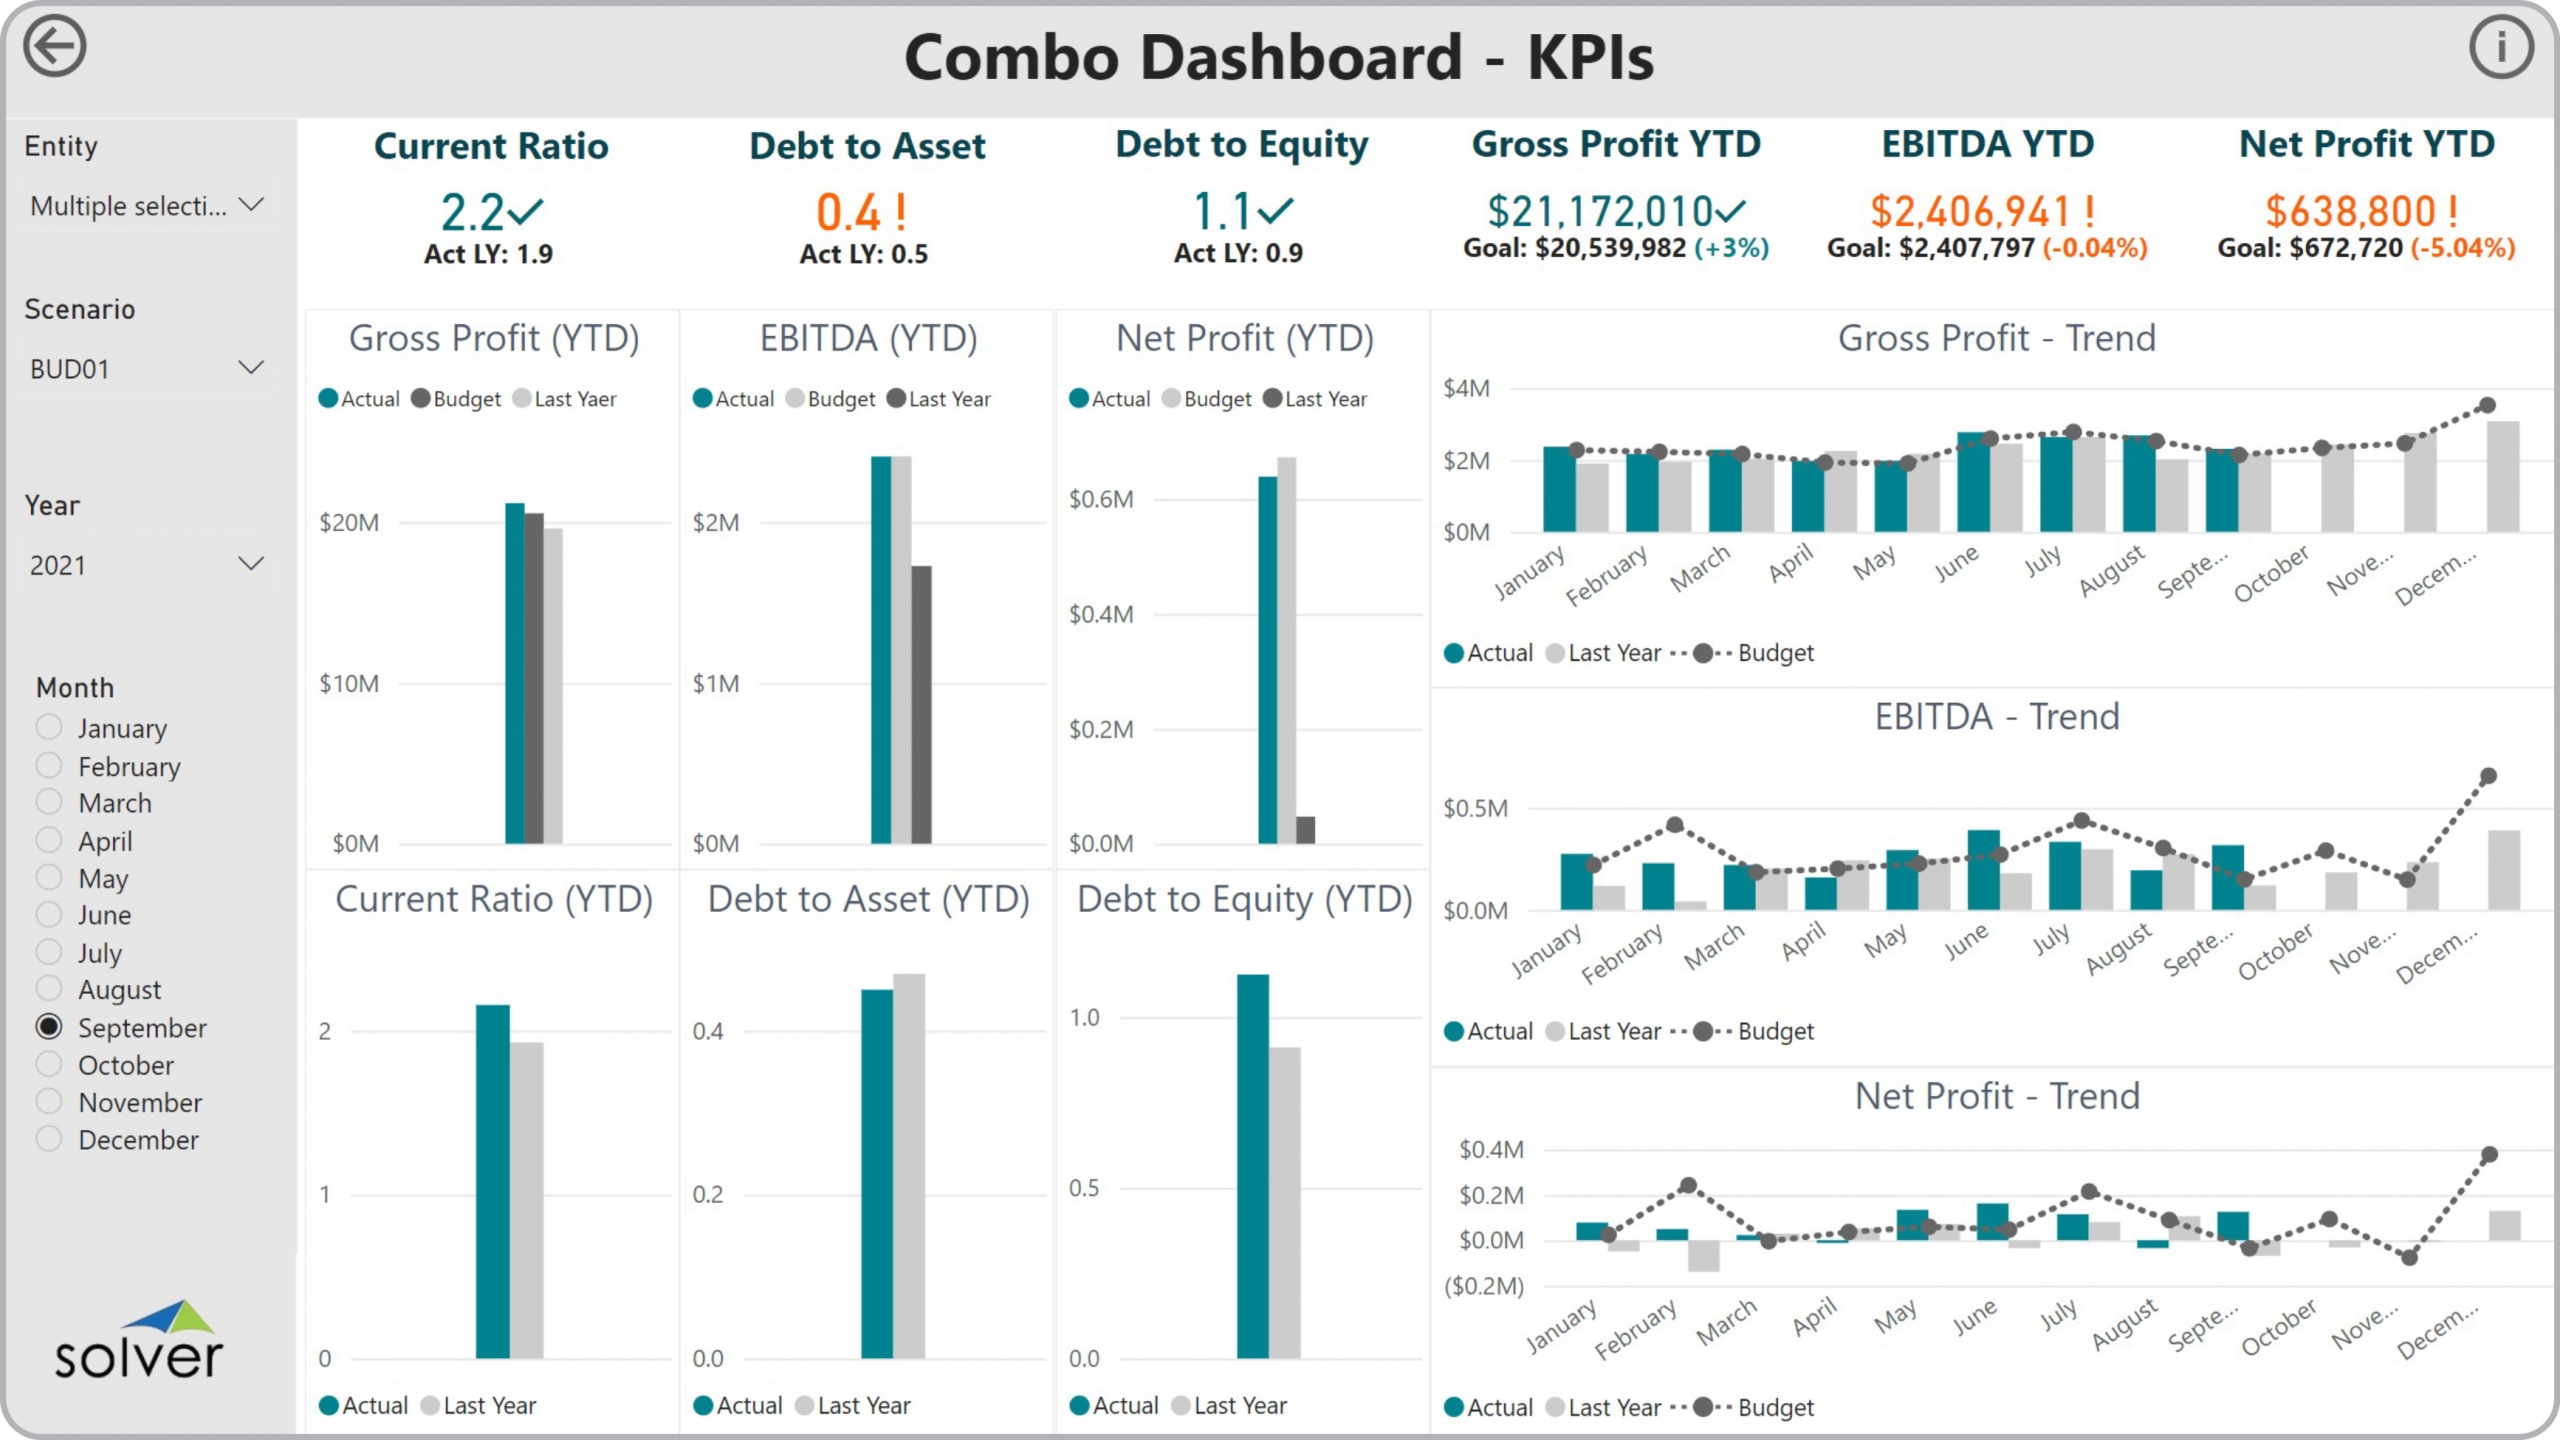
Using 24 Month KPI Trend Dashboards to Streamline the Monthly Reporting Process
How can Financial Dashboard s Drive Faster and Better Decisions? As CFOs increasingly become key ...
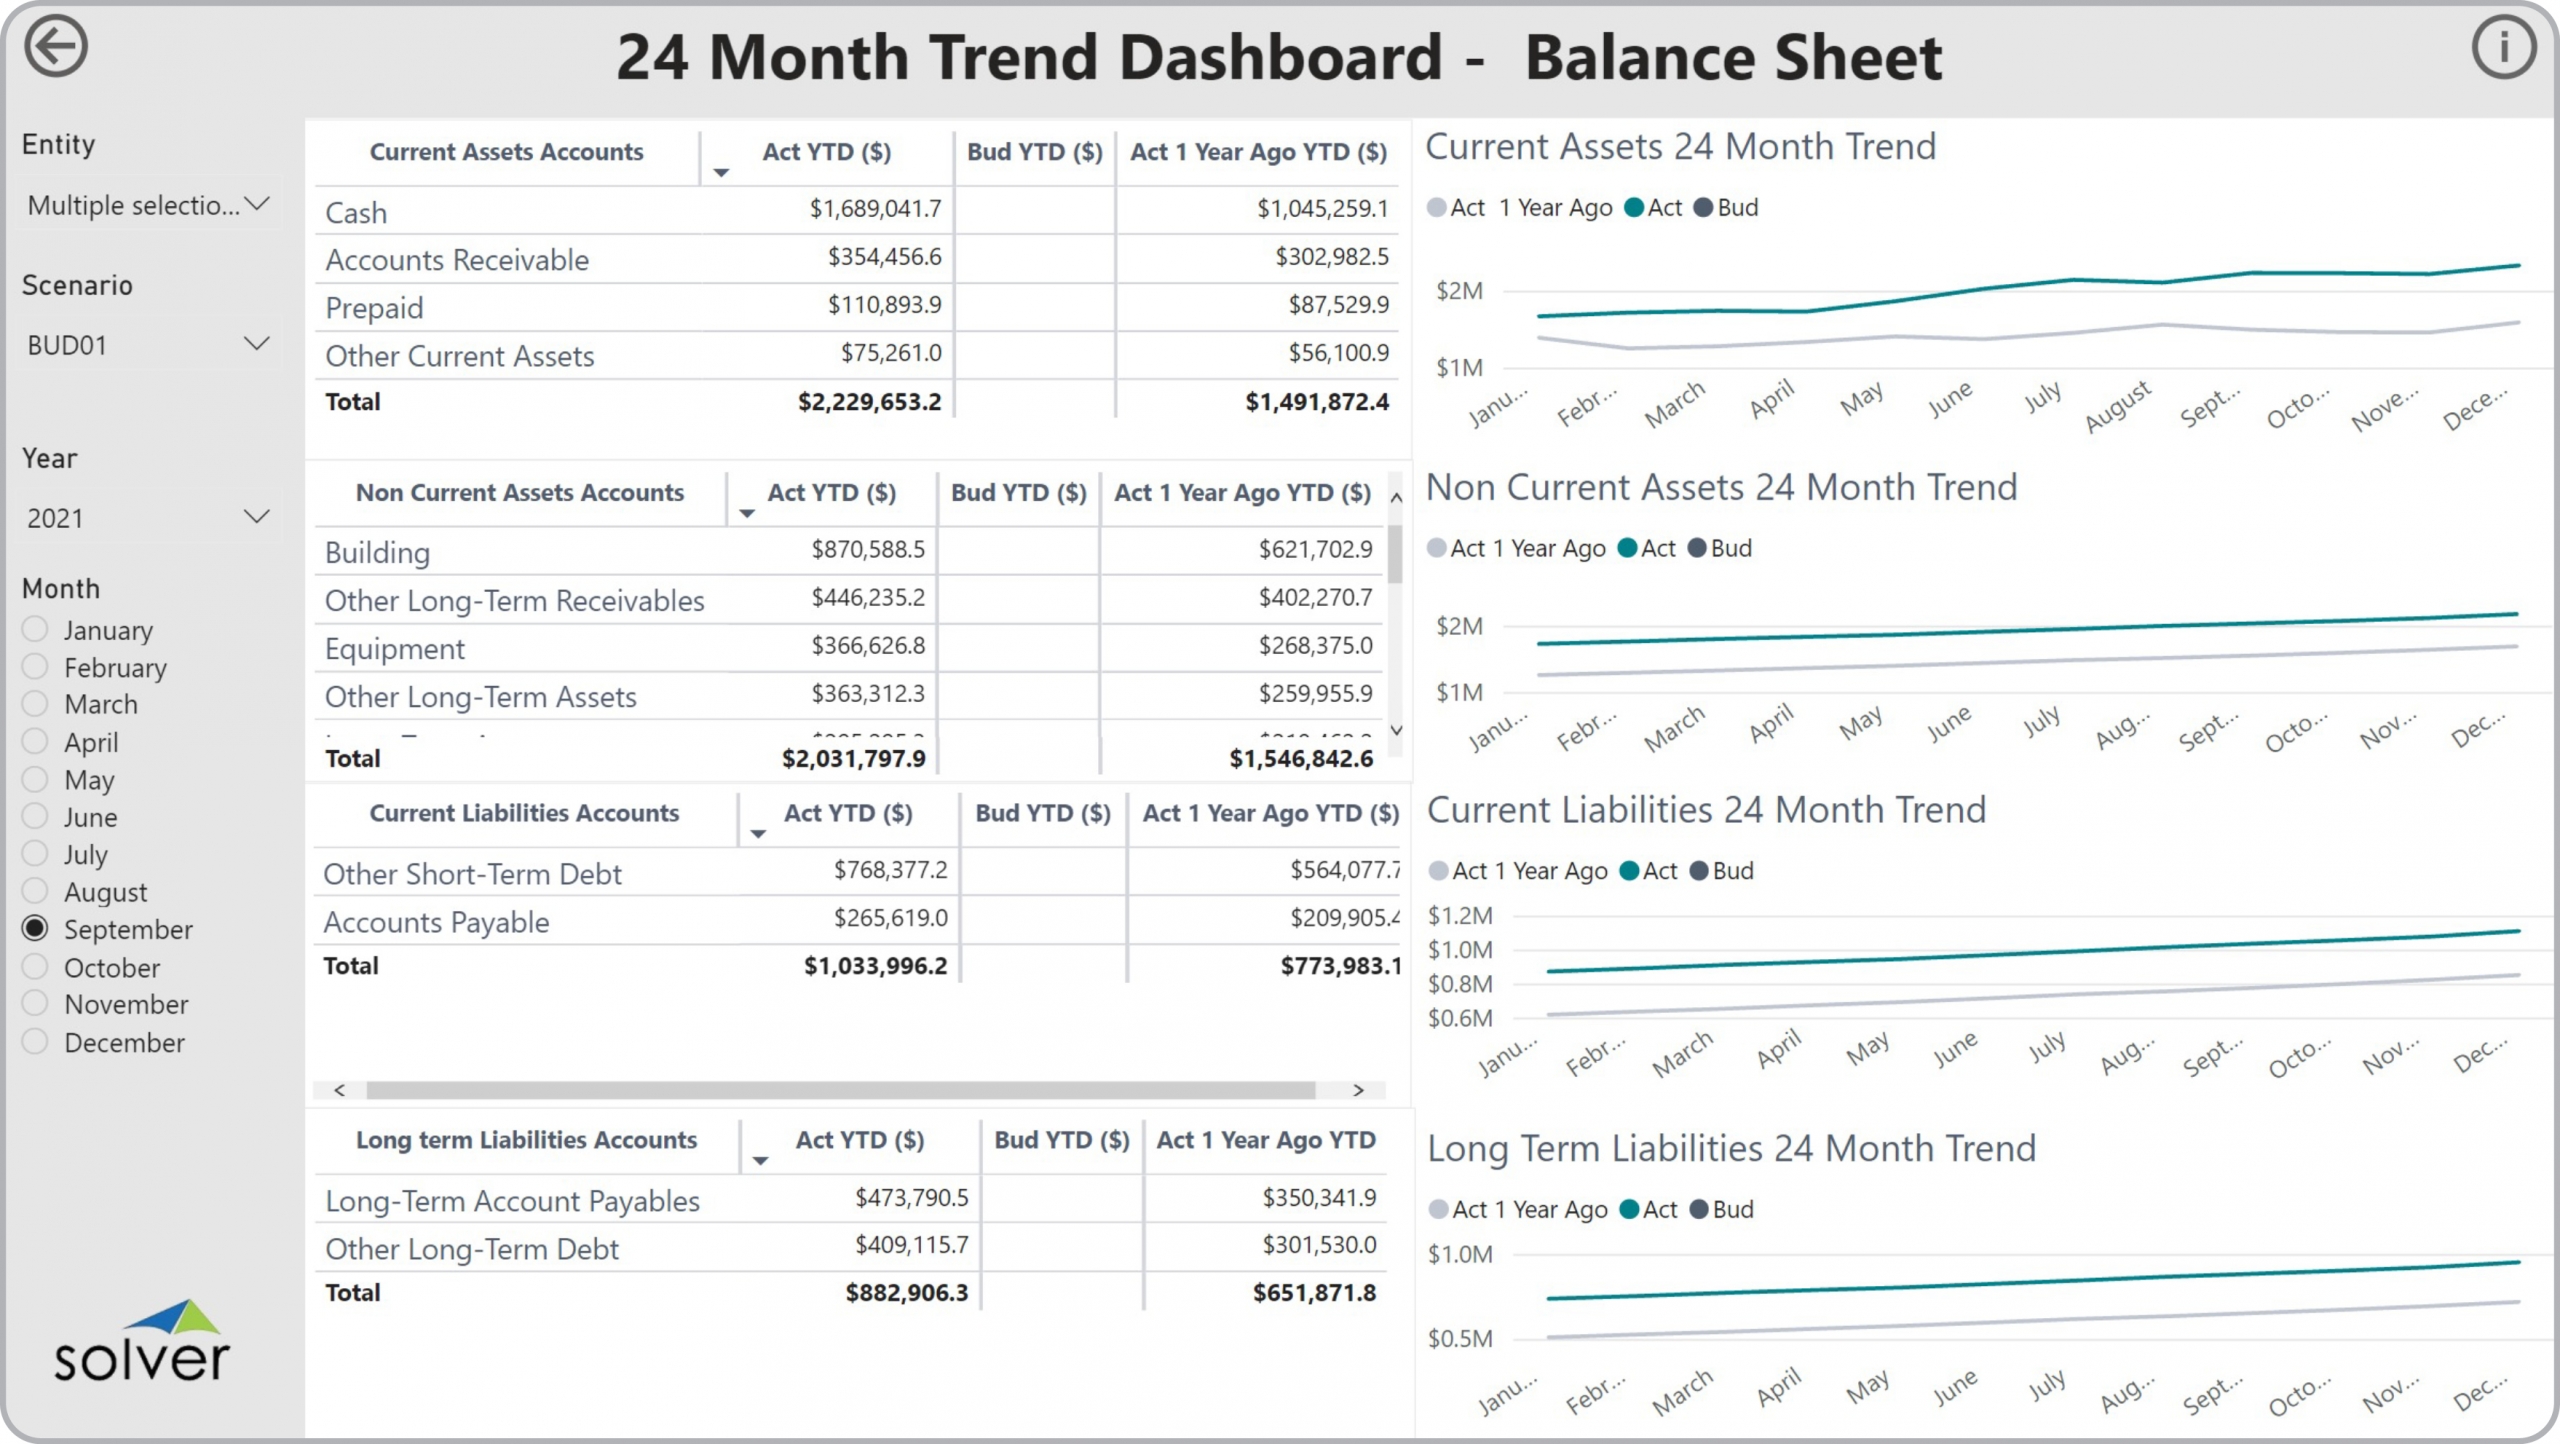
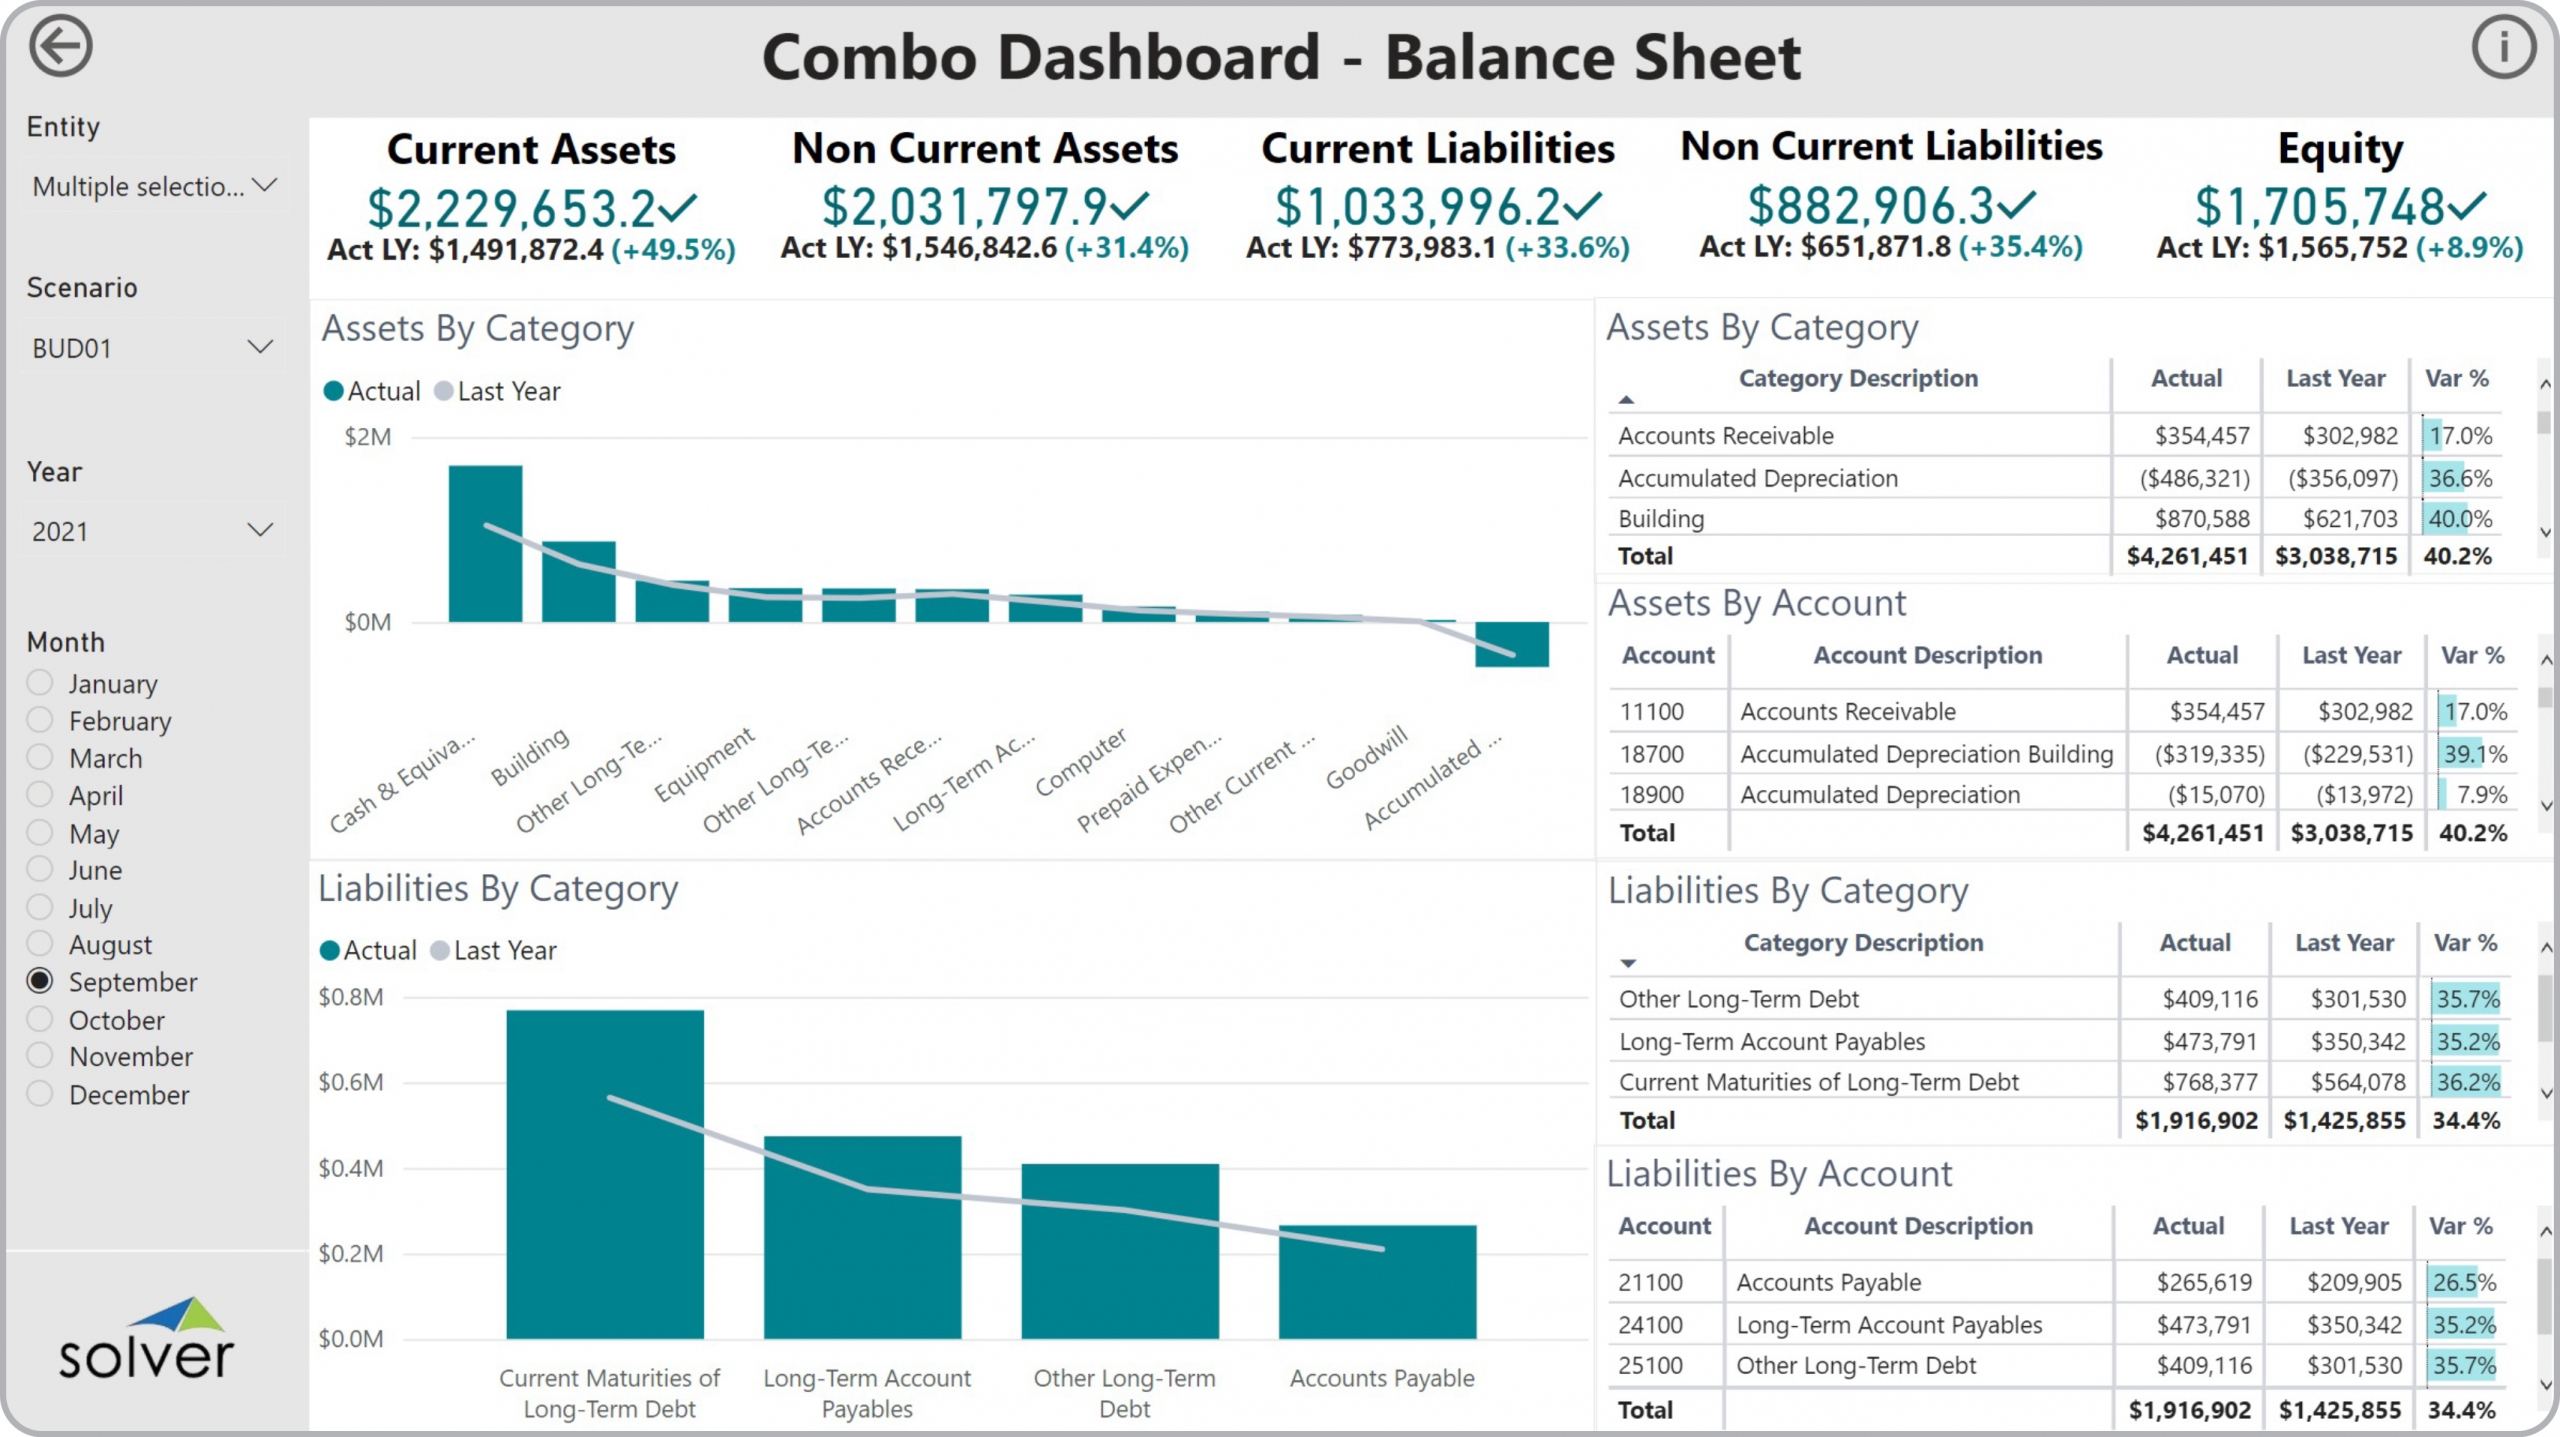
Using 24 Month Balance Sheet Trend Dashboards to Streamline the Monthly Reporting Process
How can Financial Dashboard s Drive Faster and Better Decisions? As CFOs increasingly become key ...
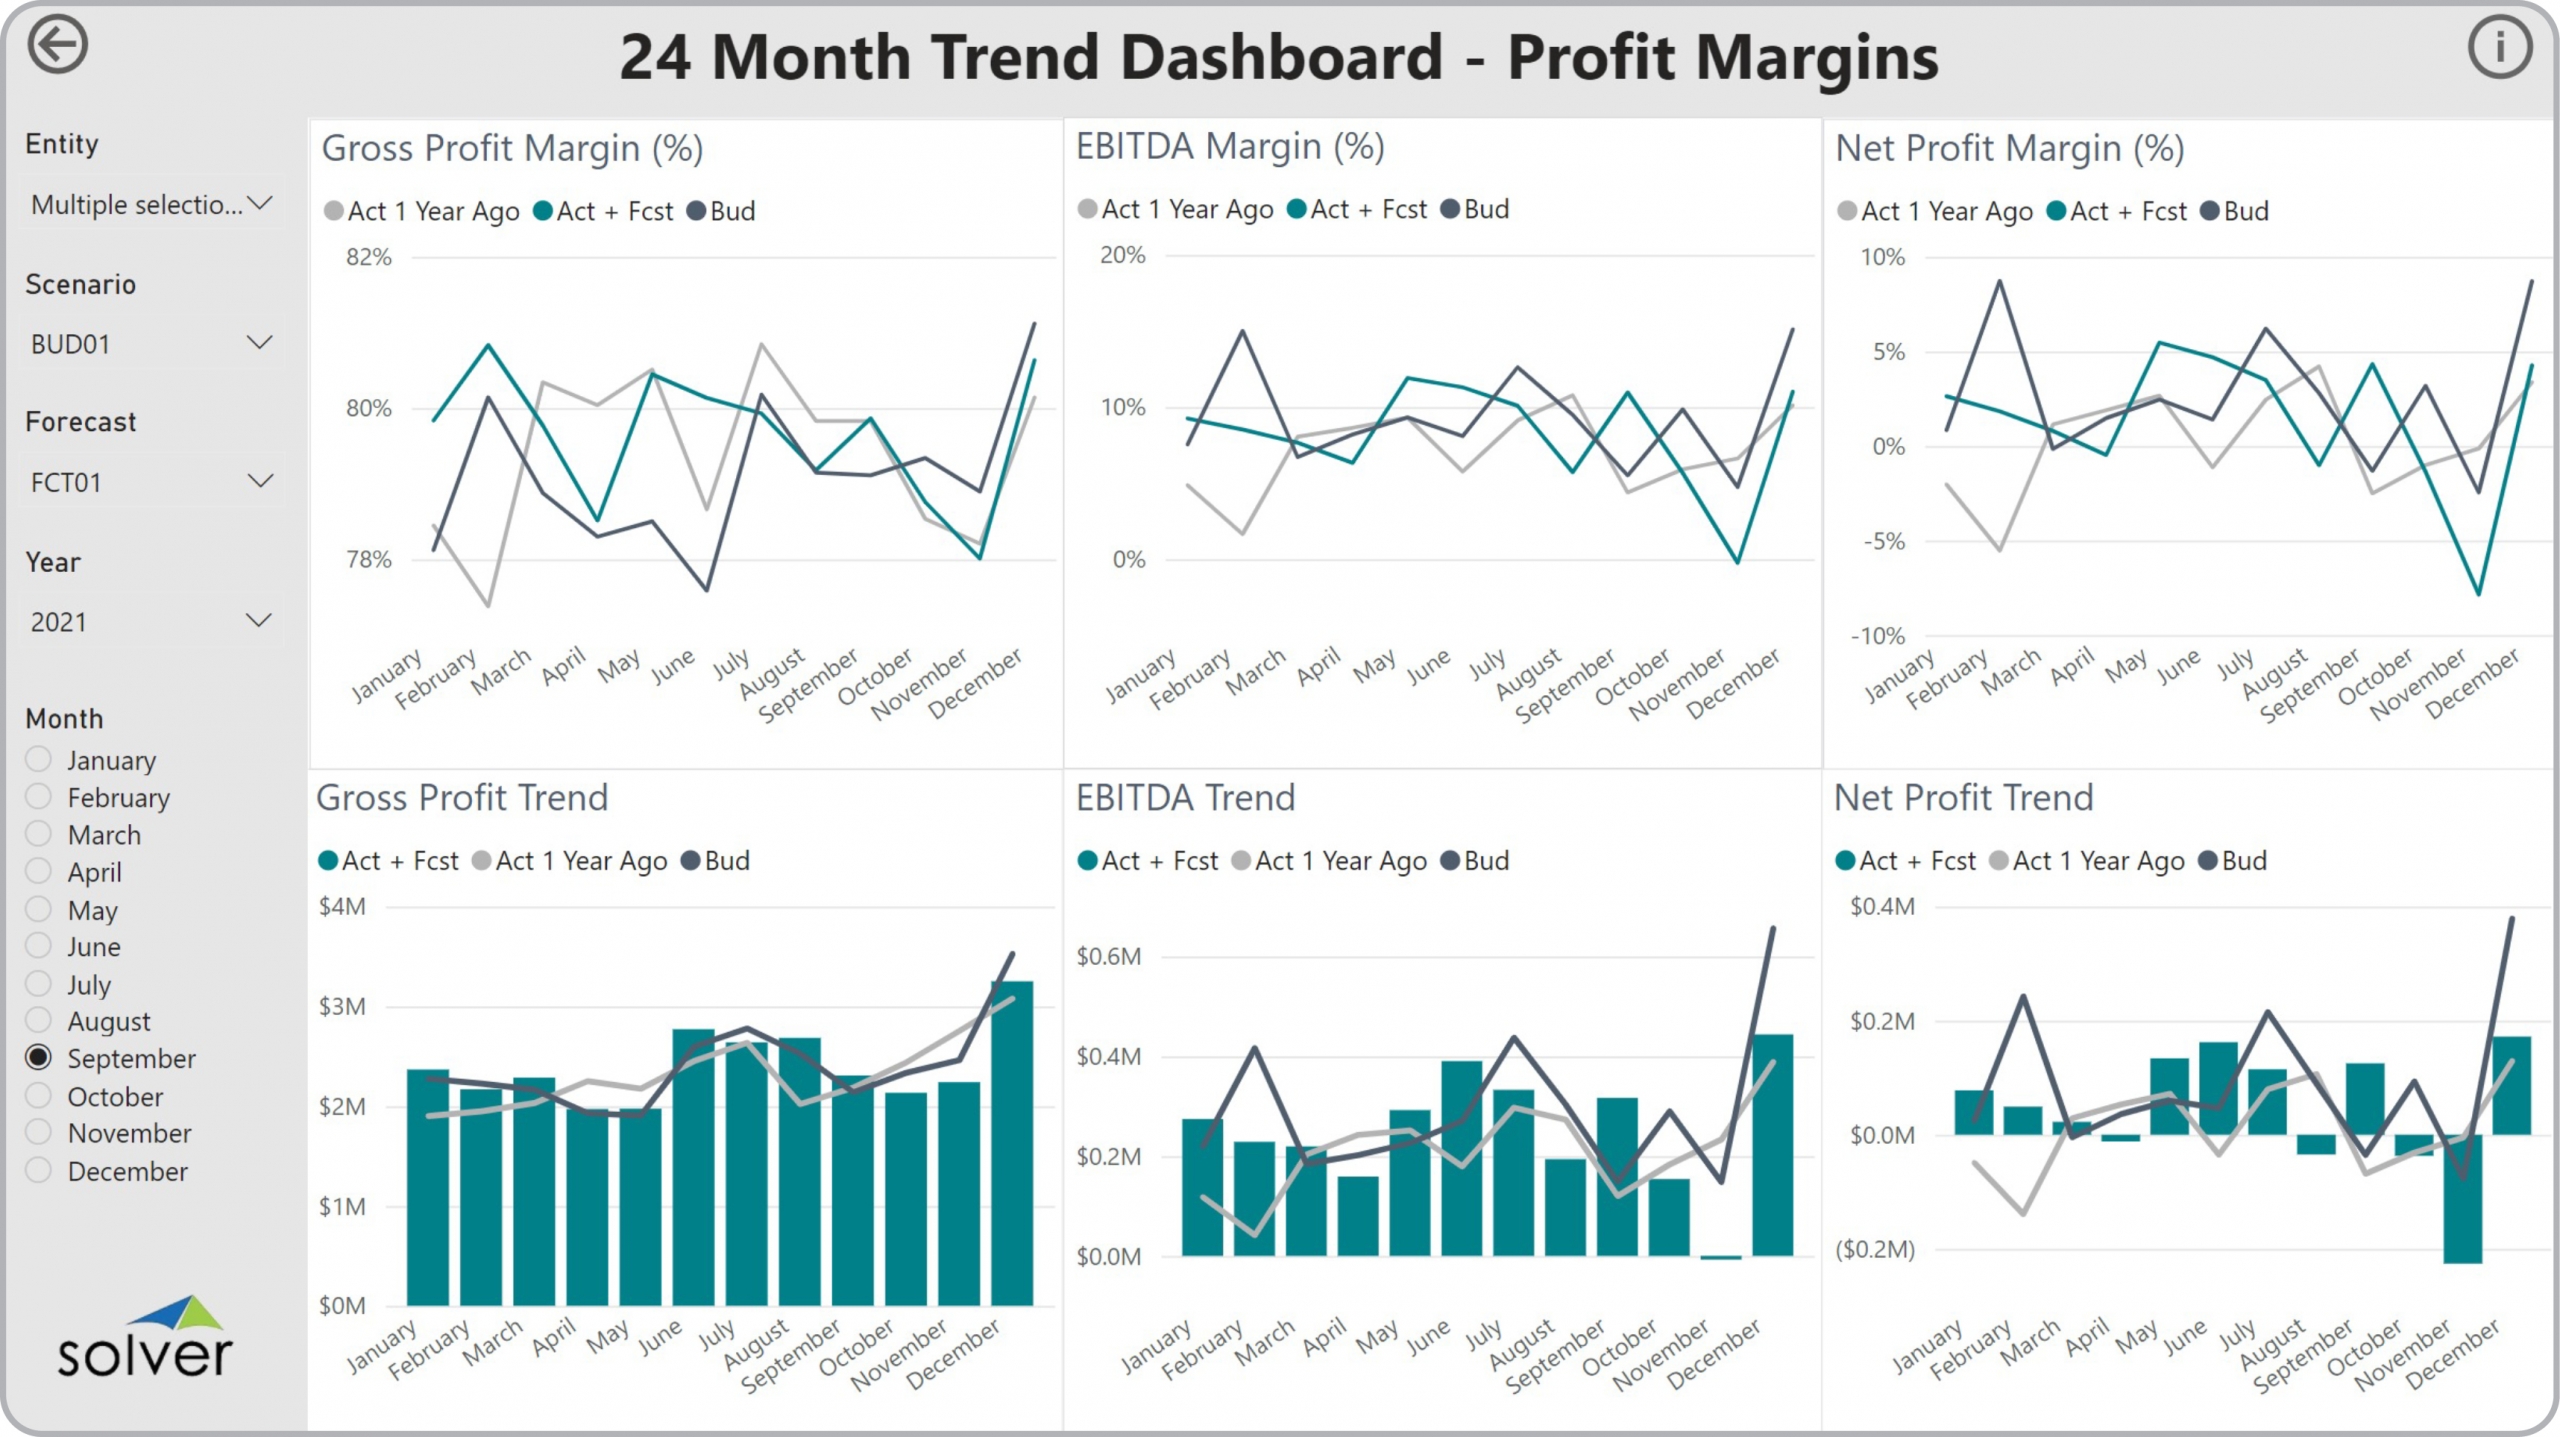
Using 24 Month Profitability Trend Dashboards to Streamline the Monthly Reporting Process
How can Financial Dashboard s Drive Faster and Better Decisions? As CFOs increasingly become key ...
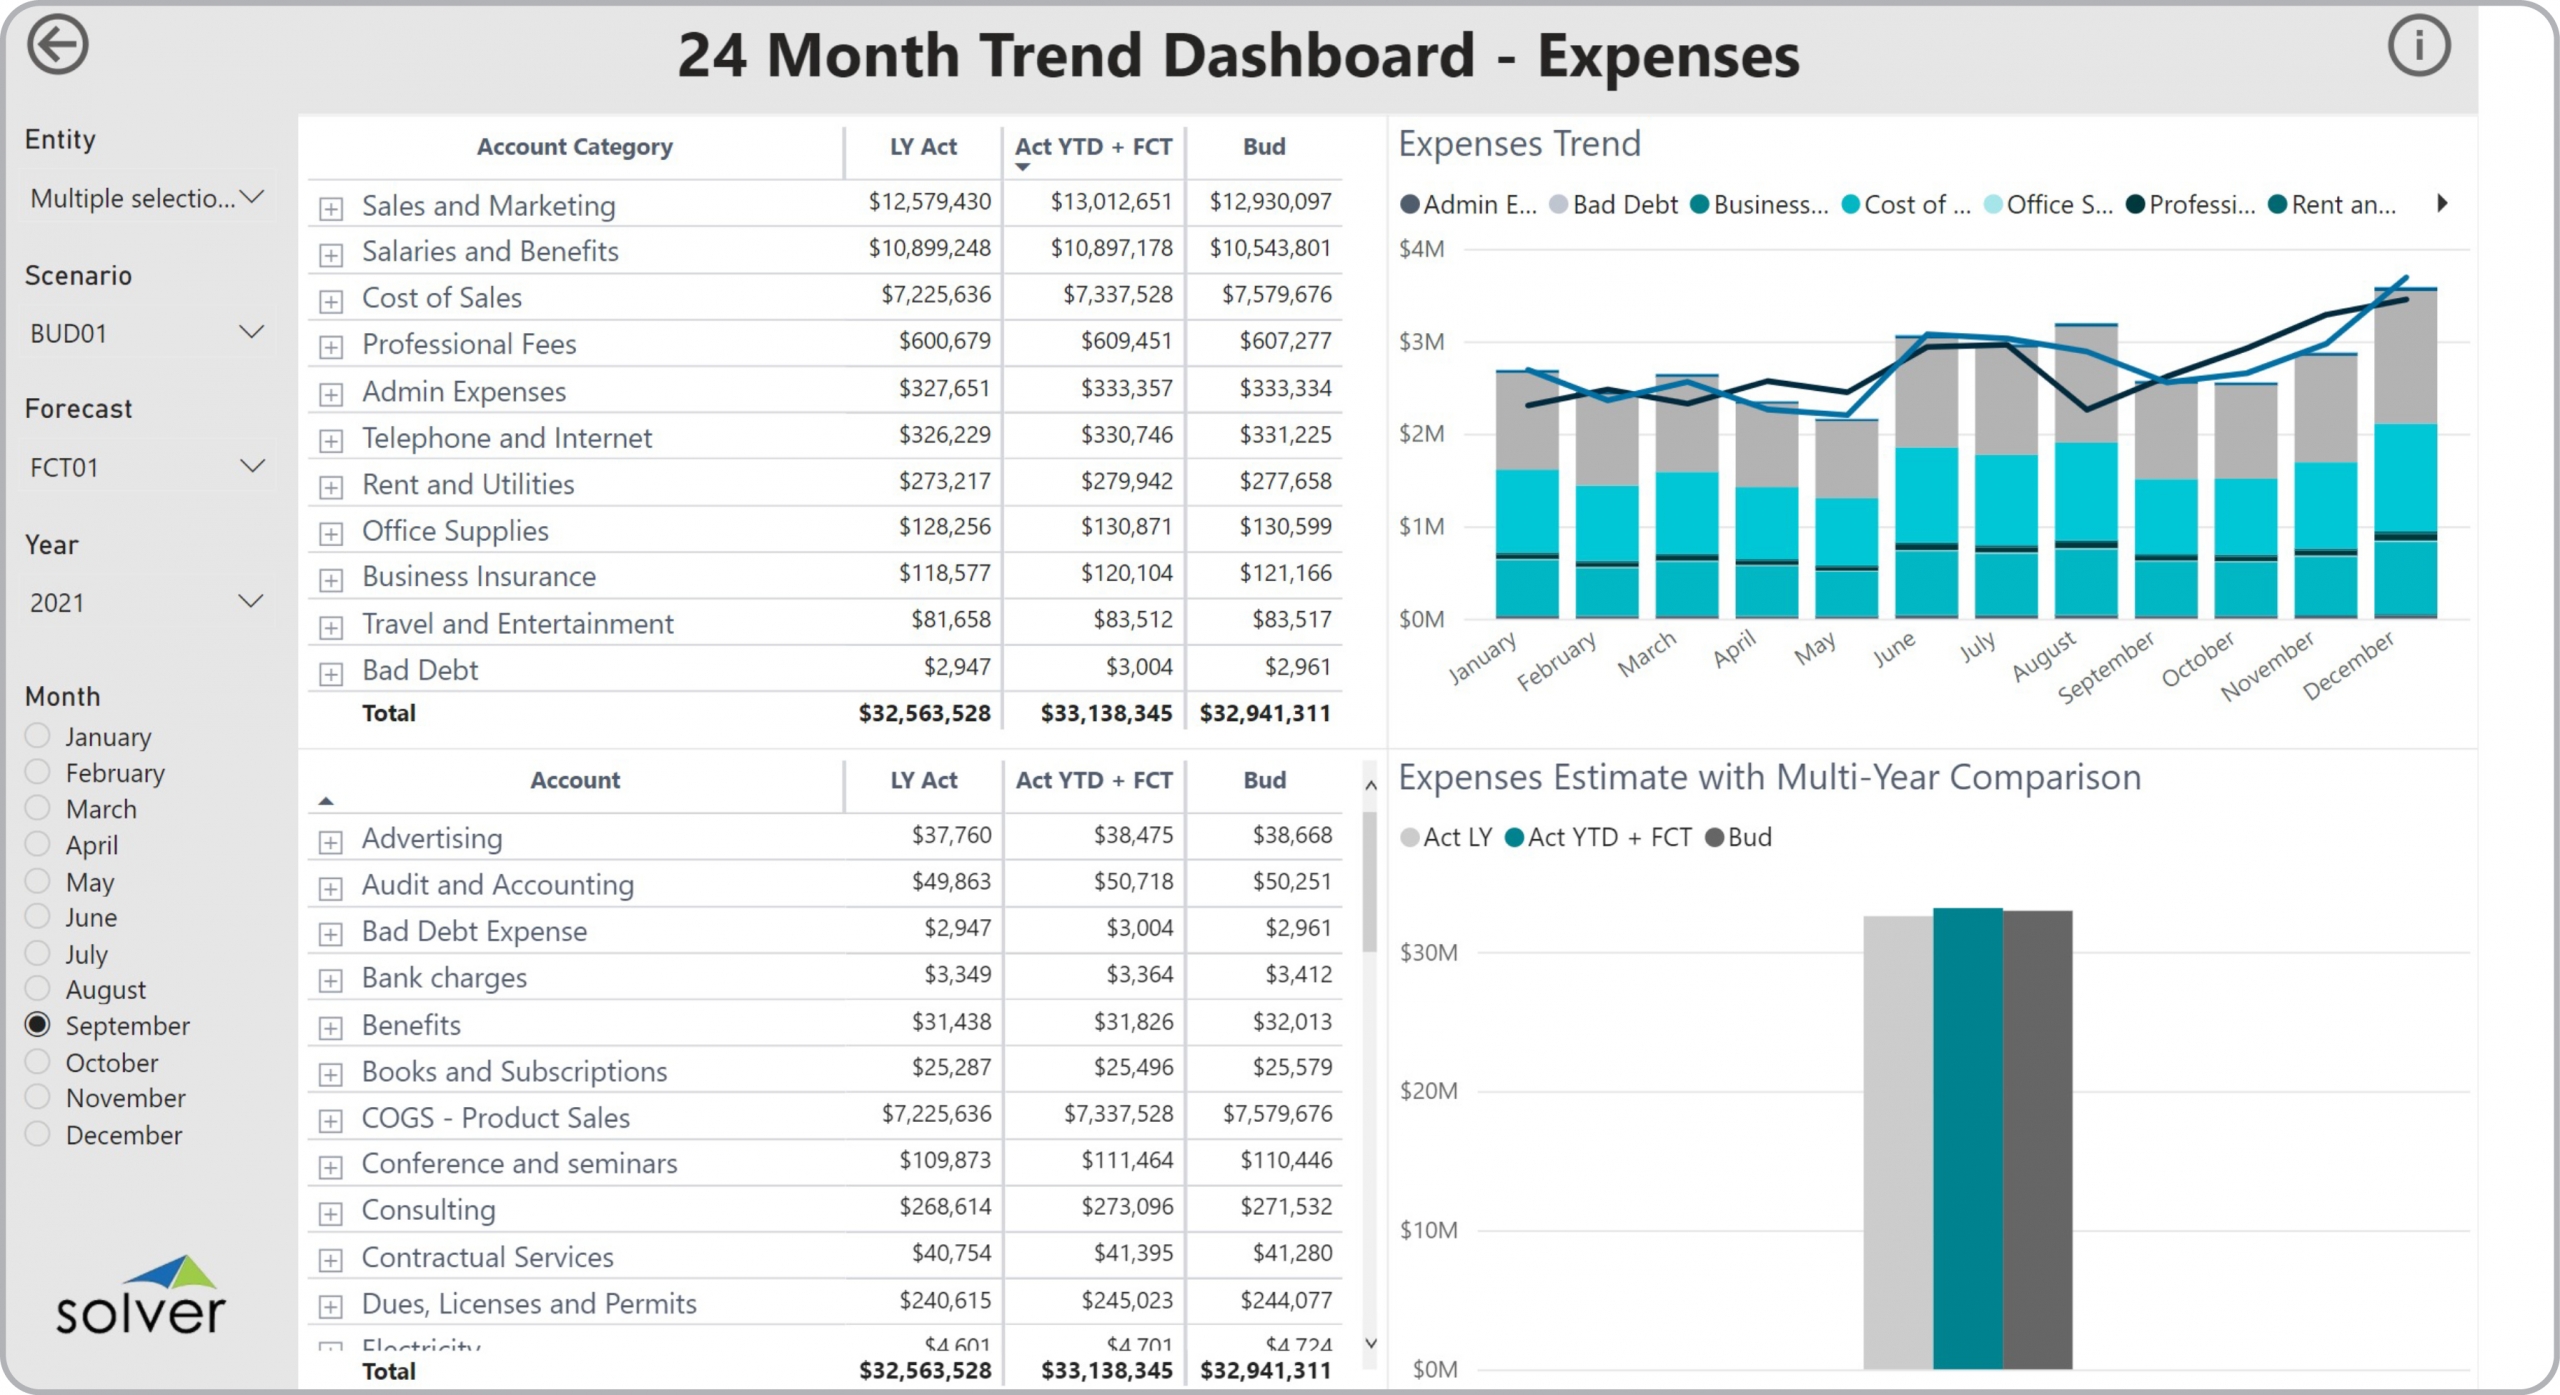
Using 24 Month Expense Trend Dashboards to Streamline the Monthly Reporting Process
How can Financial Dashboard s Drive Faster and Better Decisions? As CFOs increasingly become key ...
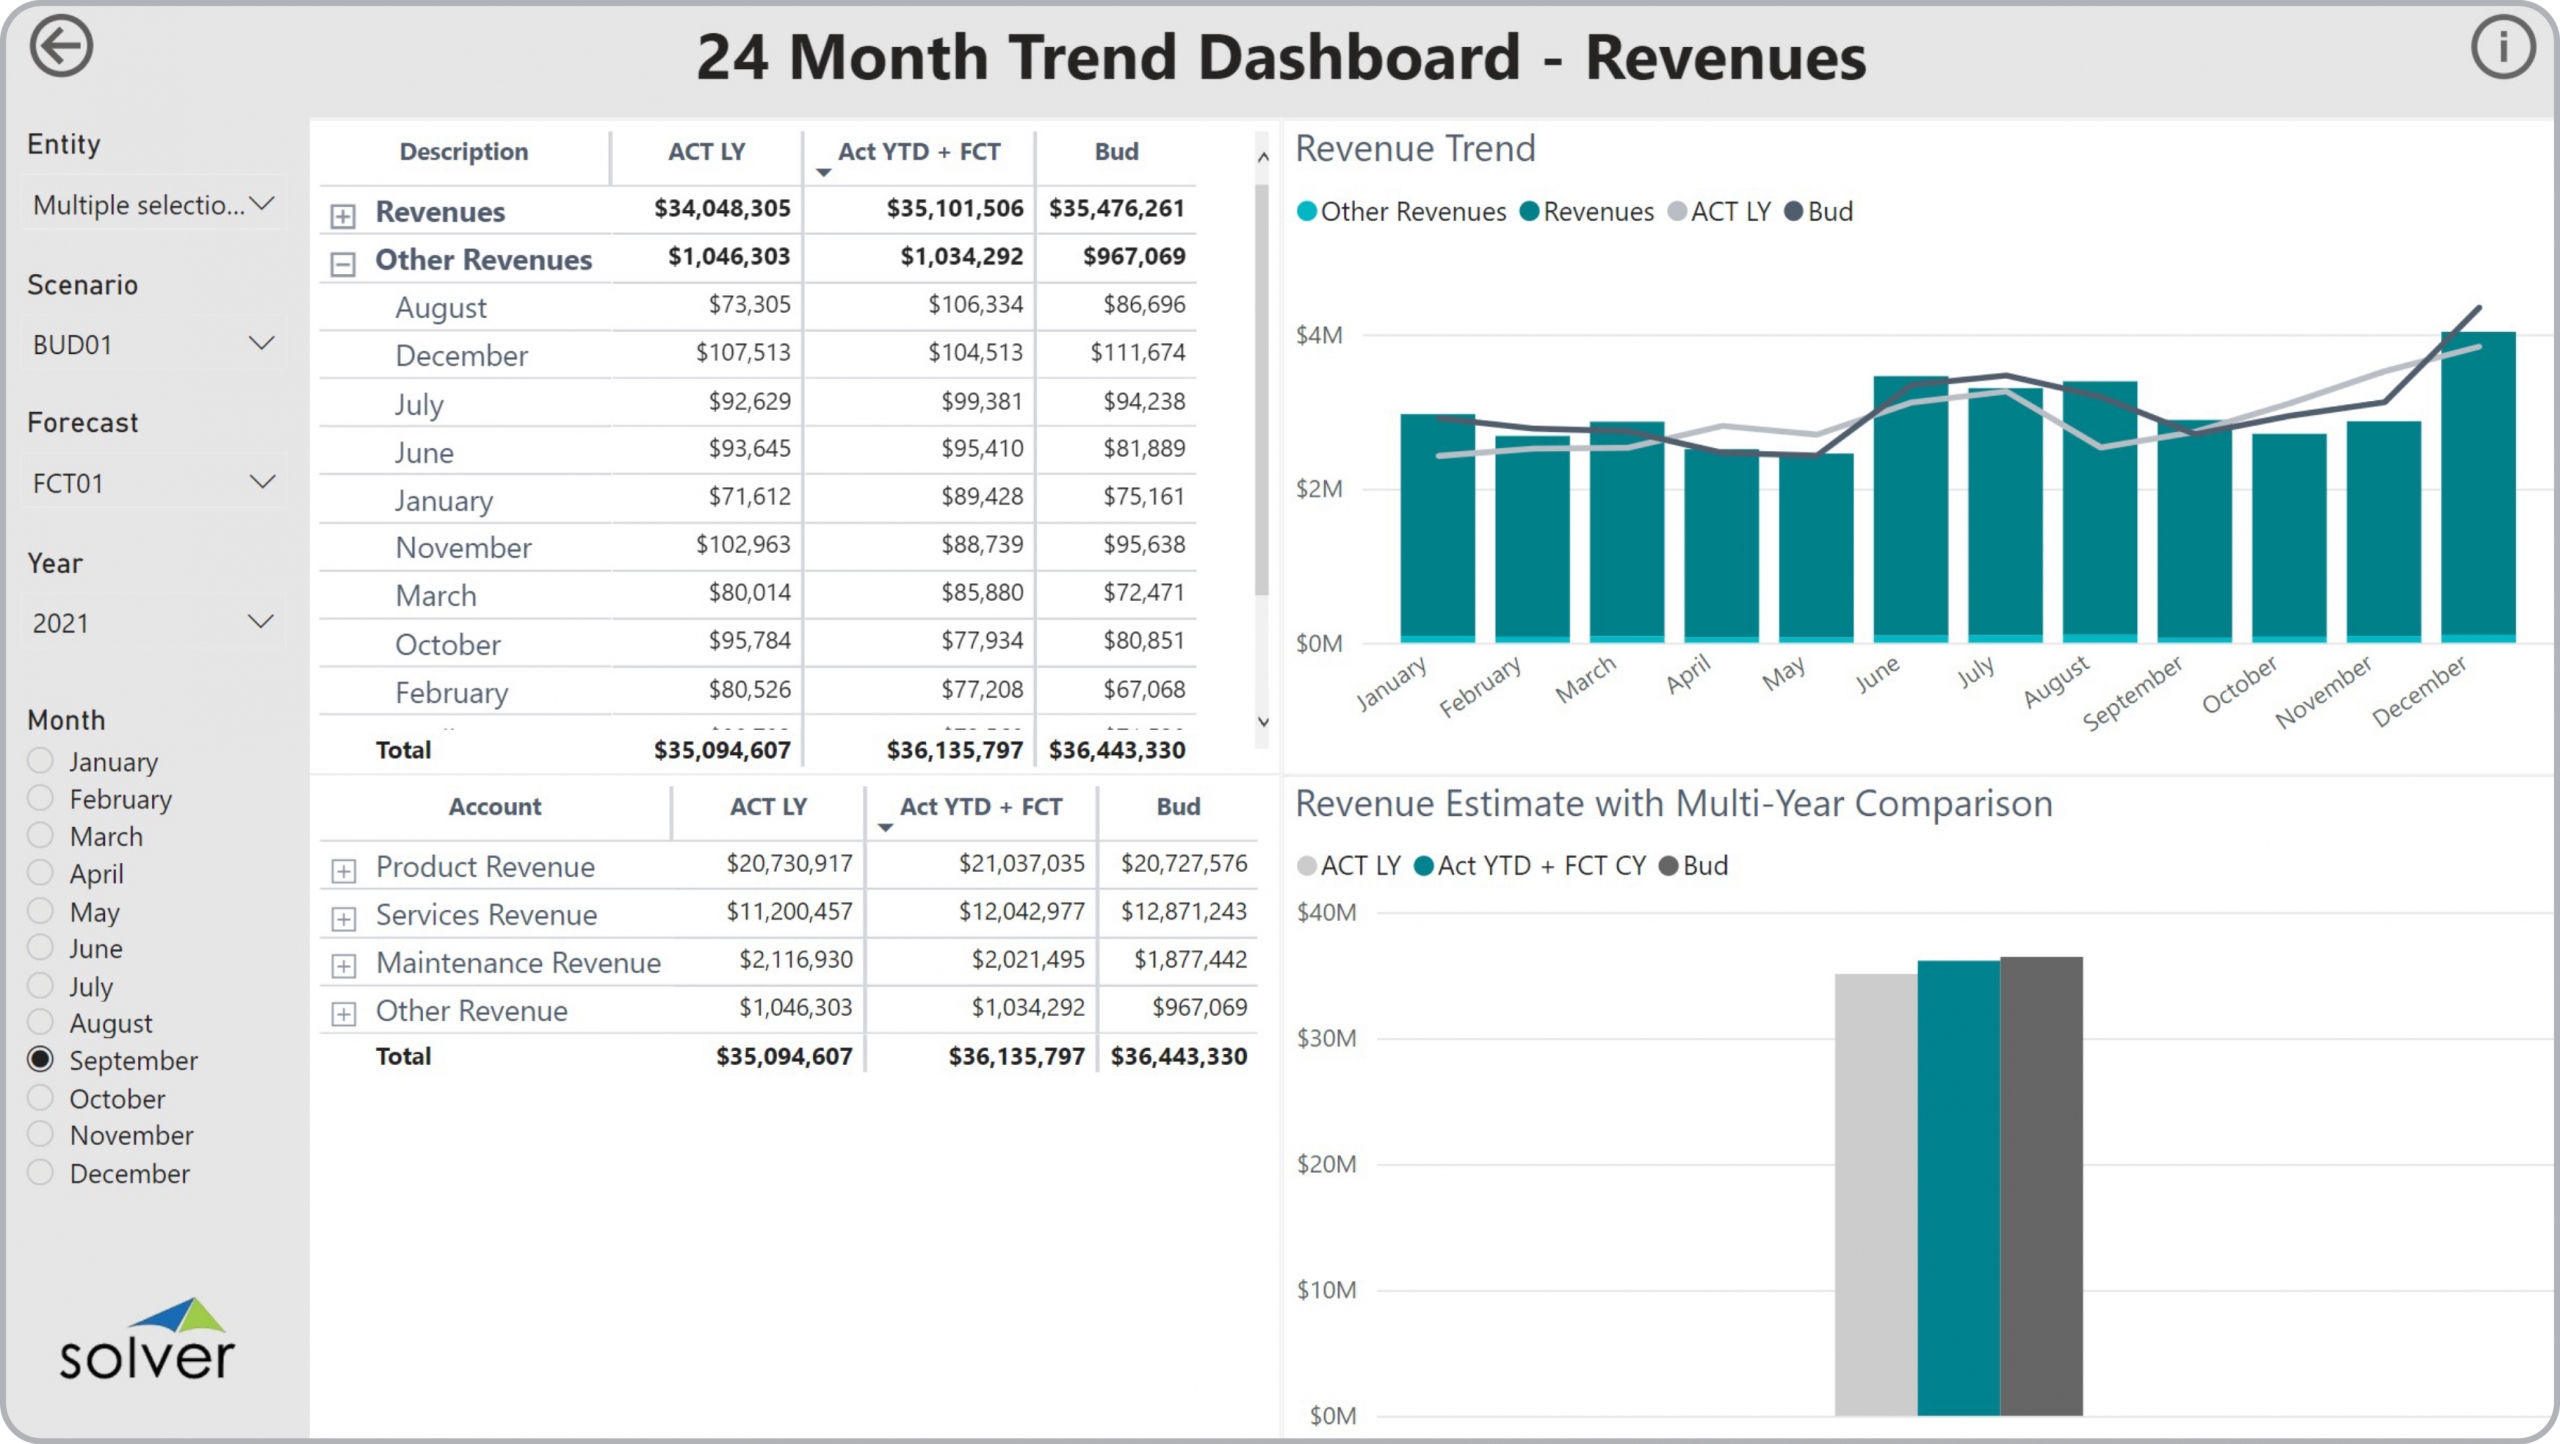
Using 24 Month Revenue Trend Dashboards to Streamline the Monthly Reporting Process
How can Financial Dashboard s Drive Faster and Better Decisions? As CFOs increasingly become key ...
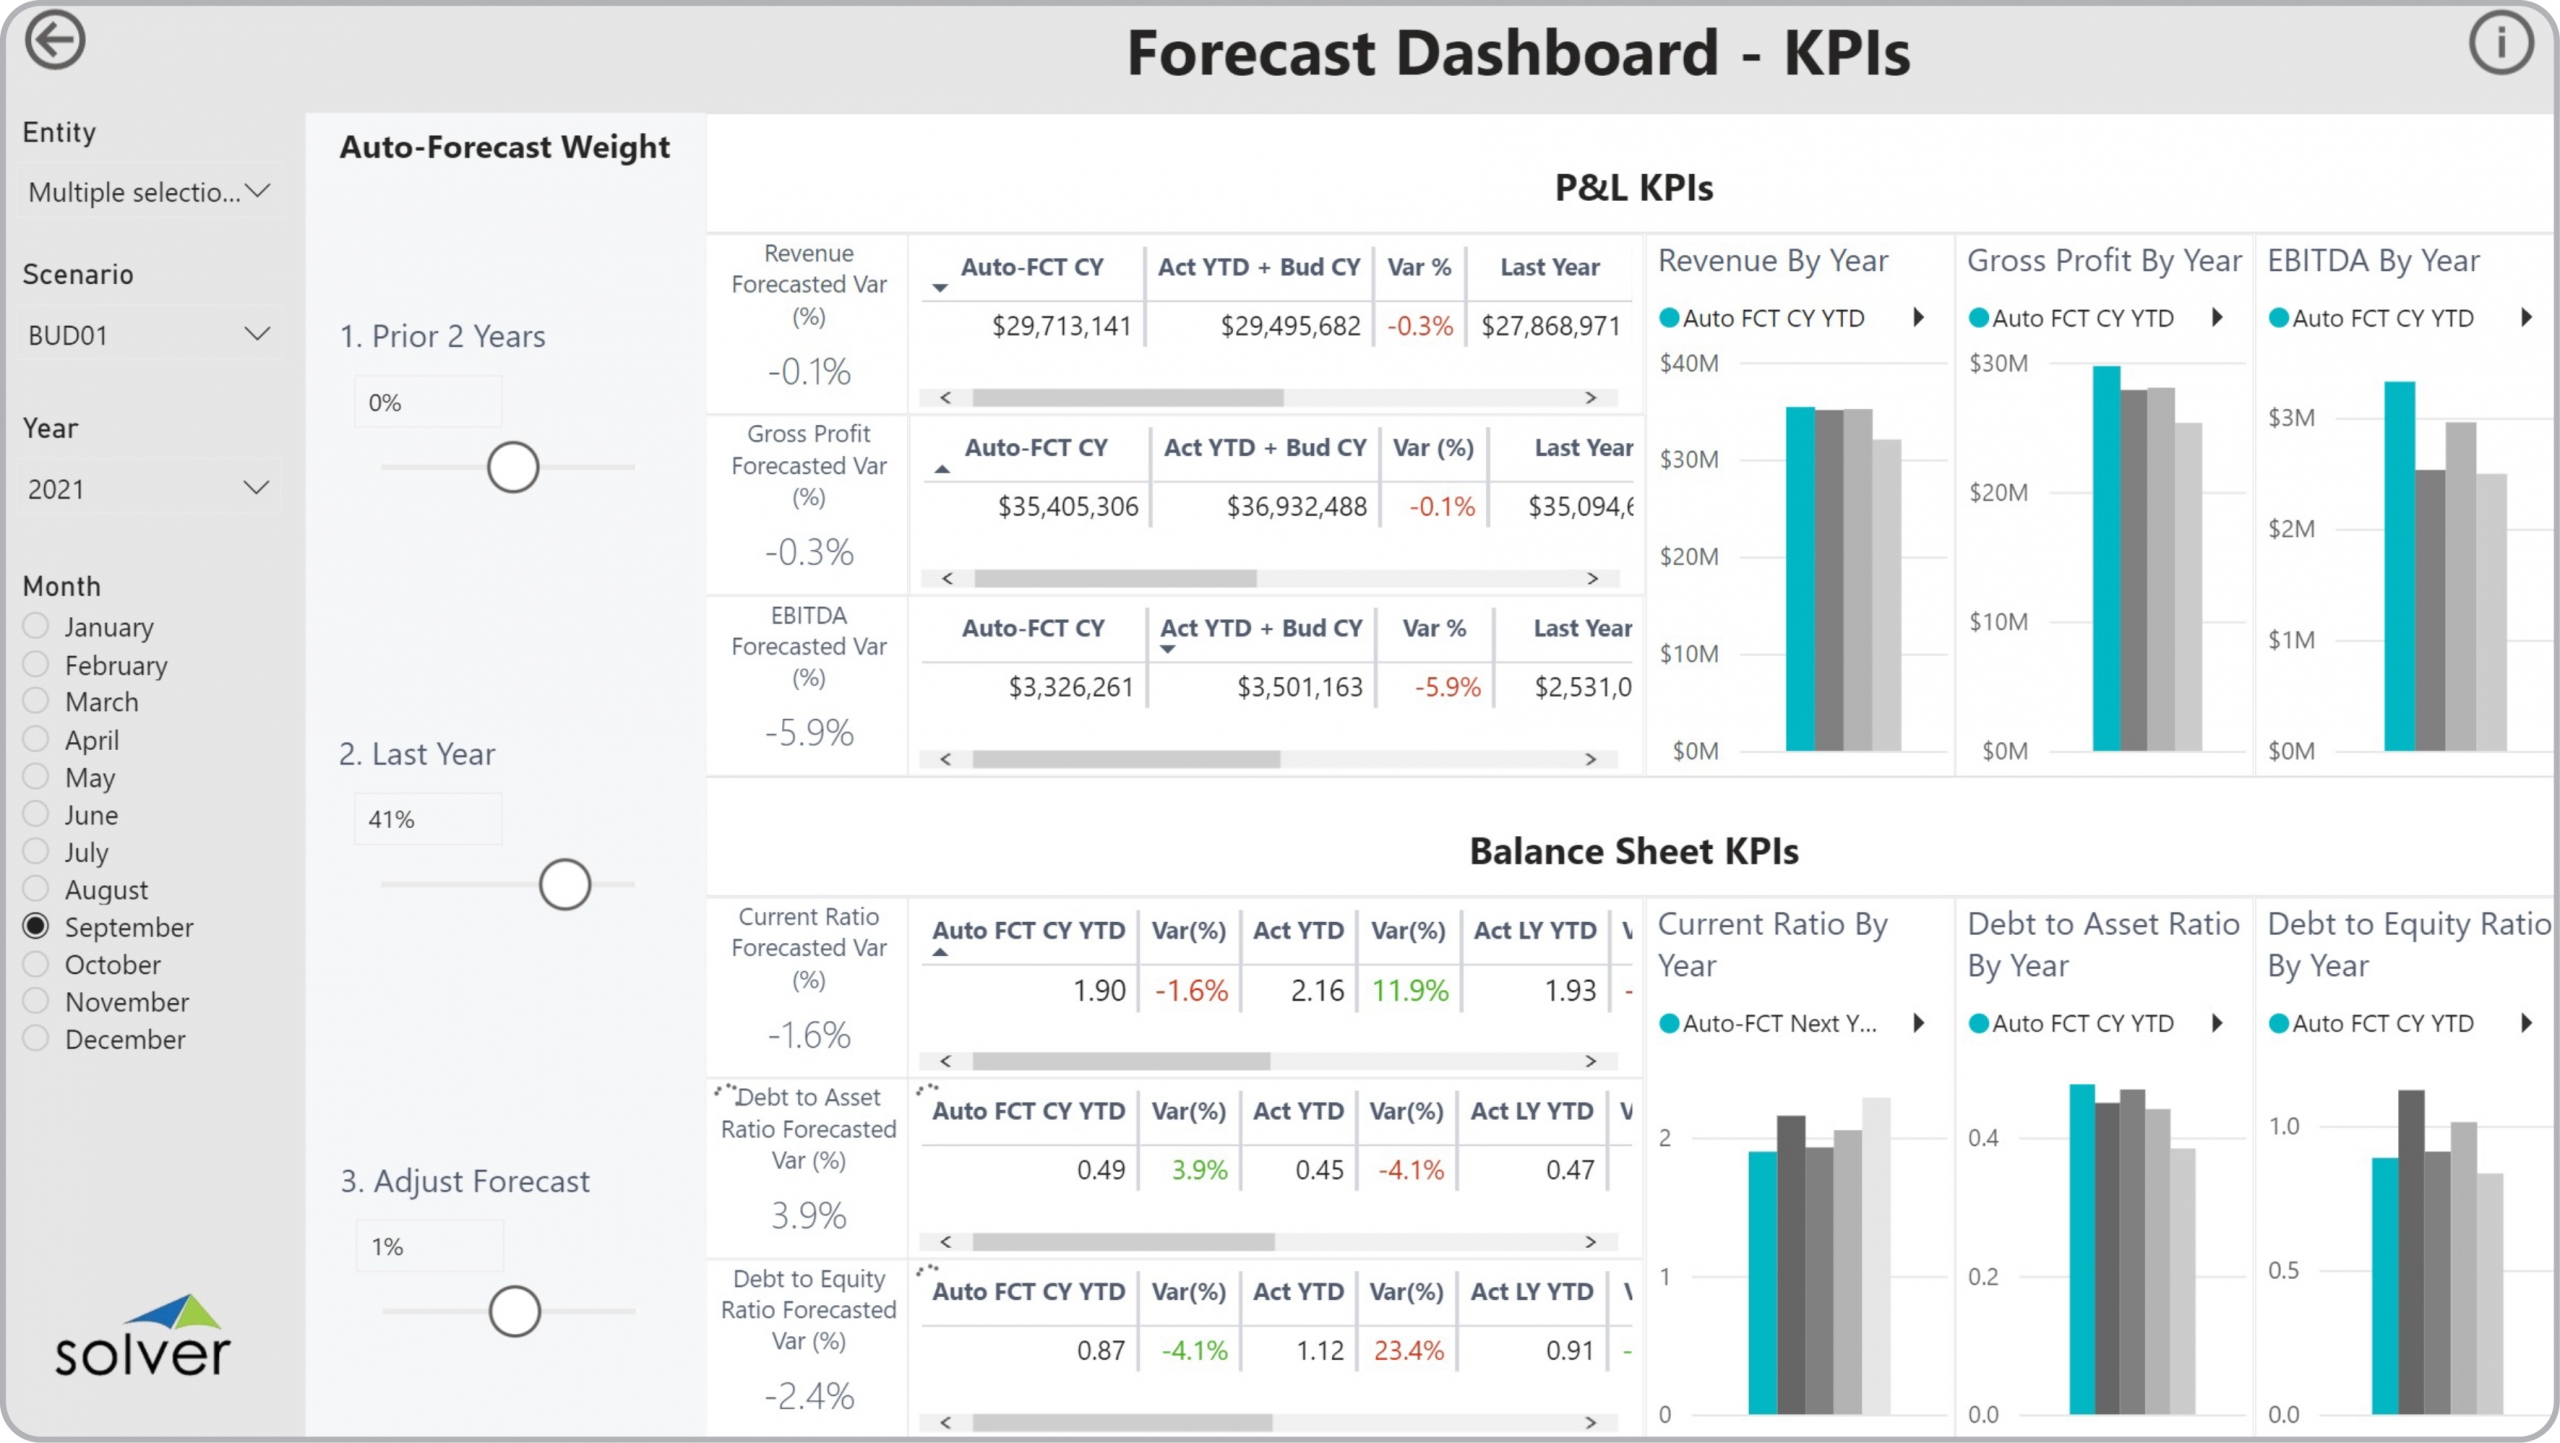
Using KPI Dashboard with Trends and Variances to Streamline the Monthly Reporting Process
How can Financial Dashboard s Drive Faster and Better Decisions? As CFOs increasingly become key ...
Using Balance Sheet Dashboards with Variance Analysis to Streamline the Monthly Reporting Process
How can Financial Dashboard s Drive Faster and Better Decisions? As CFOs increasingly become key ...
Using KPI Simulation Dashboards to Streamline the Modelling and Forecasting Process
How can Simulation Dashboard s Drive Faster and Better Decisions? As FP&A Managers increasingly ...
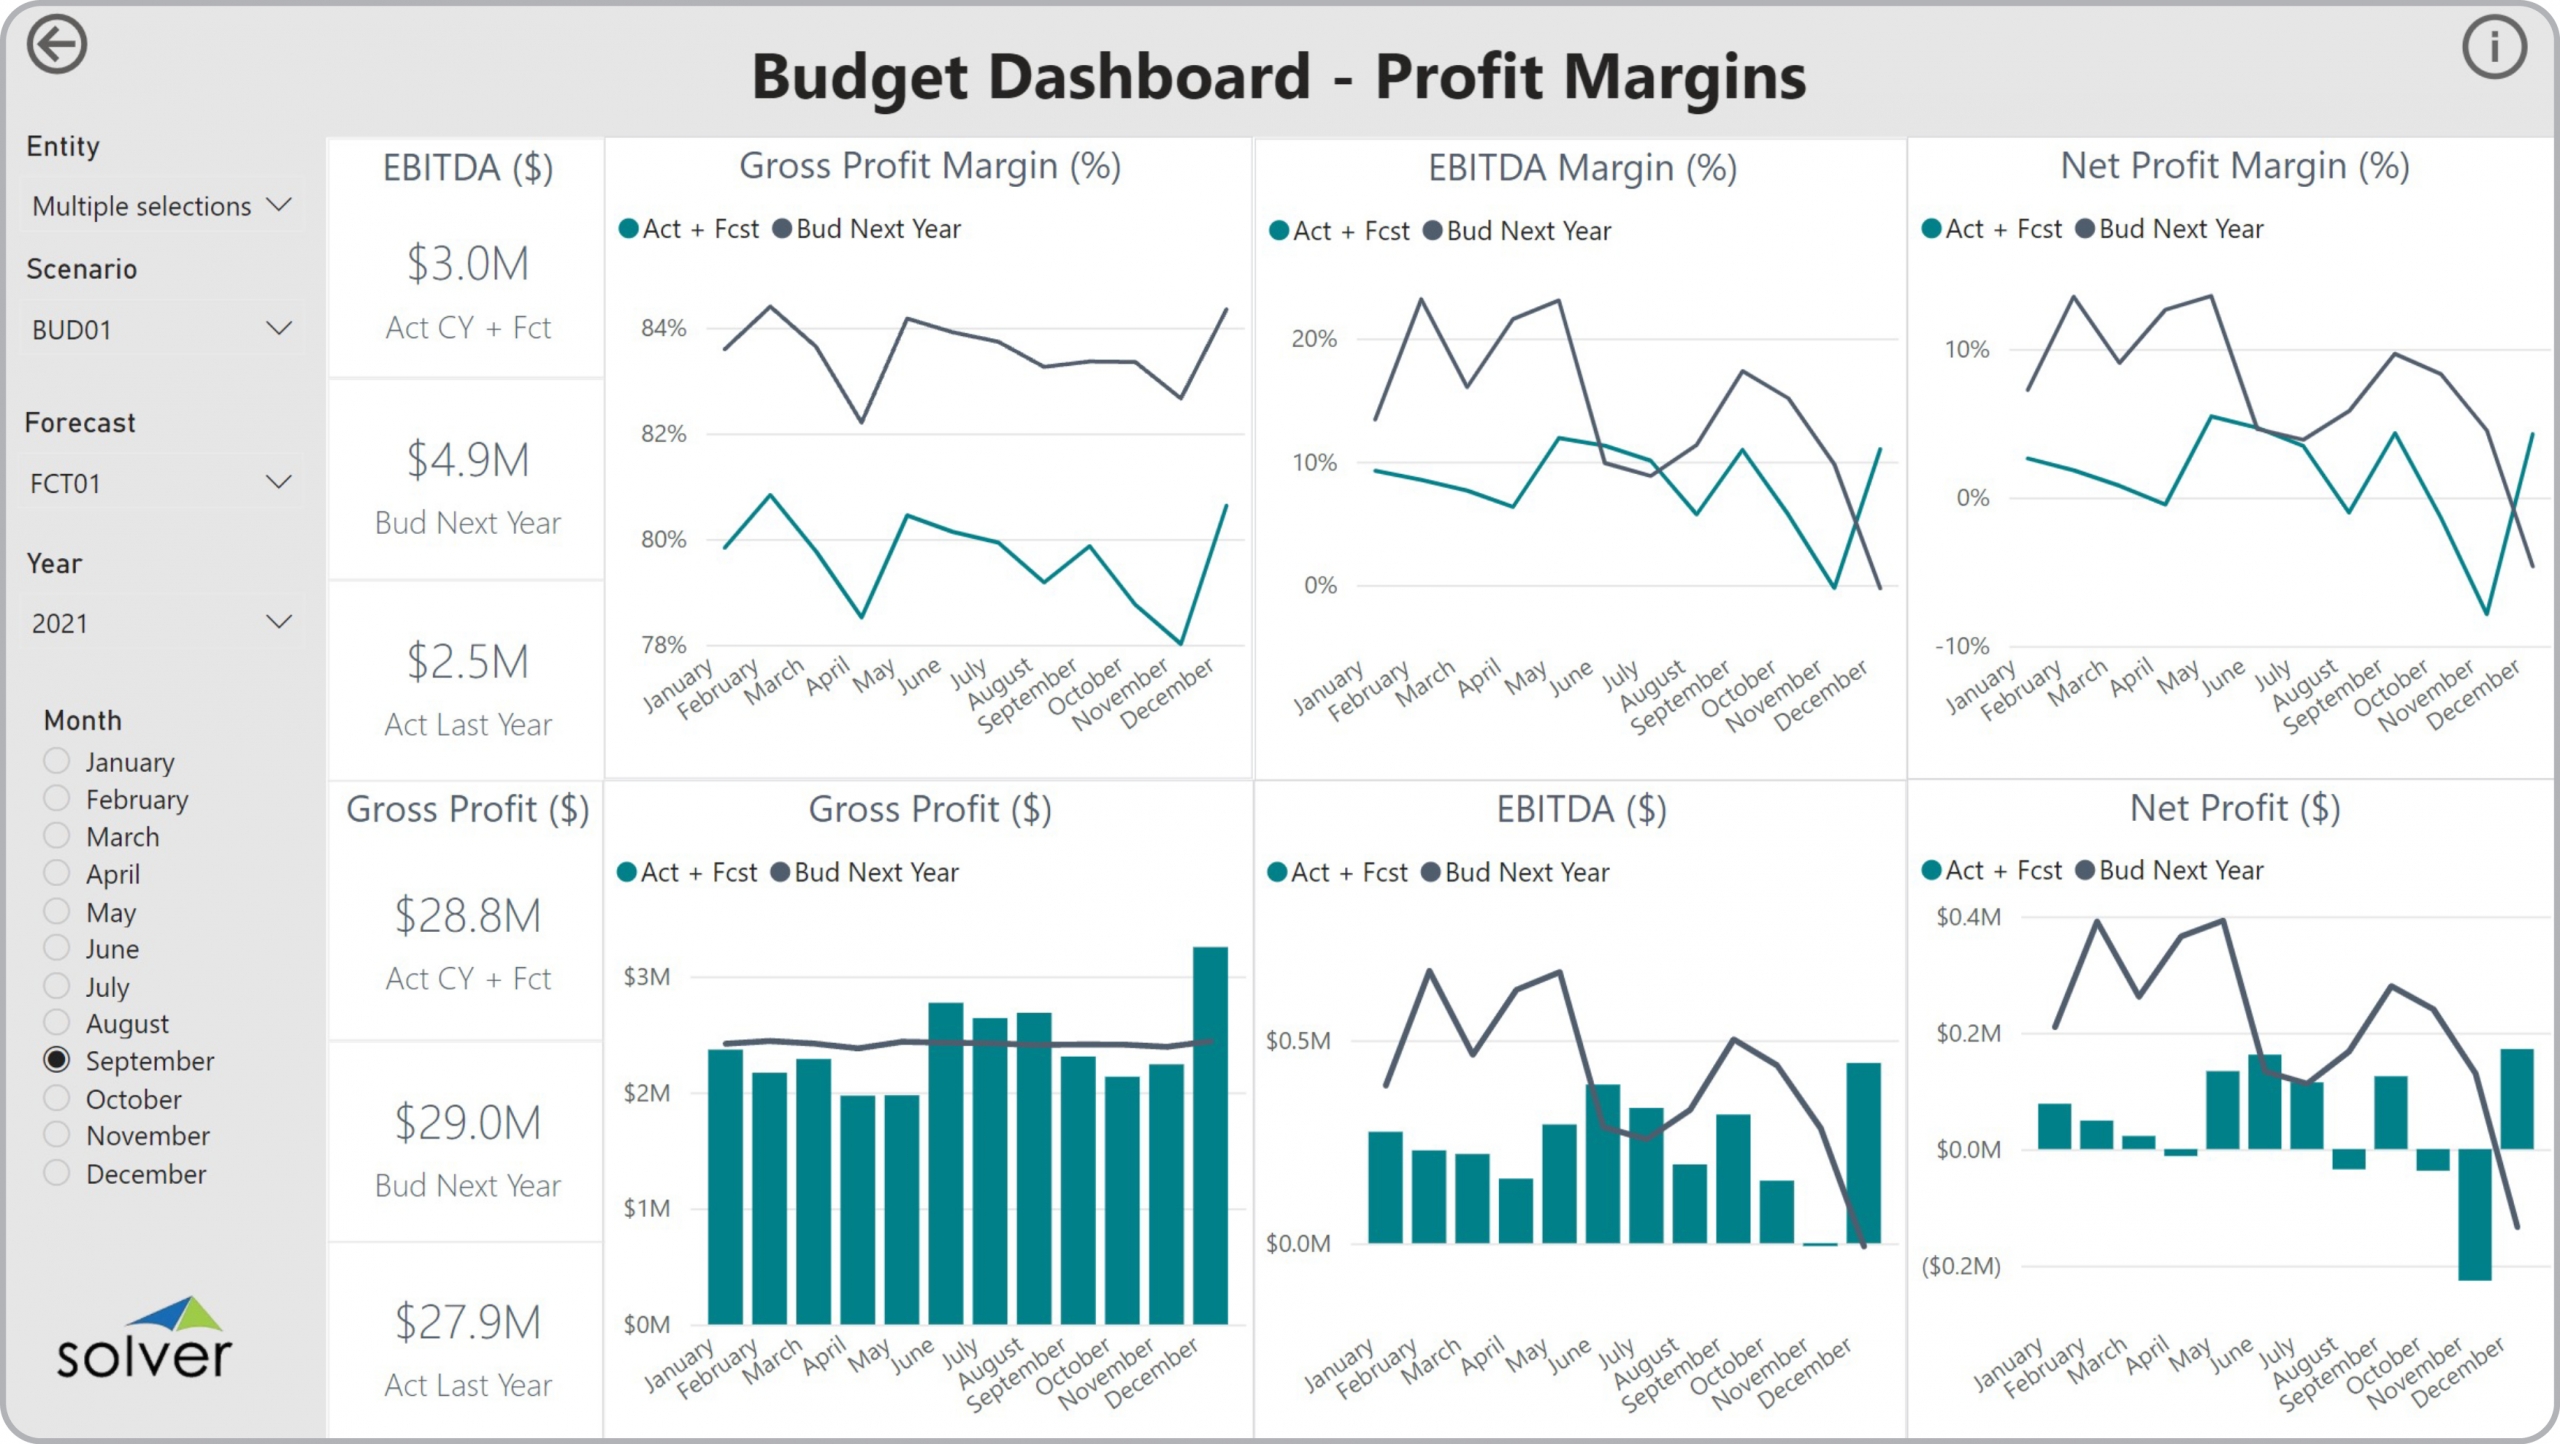
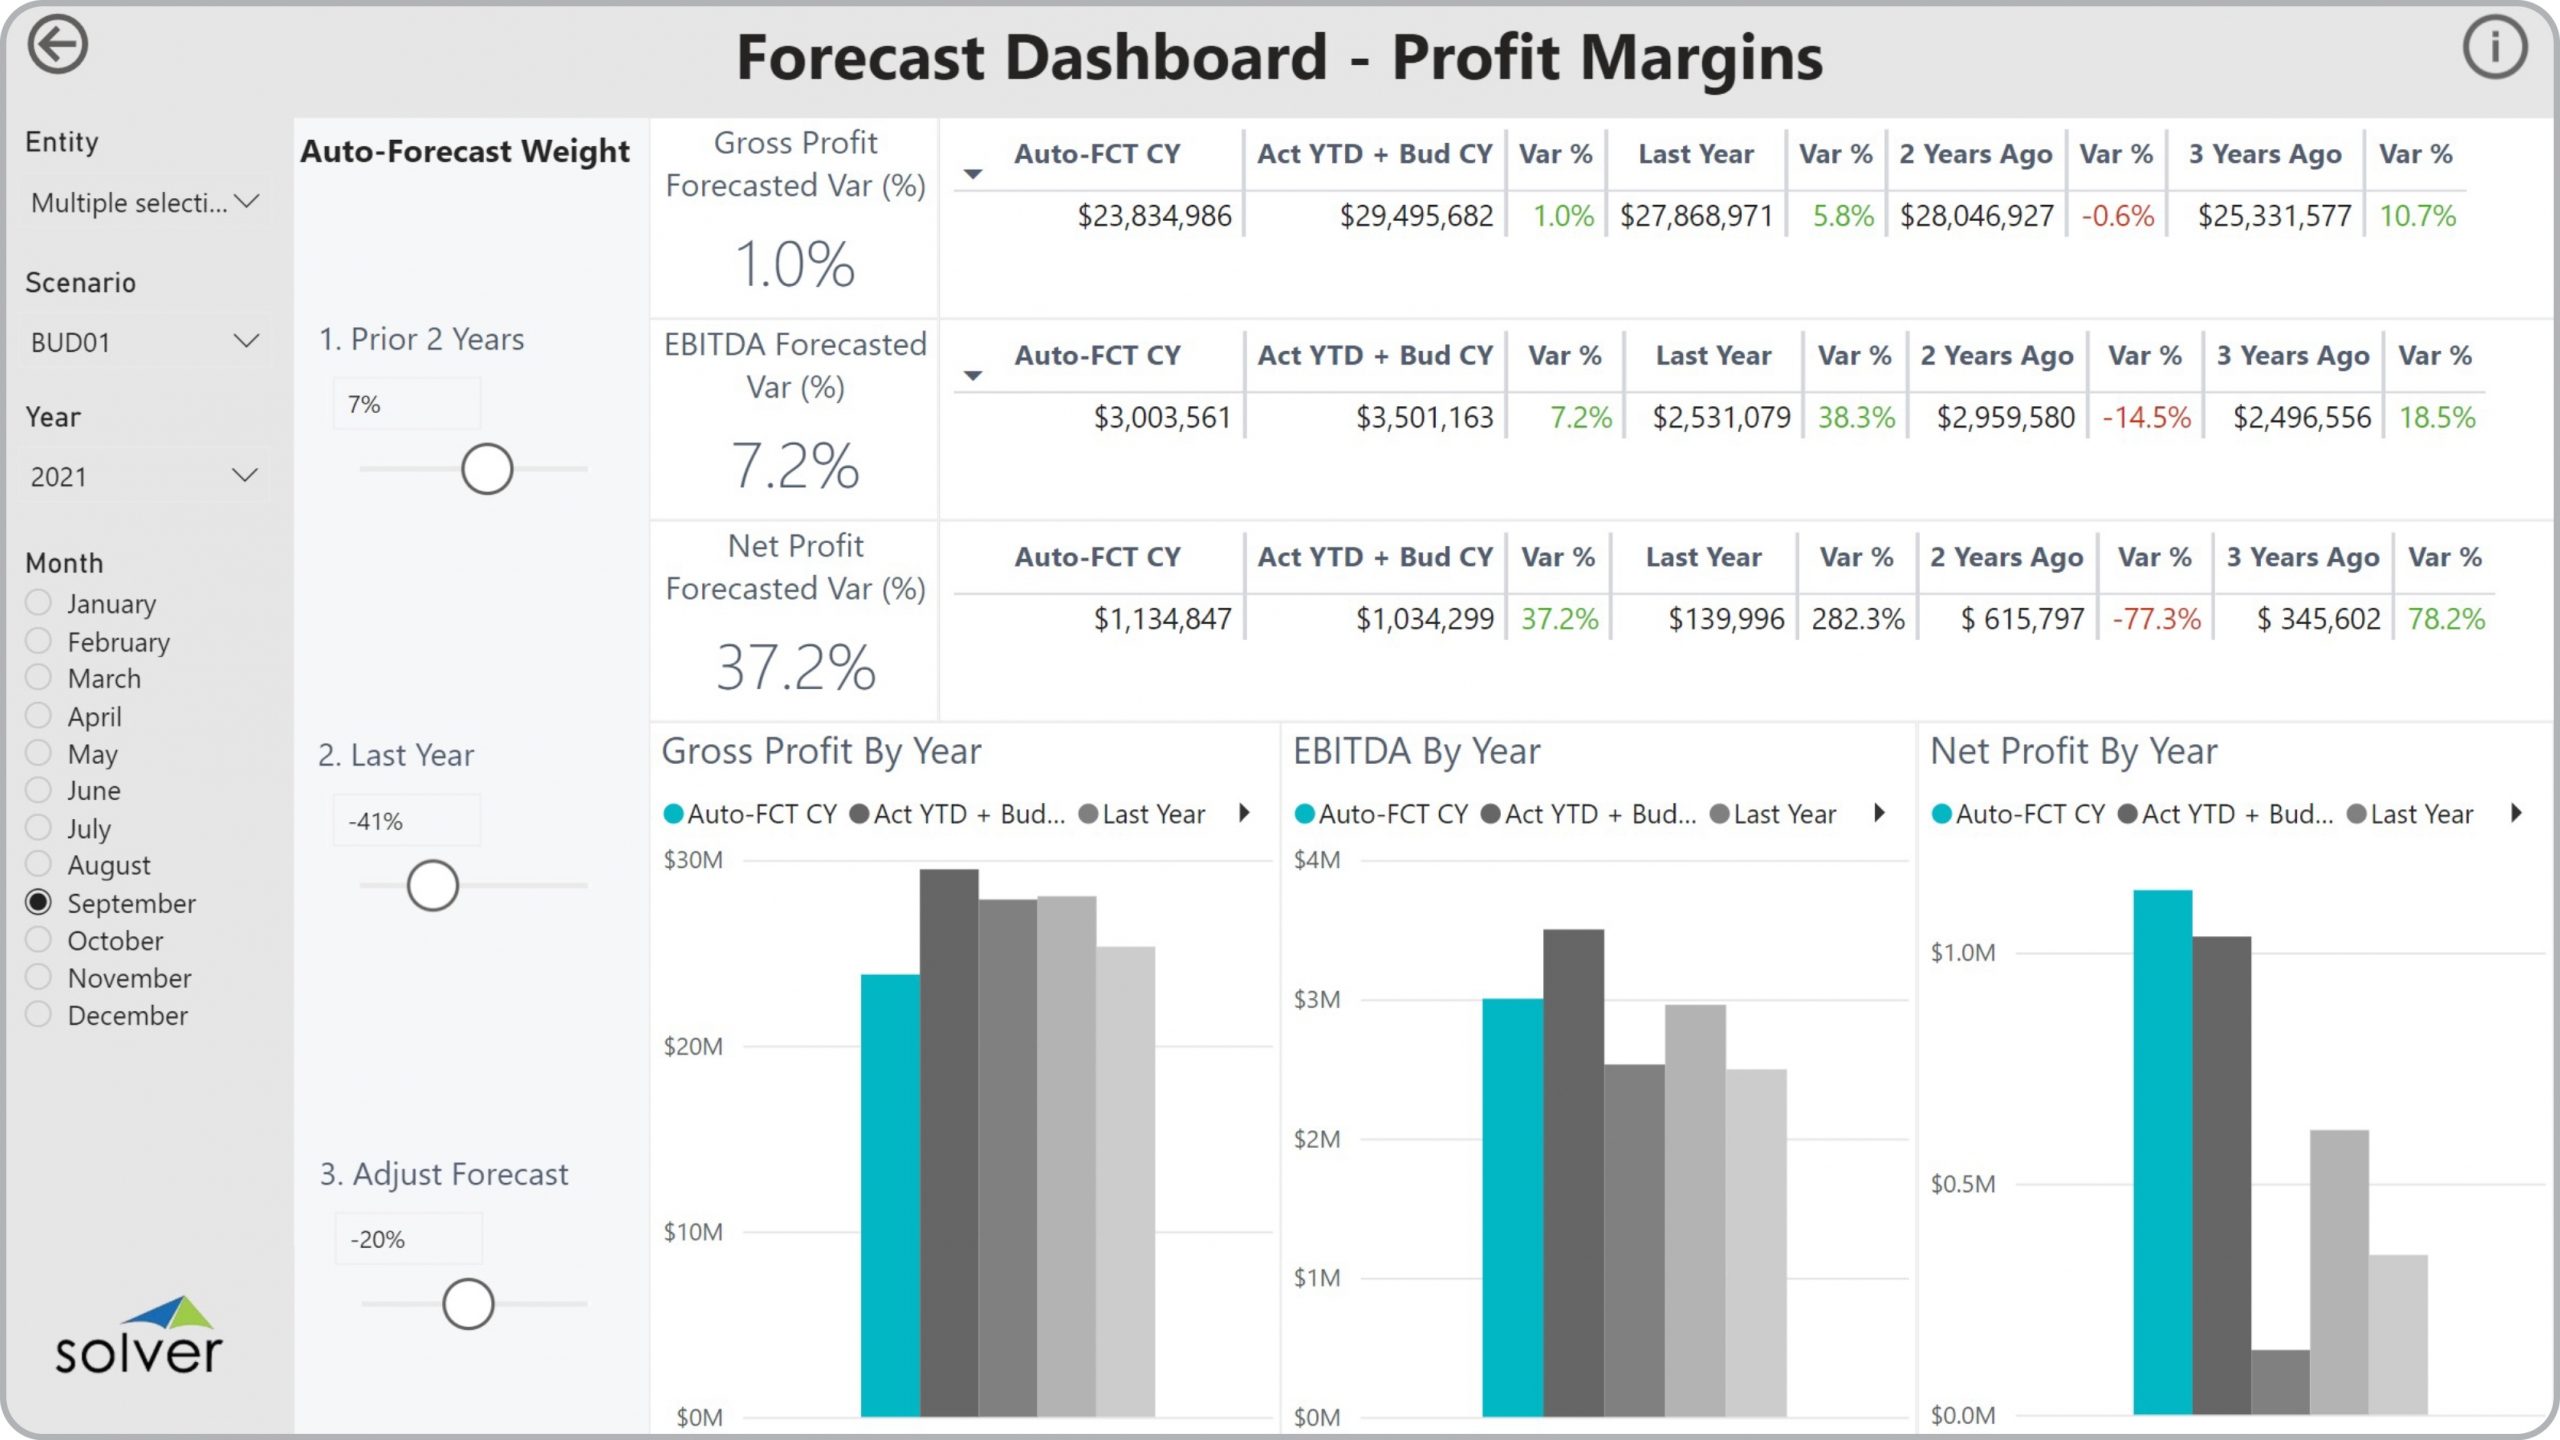
Using Profit Margin Budget Dashboards to Streamline the Planning Process
How can Budget Dashboard s Drive Faster and Better Decisions? As Budget Managers increasingly ...
Using Expense Simulation Dashboards to Streamline the Modelling and Forecasting Process
How can Simulation Dashboard s Drive Faster and Better Decisions? As FP&A Managers increasingly ...
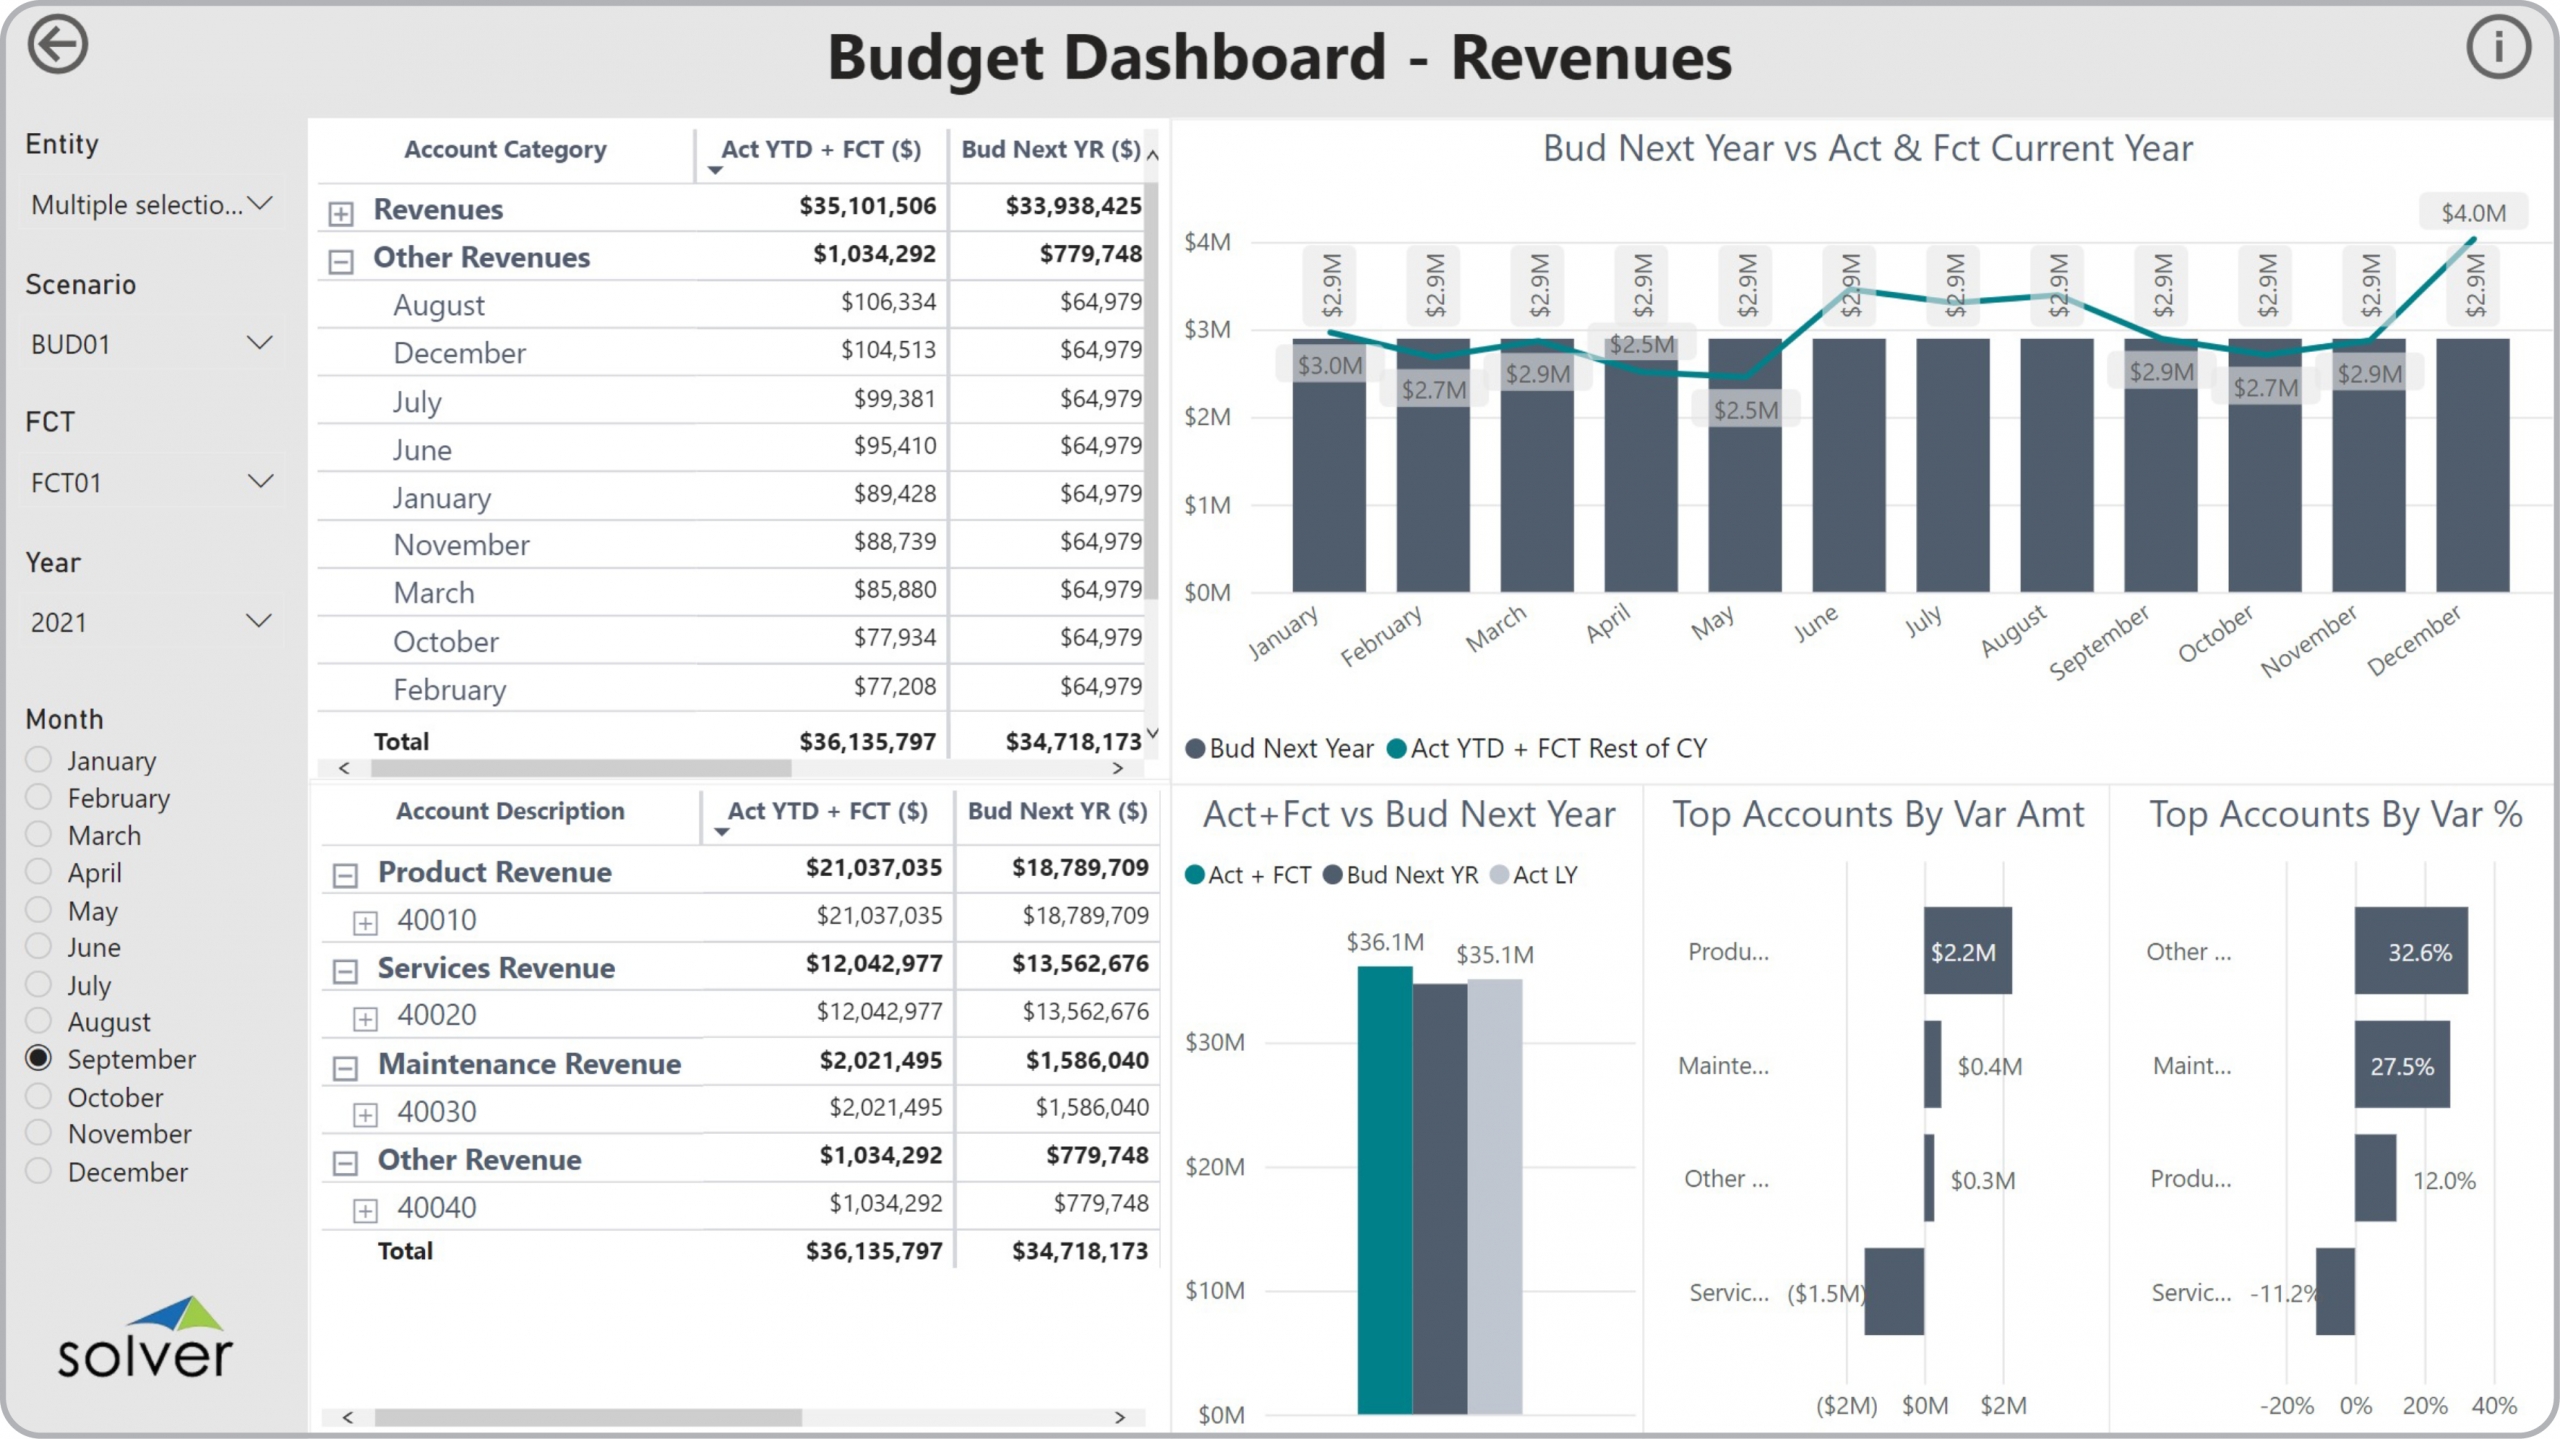
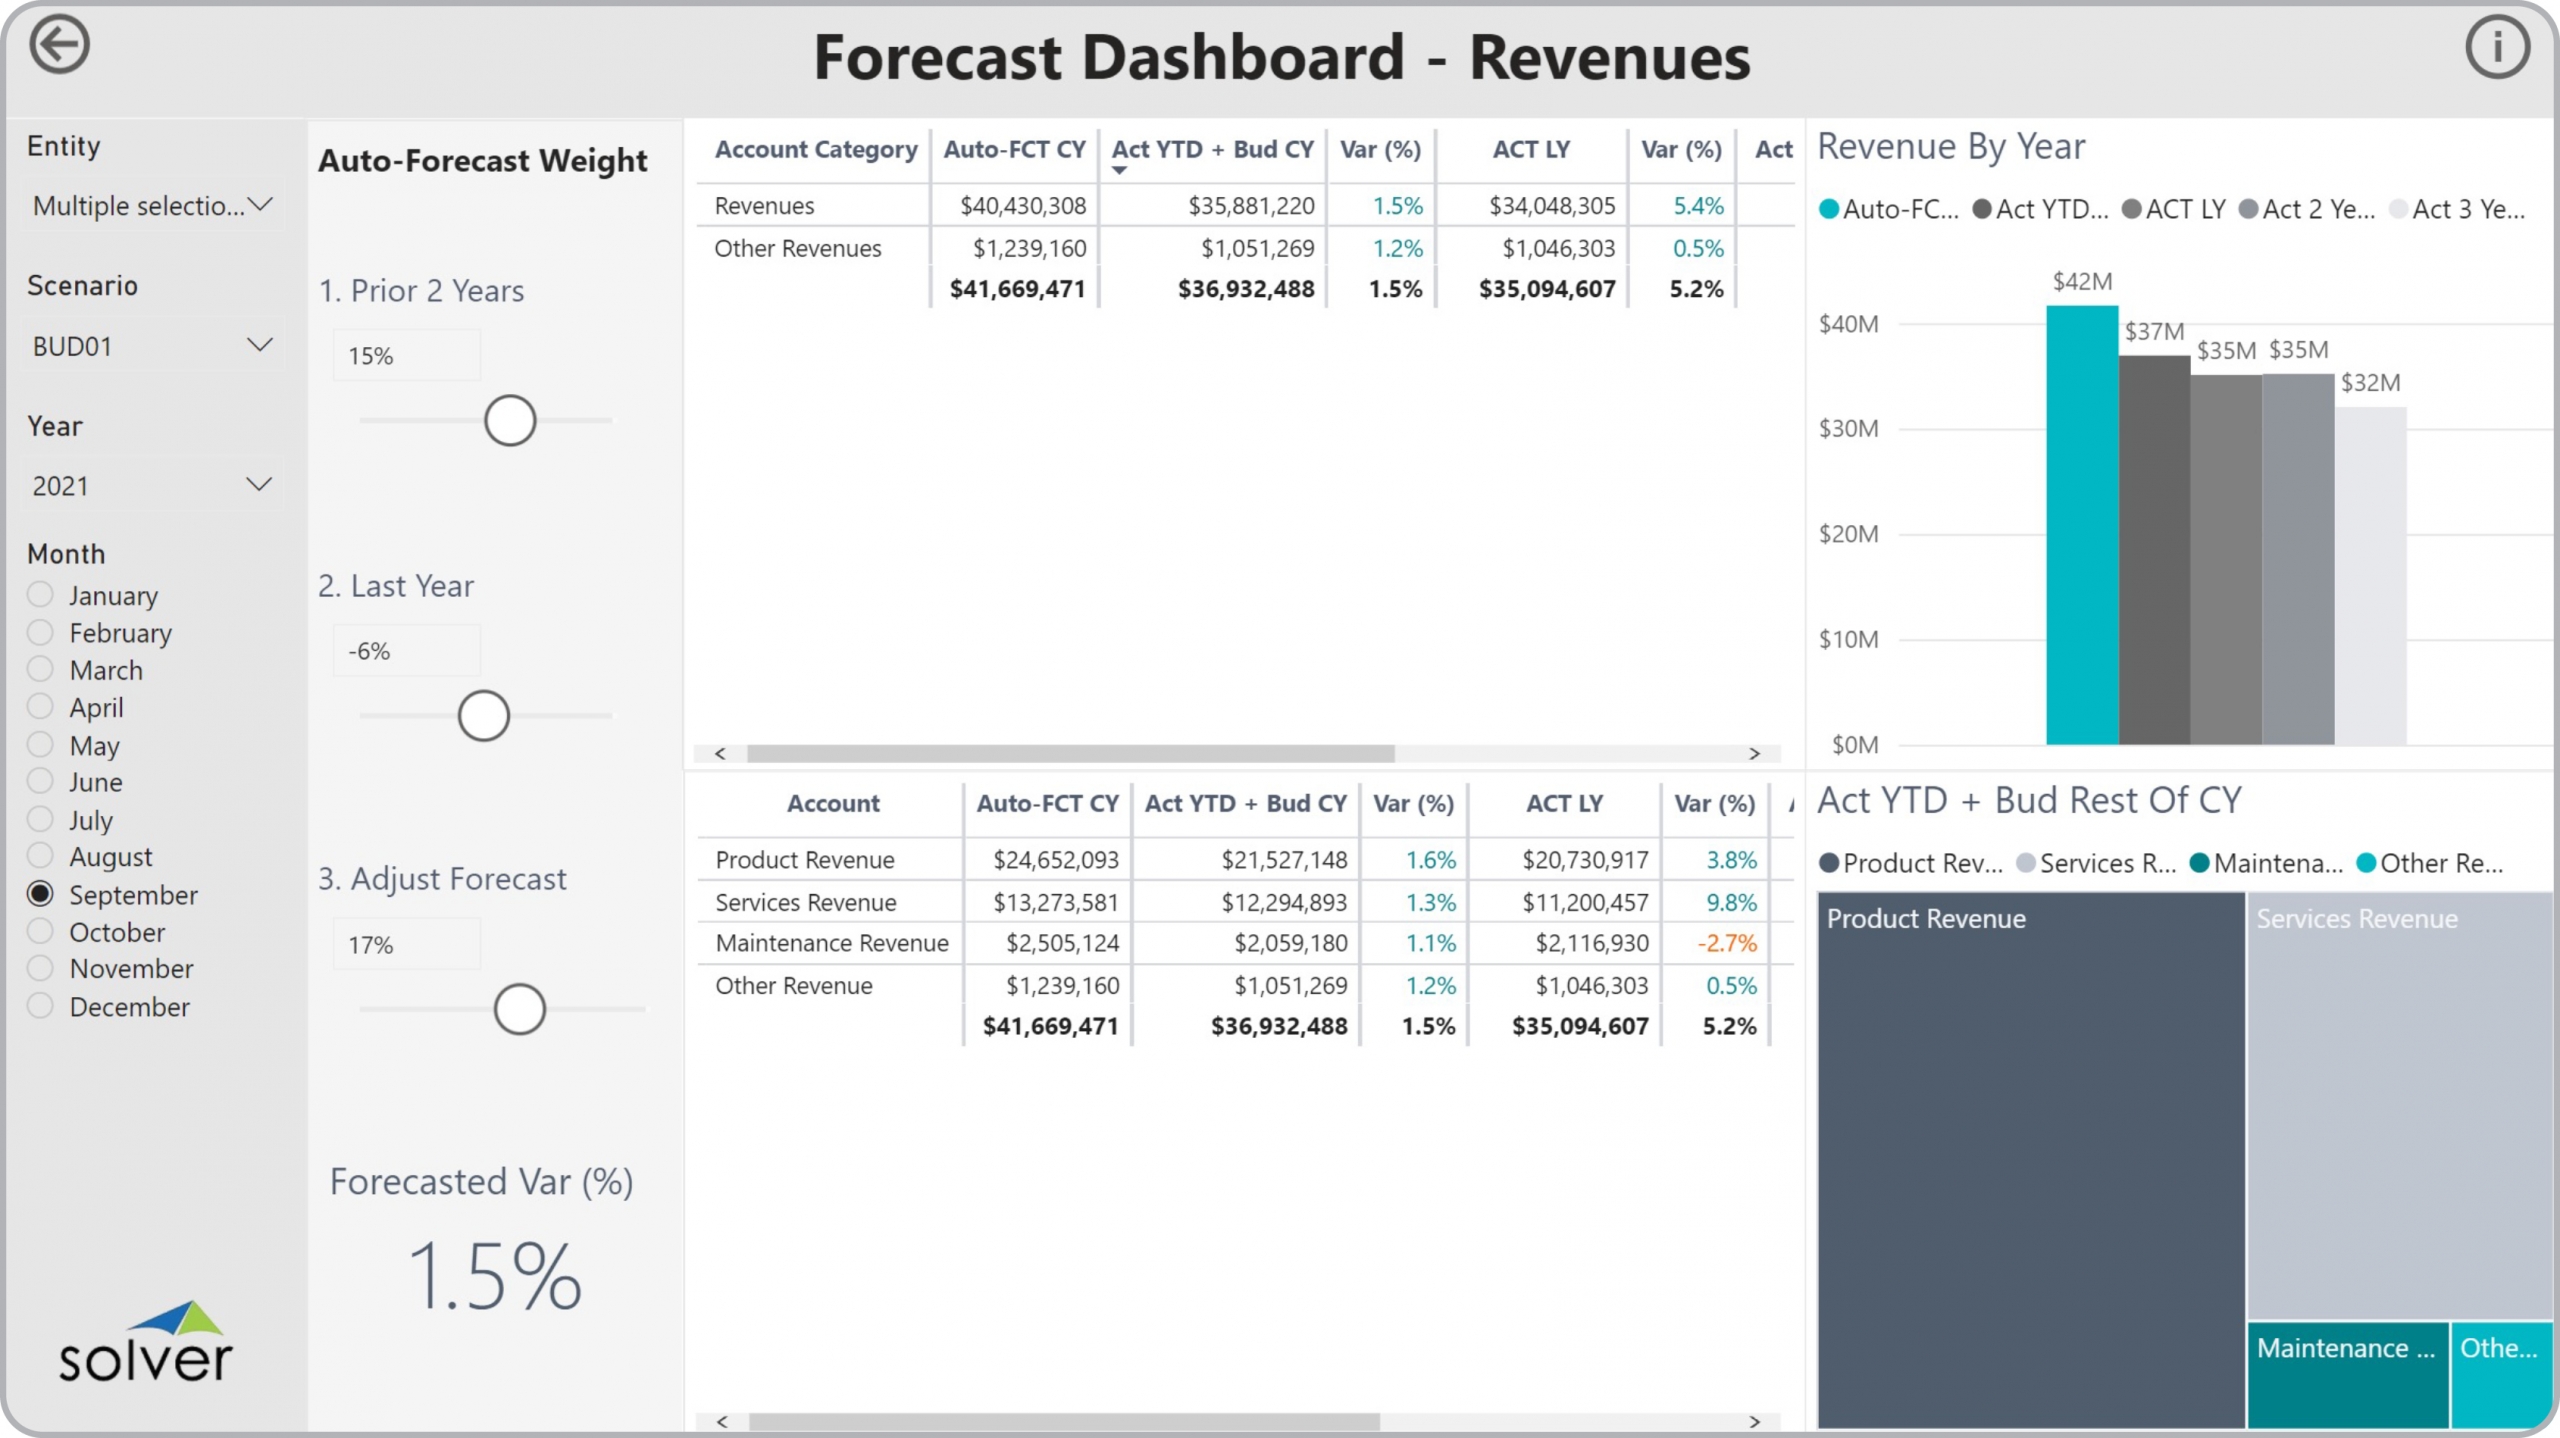
Using Revenue Budget Dashboards to Streamline the Planning Process
How can Budget Dashboard s Drive Faster and Better Decisions? As Budget Managers increasingly ...
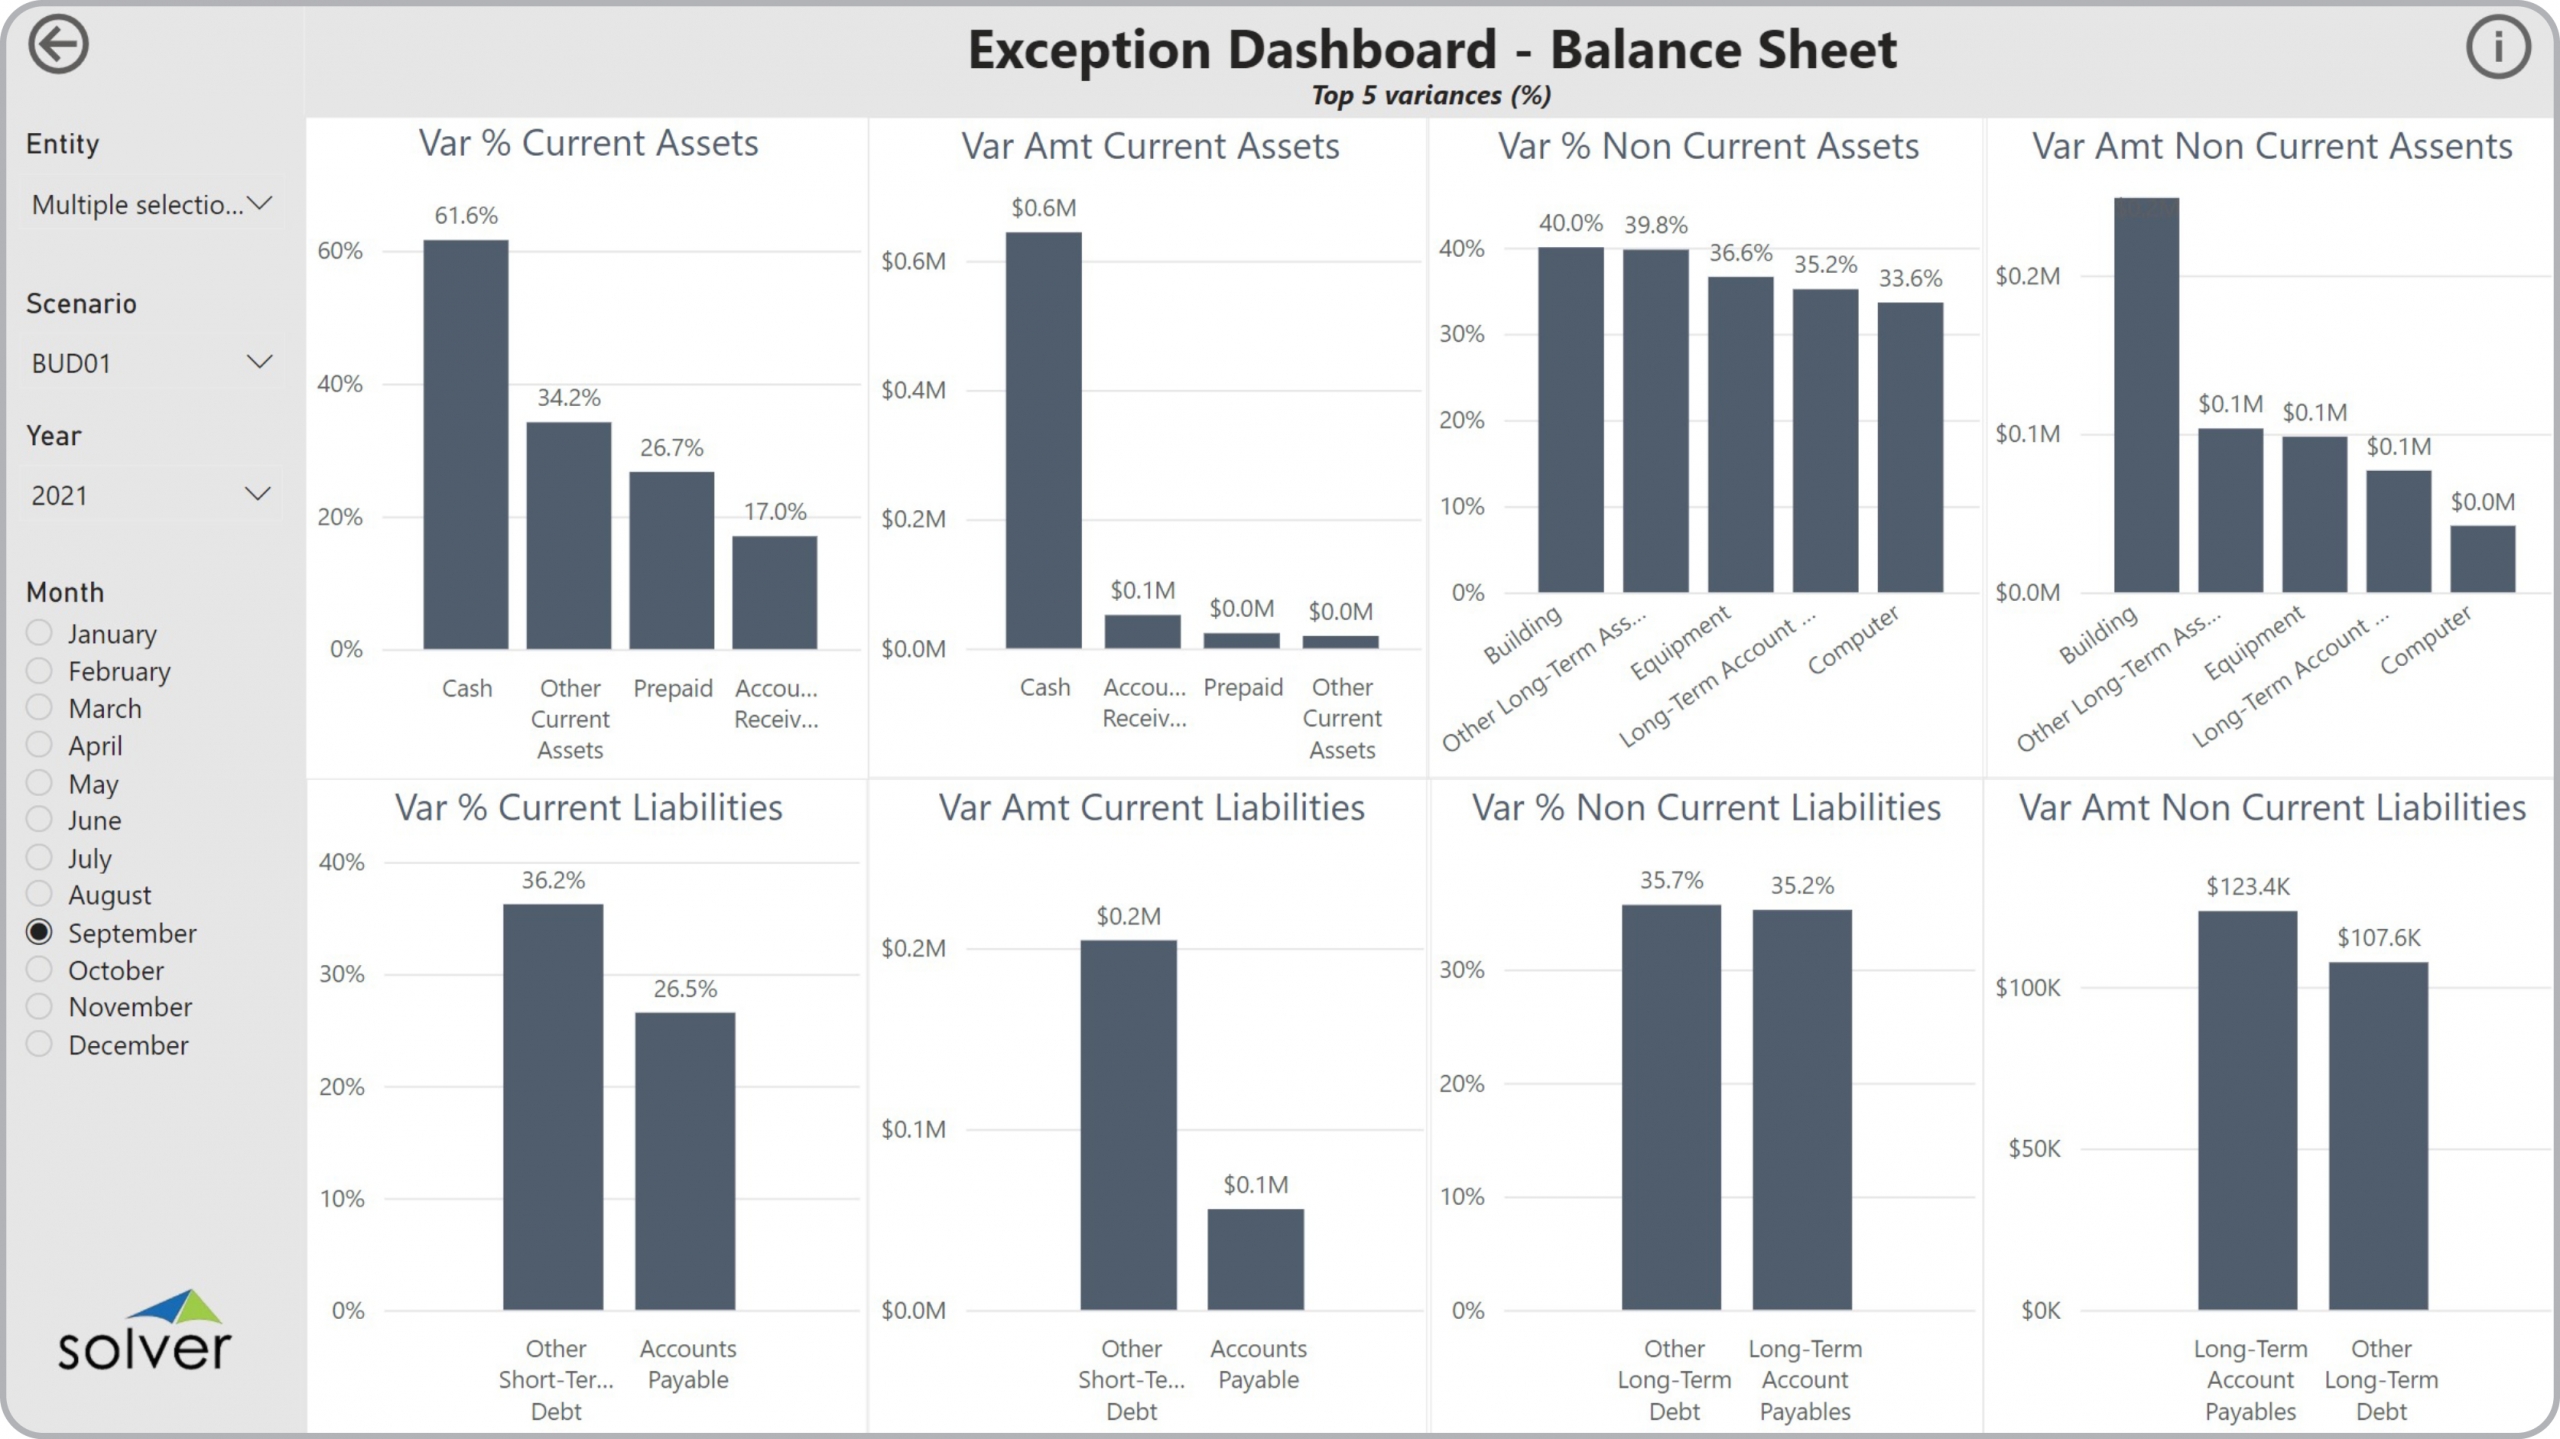
Using Balance Sheet Exception Dashboards to Streamline the Monthly Analysis Process
How can Financial Dashboard s Drive Faster and Better Decisions? As CFOs increasingly become key ...
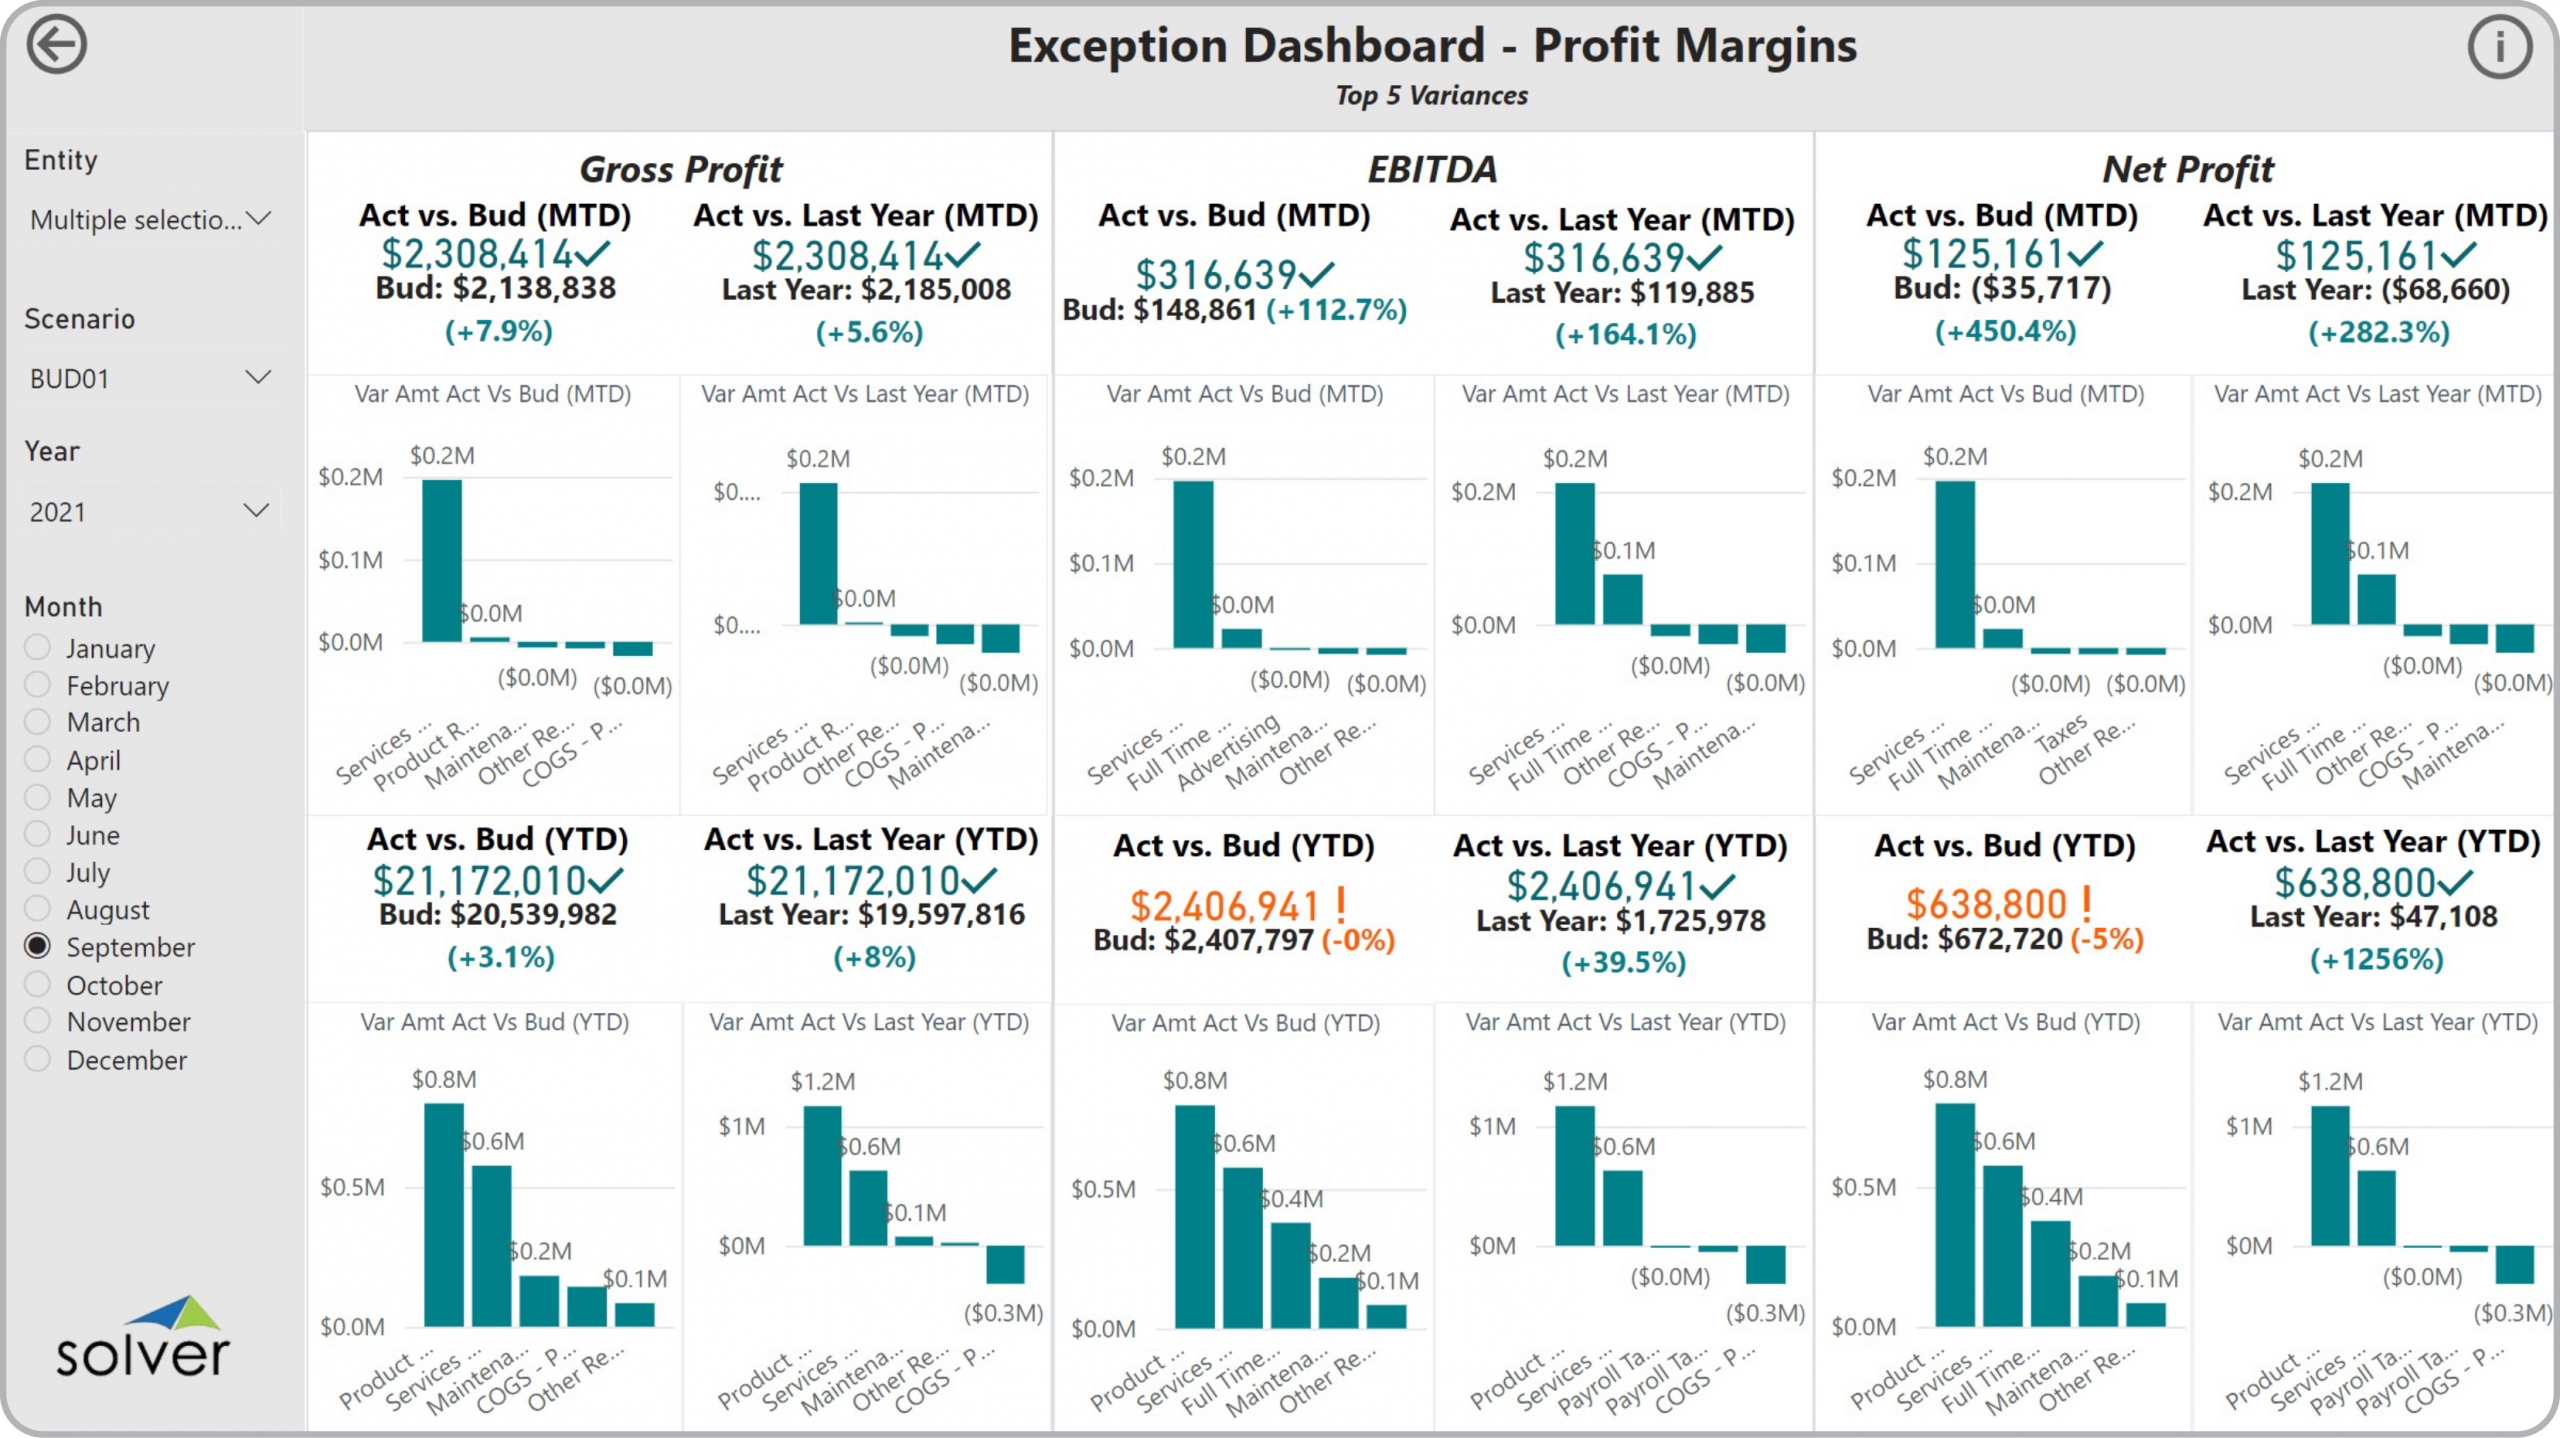
Using Profitability Exception Dashboards to Streamline the Monthly Analysis Process
How can Financial Dashboard s Drive Faster and Better Decisions? As CFOs increasingly become key ...
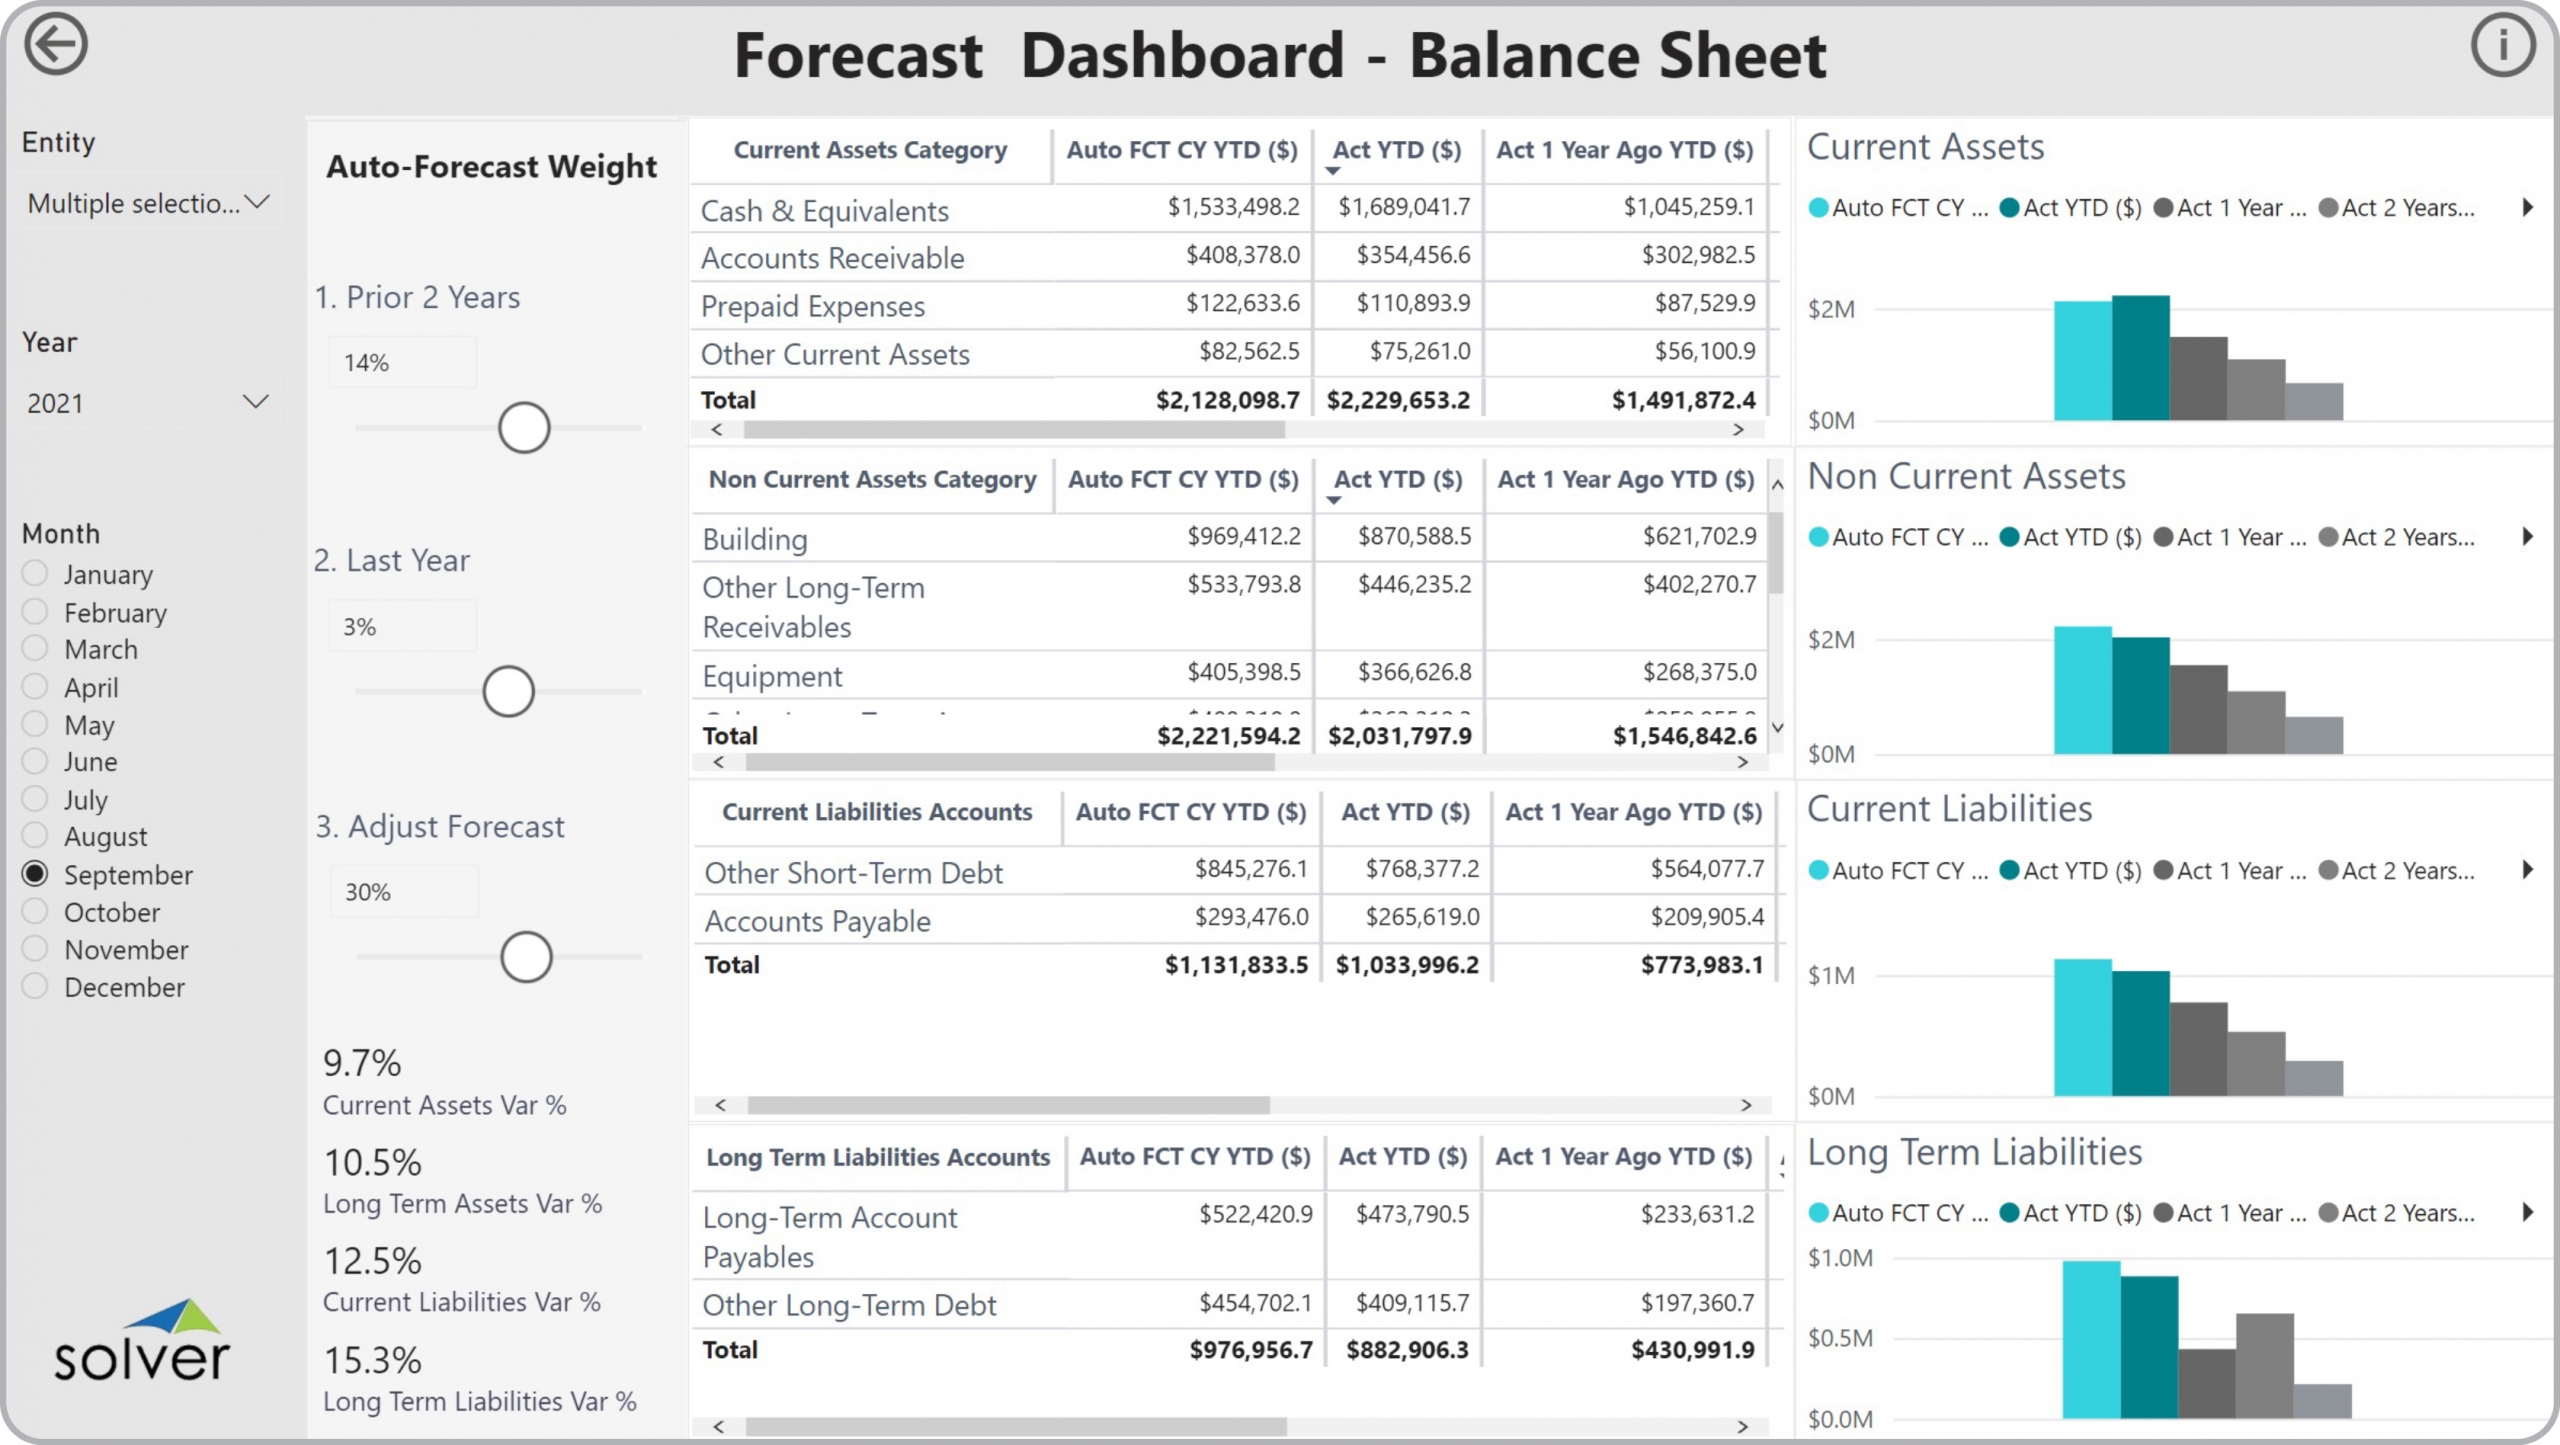
Using Balance Sheet Simulation Dashboards to Streamline the Modelling and Forecasting Process
How can Simulation Dashboard s Drive Faster and Better Decisions? As FP&A Managers increasingly ...
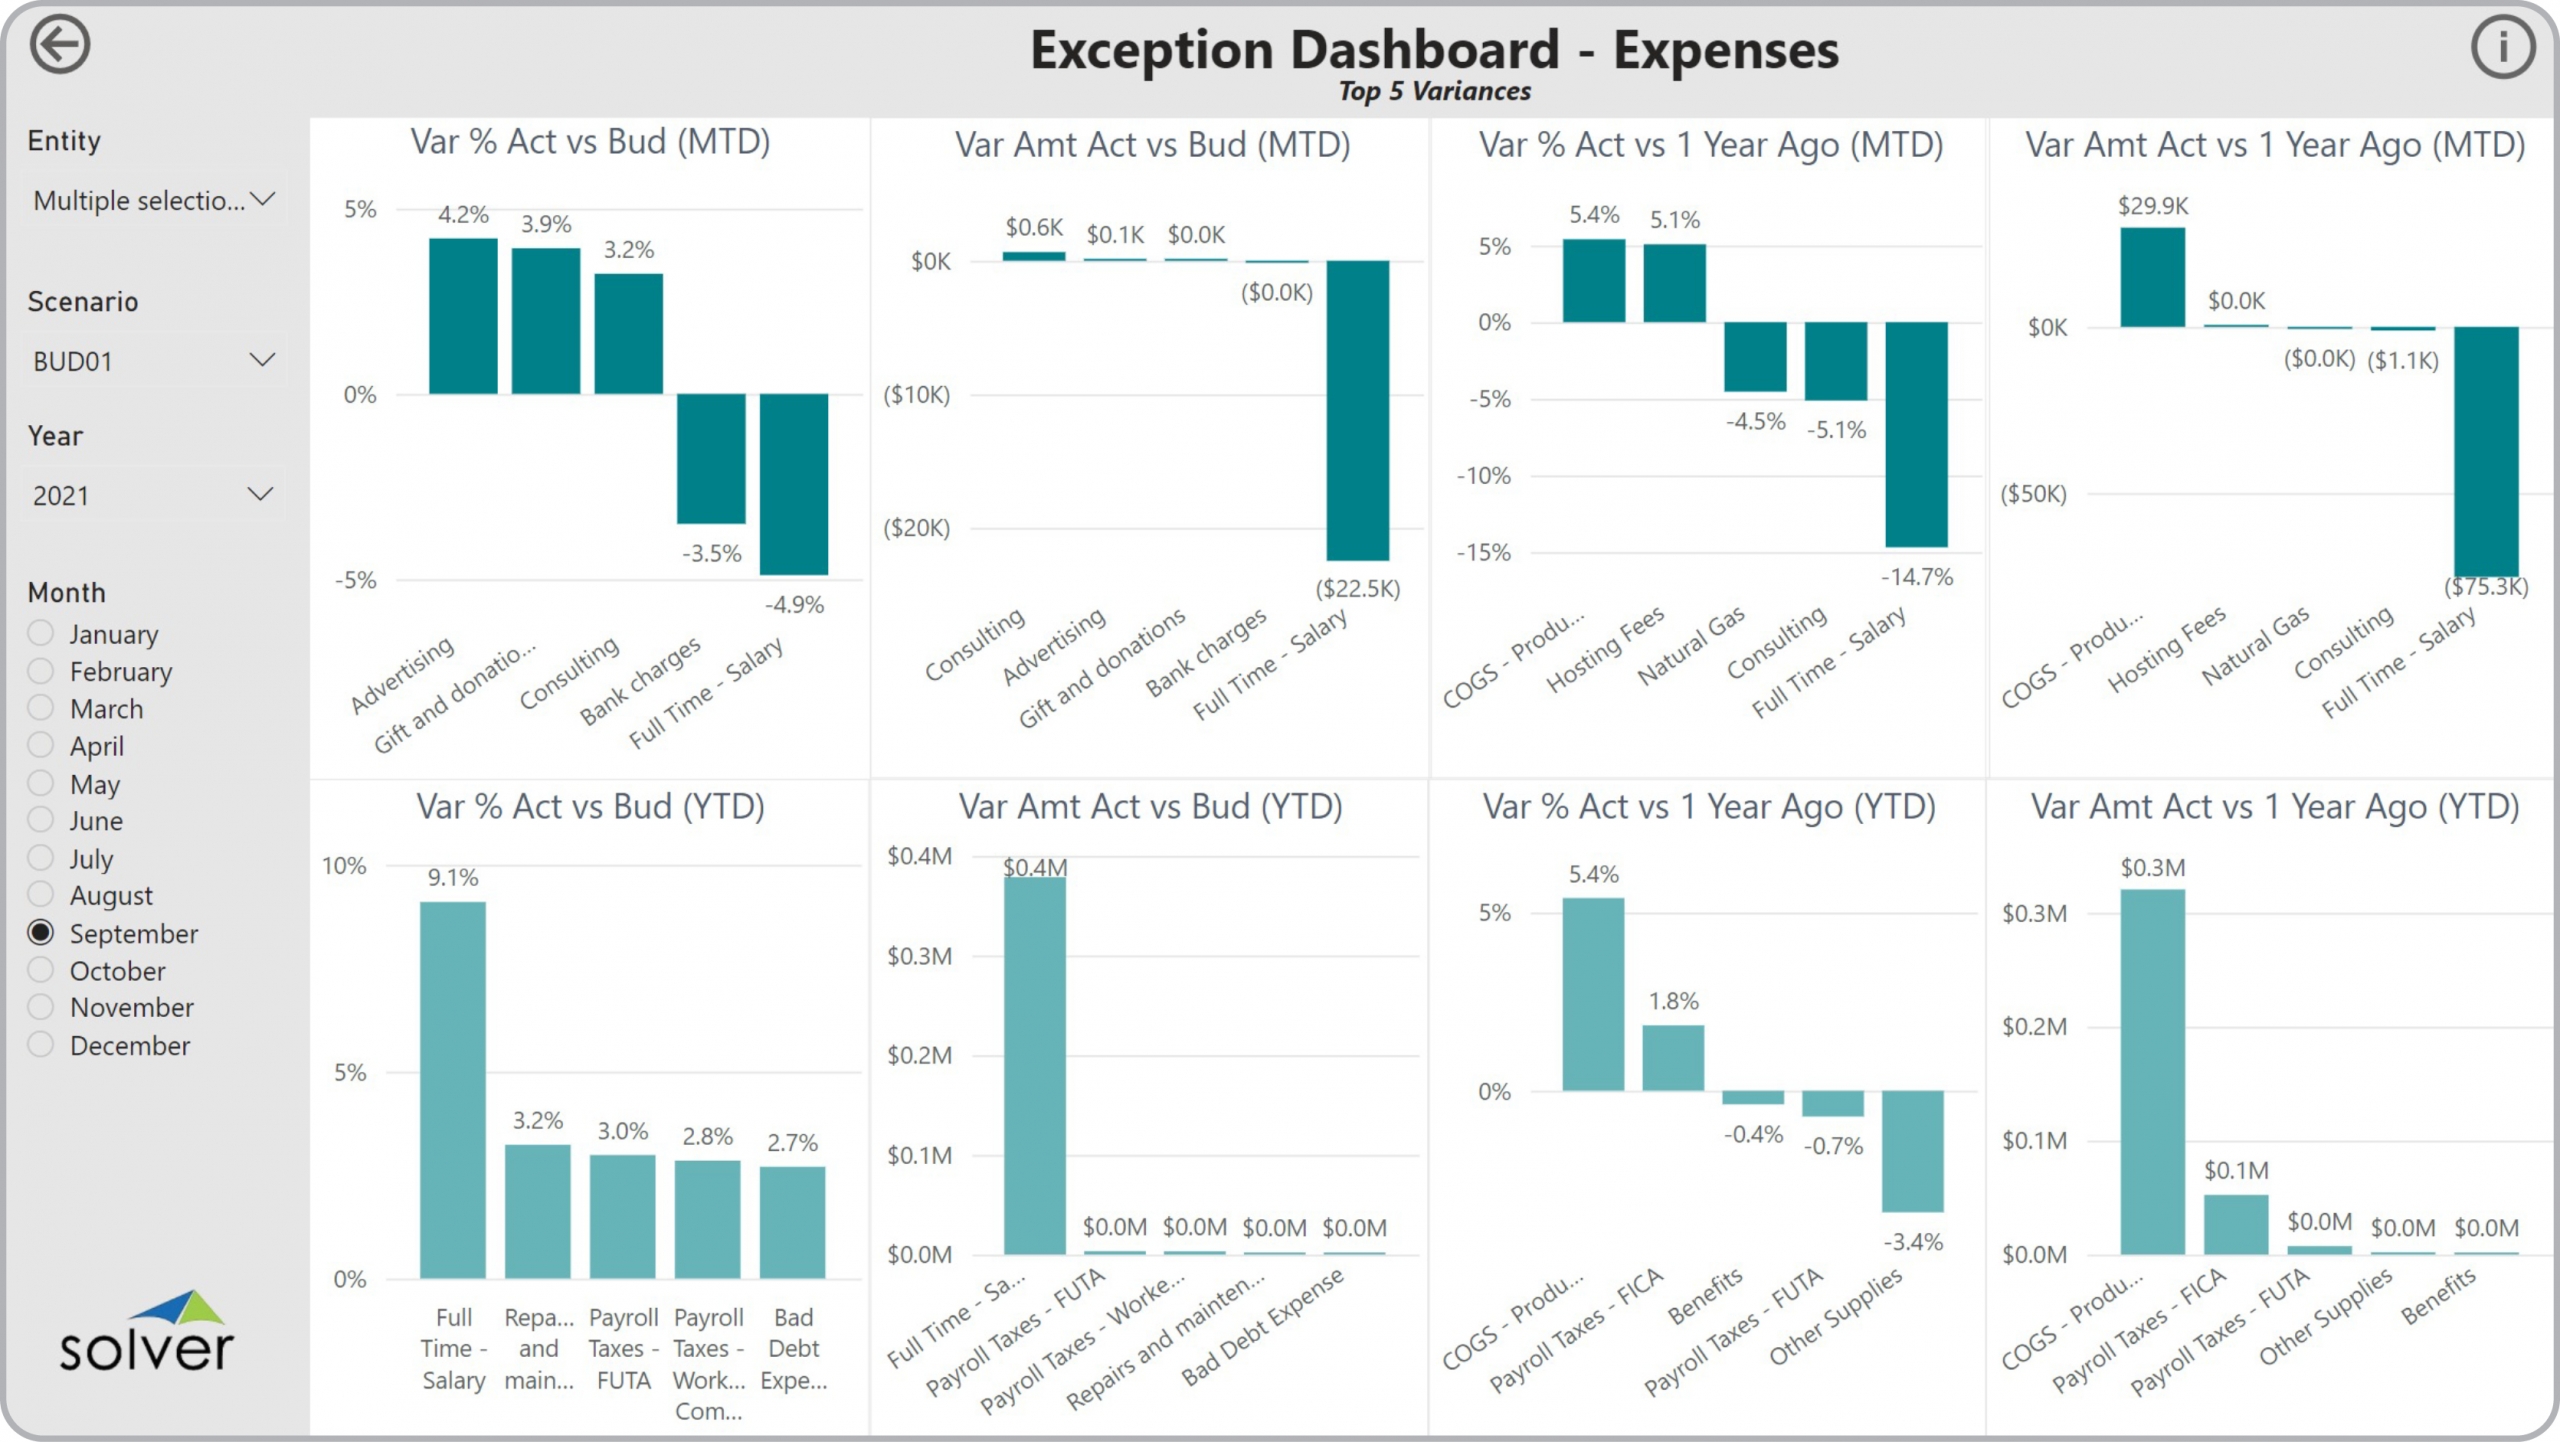
Using Expense Exception Dashboards to Streamline the Monthly Analysis Process
How can Financial Dashboard s Drive Faster and Better Decisions? As CFOs increasingly become key ...
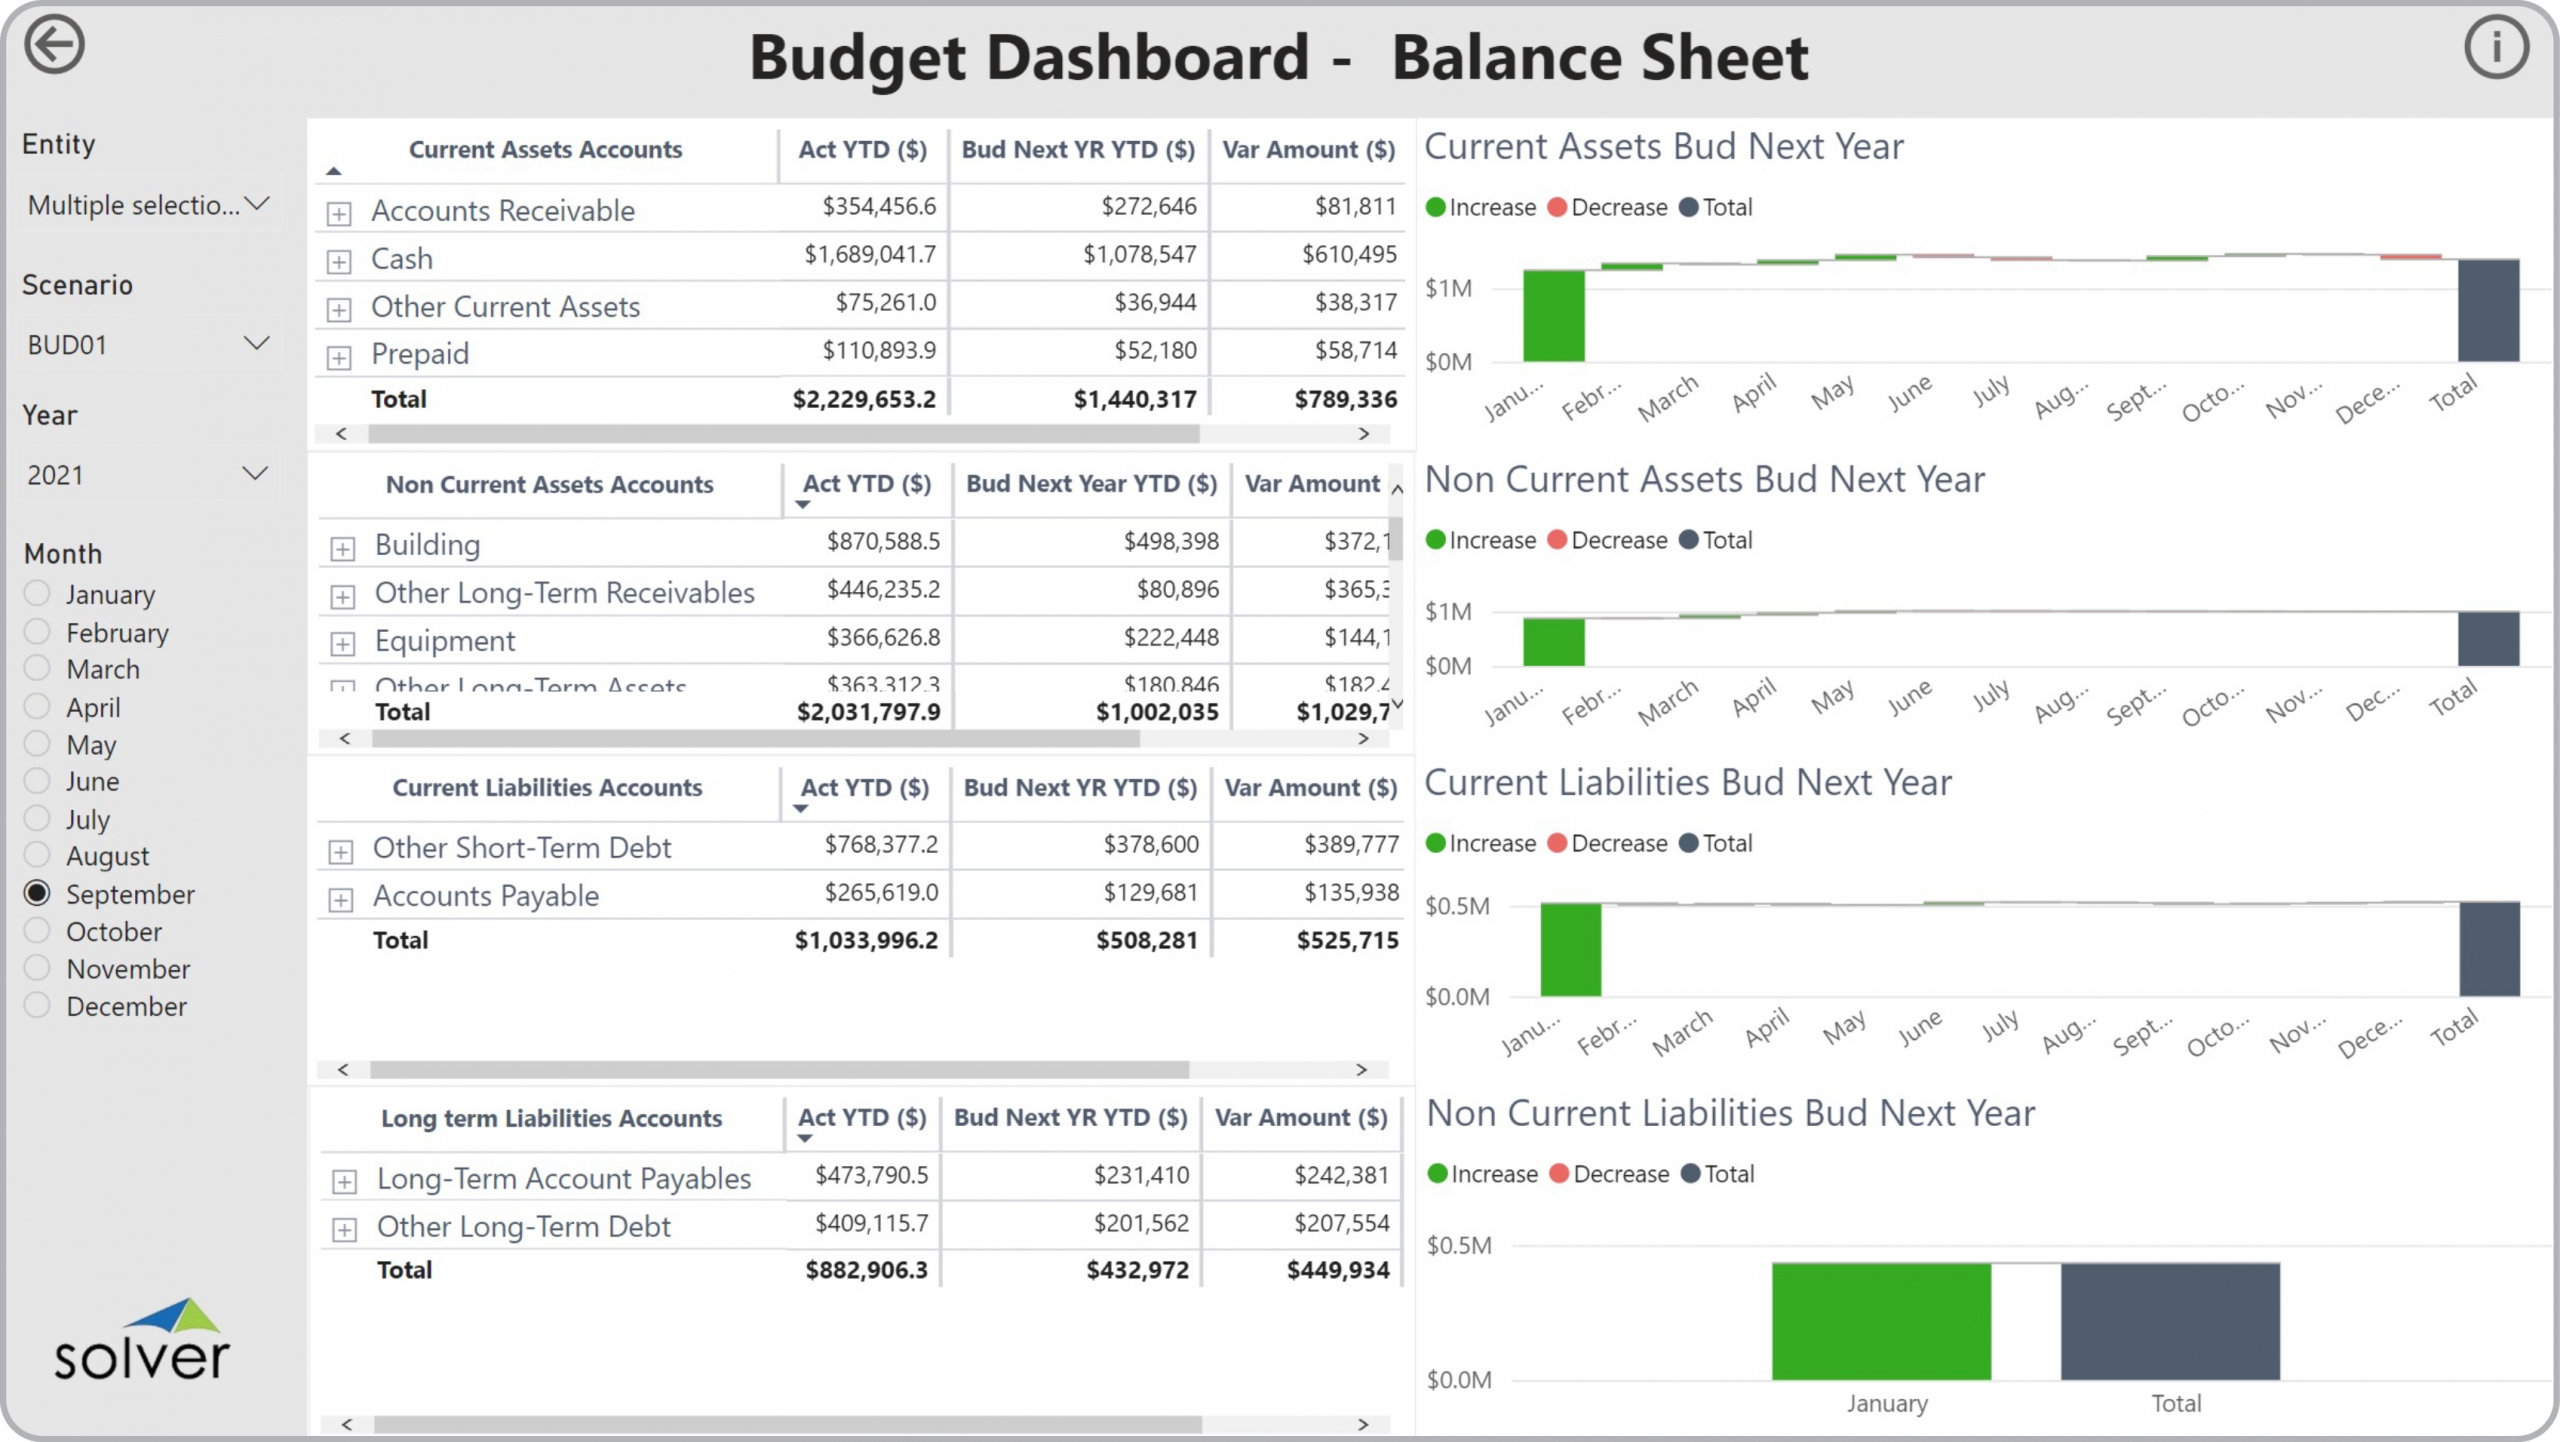
Using Balance Sheet Budget Dashboards to Streamline the Planning Process
How can Budget Dashboard s Drive Faster and Better Decisions? As Budget Managers increasingly ...
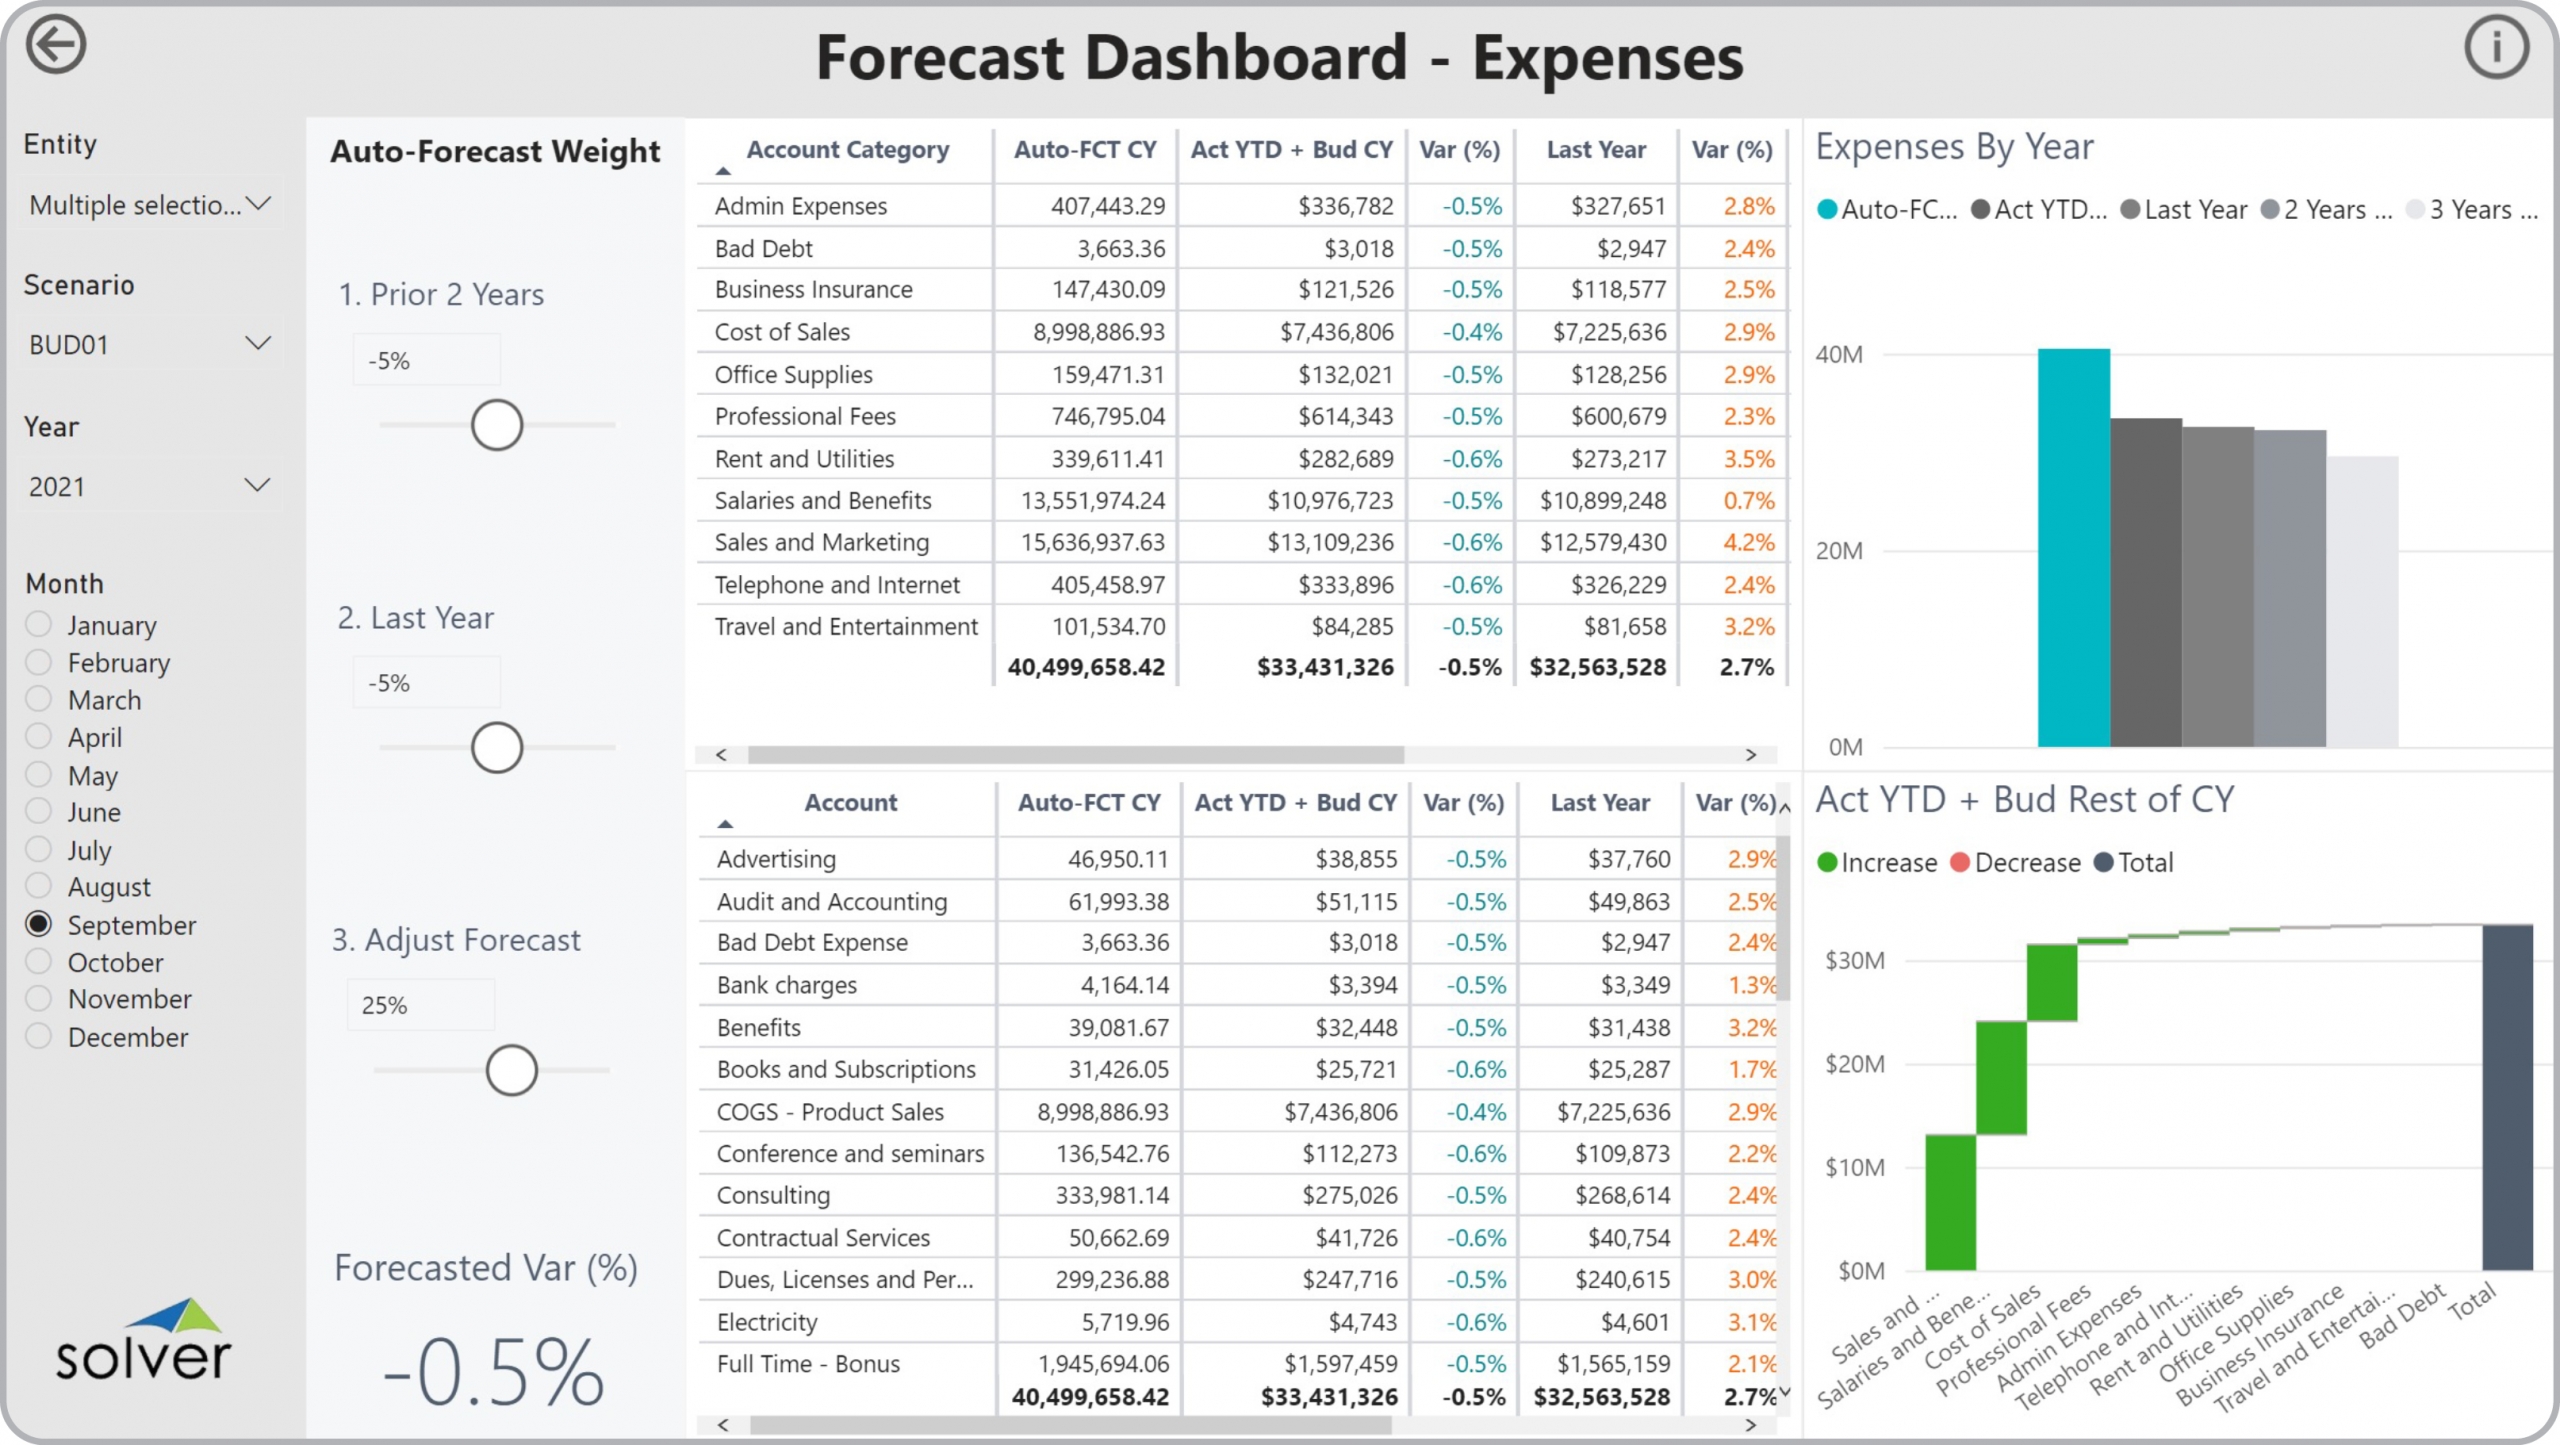
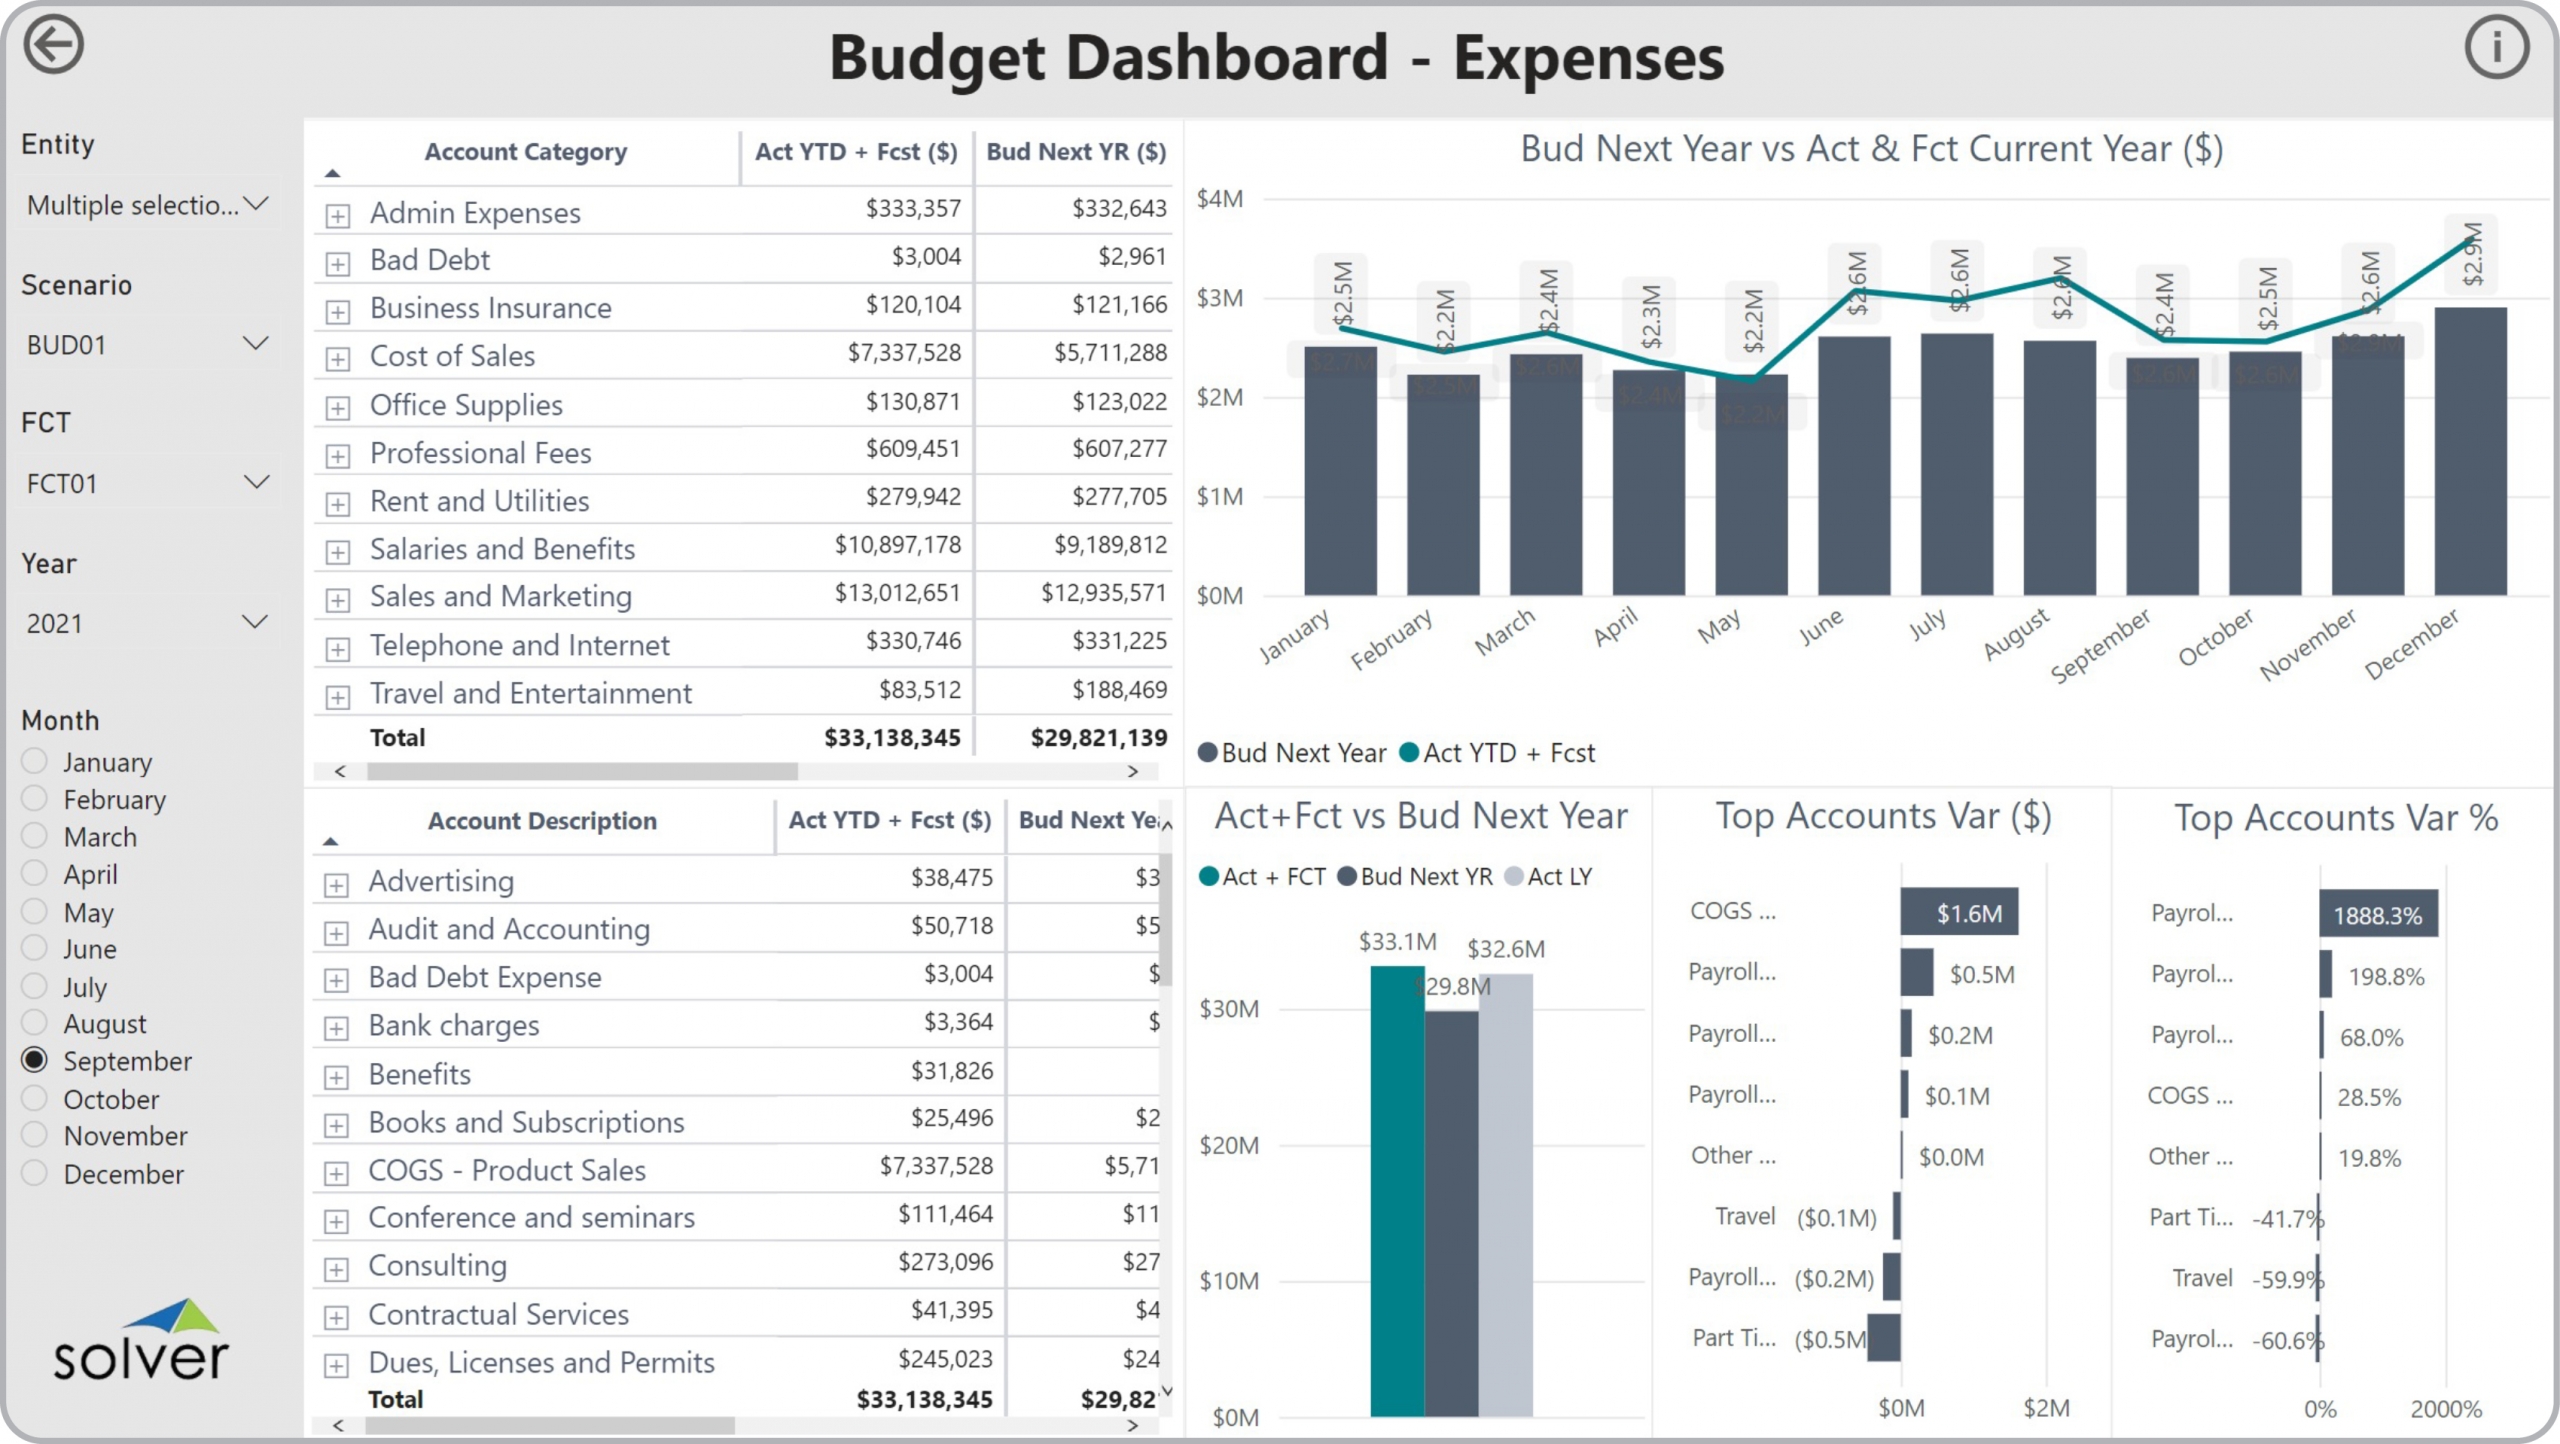
Using Expense Budget Dashboards to Streamline the Planning Process
How can Budget Dashboard s Drive Faster and Better Decisions? As Budget Managers increasingly ...
Using Revenue Simulation Dashboards to Streamline the Modelling and Forecasting Process
How can Simulation Dashboard s Drive Faster and Better Decisions? As FP&A Managers increasingly ...
Using Revenue Dashboards with Trends and Variances to Streamline the Monthly Reporting Process
How can Financial Dashboard s Drive Faster and Better Decisions? As CFOs increasingly become ...
Using Profit Simulation Dashboards to Streamline the Modelling and Forecasting Process
How can Simulation Dashboard s Drive Faster and Better Decisions? As FP&A Managers increasingly ...
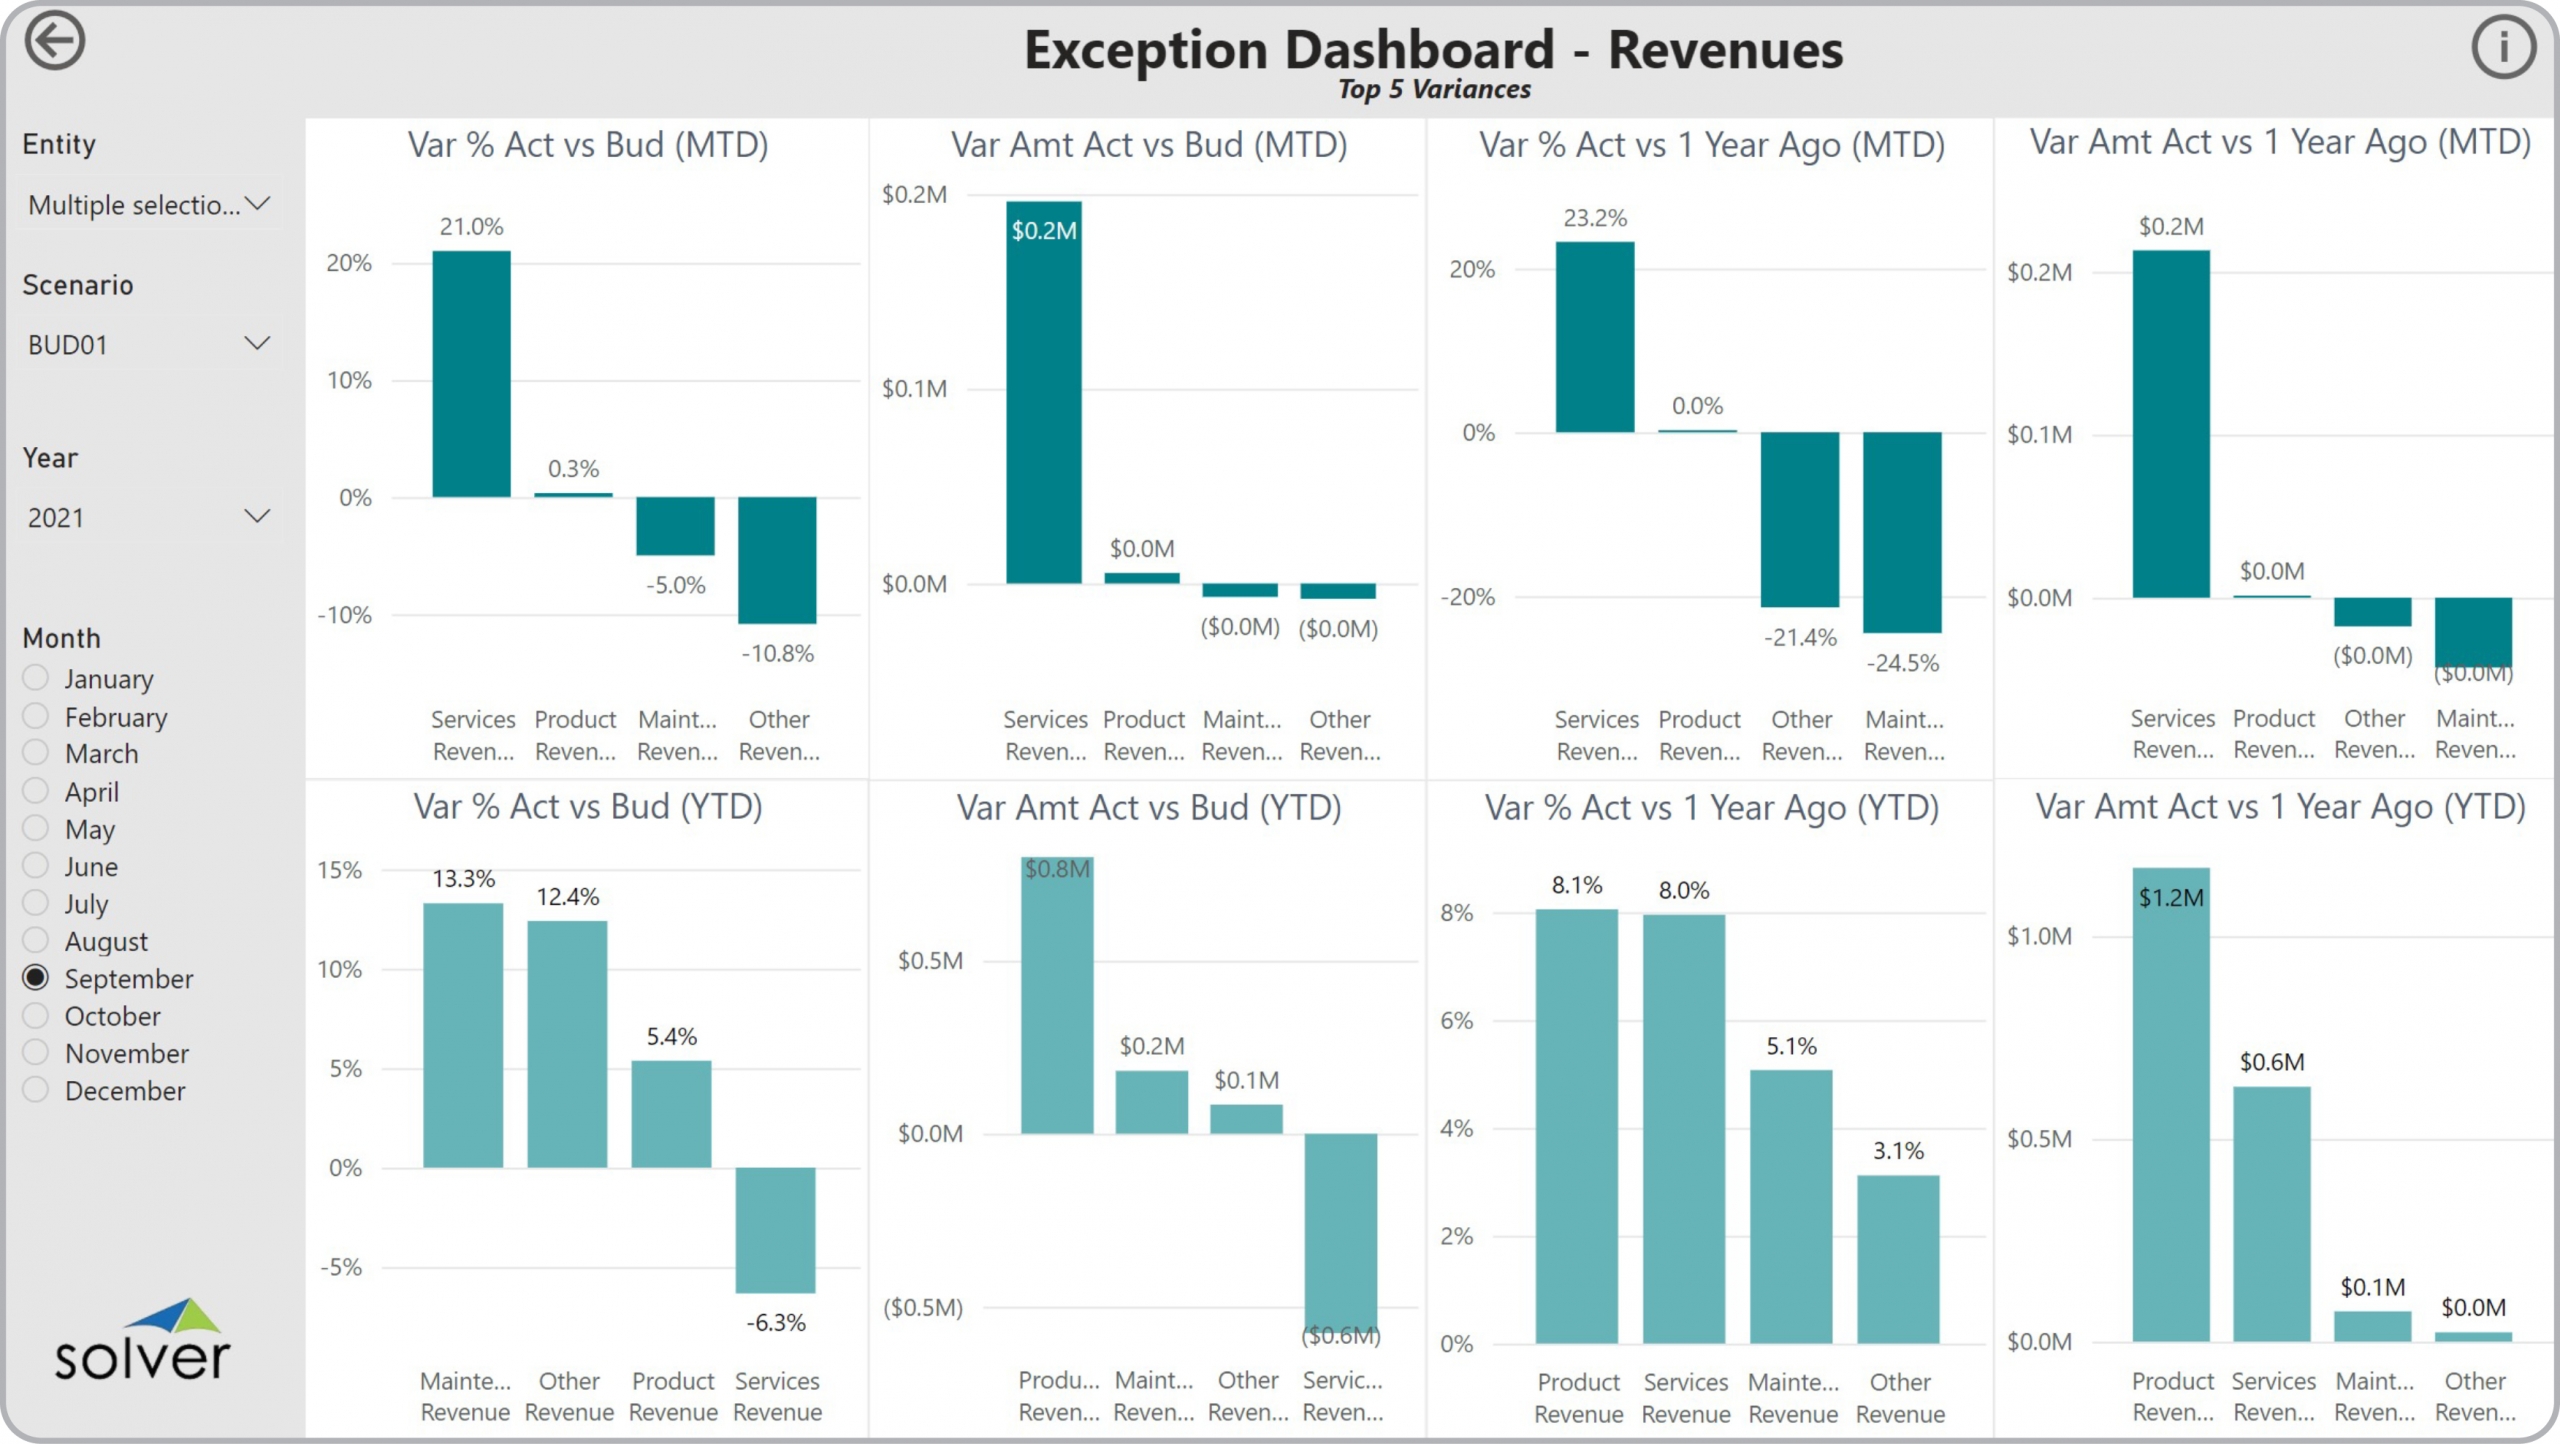
Using Revenue Exception Dashboards to Streamline the Monthly Analysis Process
How can Financial Dashboard s Drive Faster and Better Decisions? As CFOs increasingly become key ...
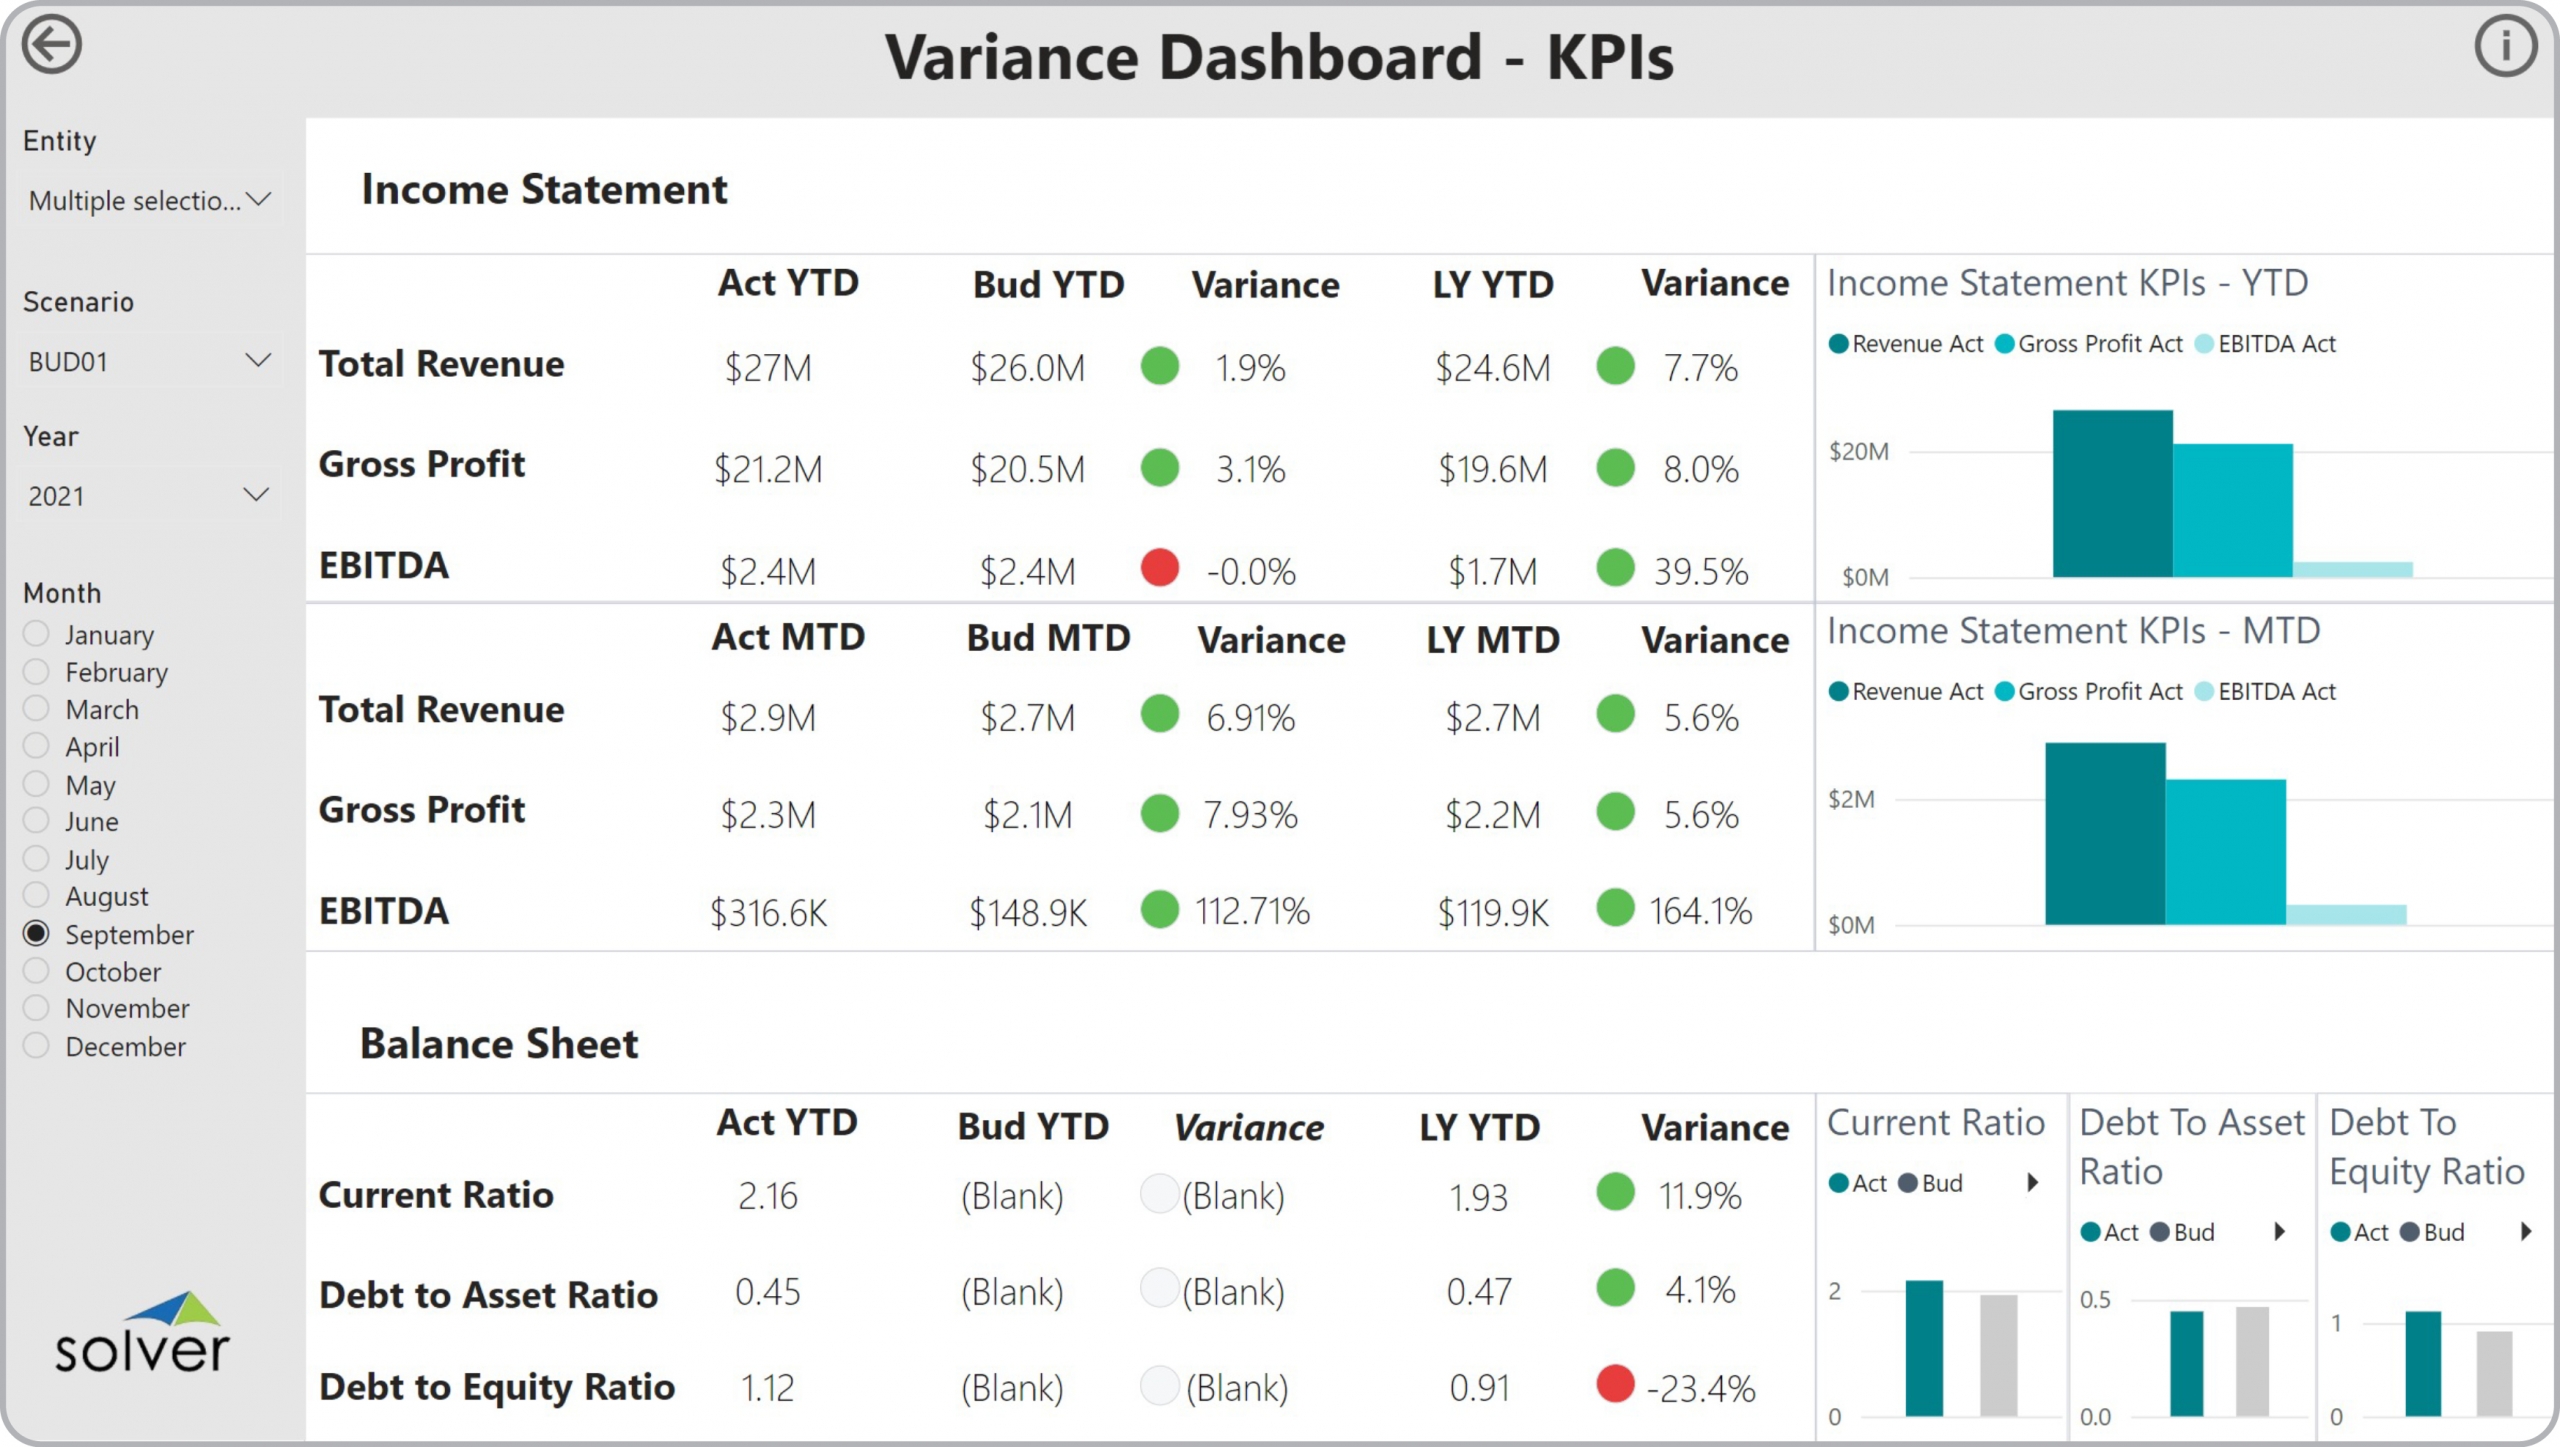
Using Financial KPI Variance Dashboards to Streamline the Monthly Analysis Process
How can Financial KPI Dashboard s Drive Faster and Better Decisions? As CFOs increasingly become ...
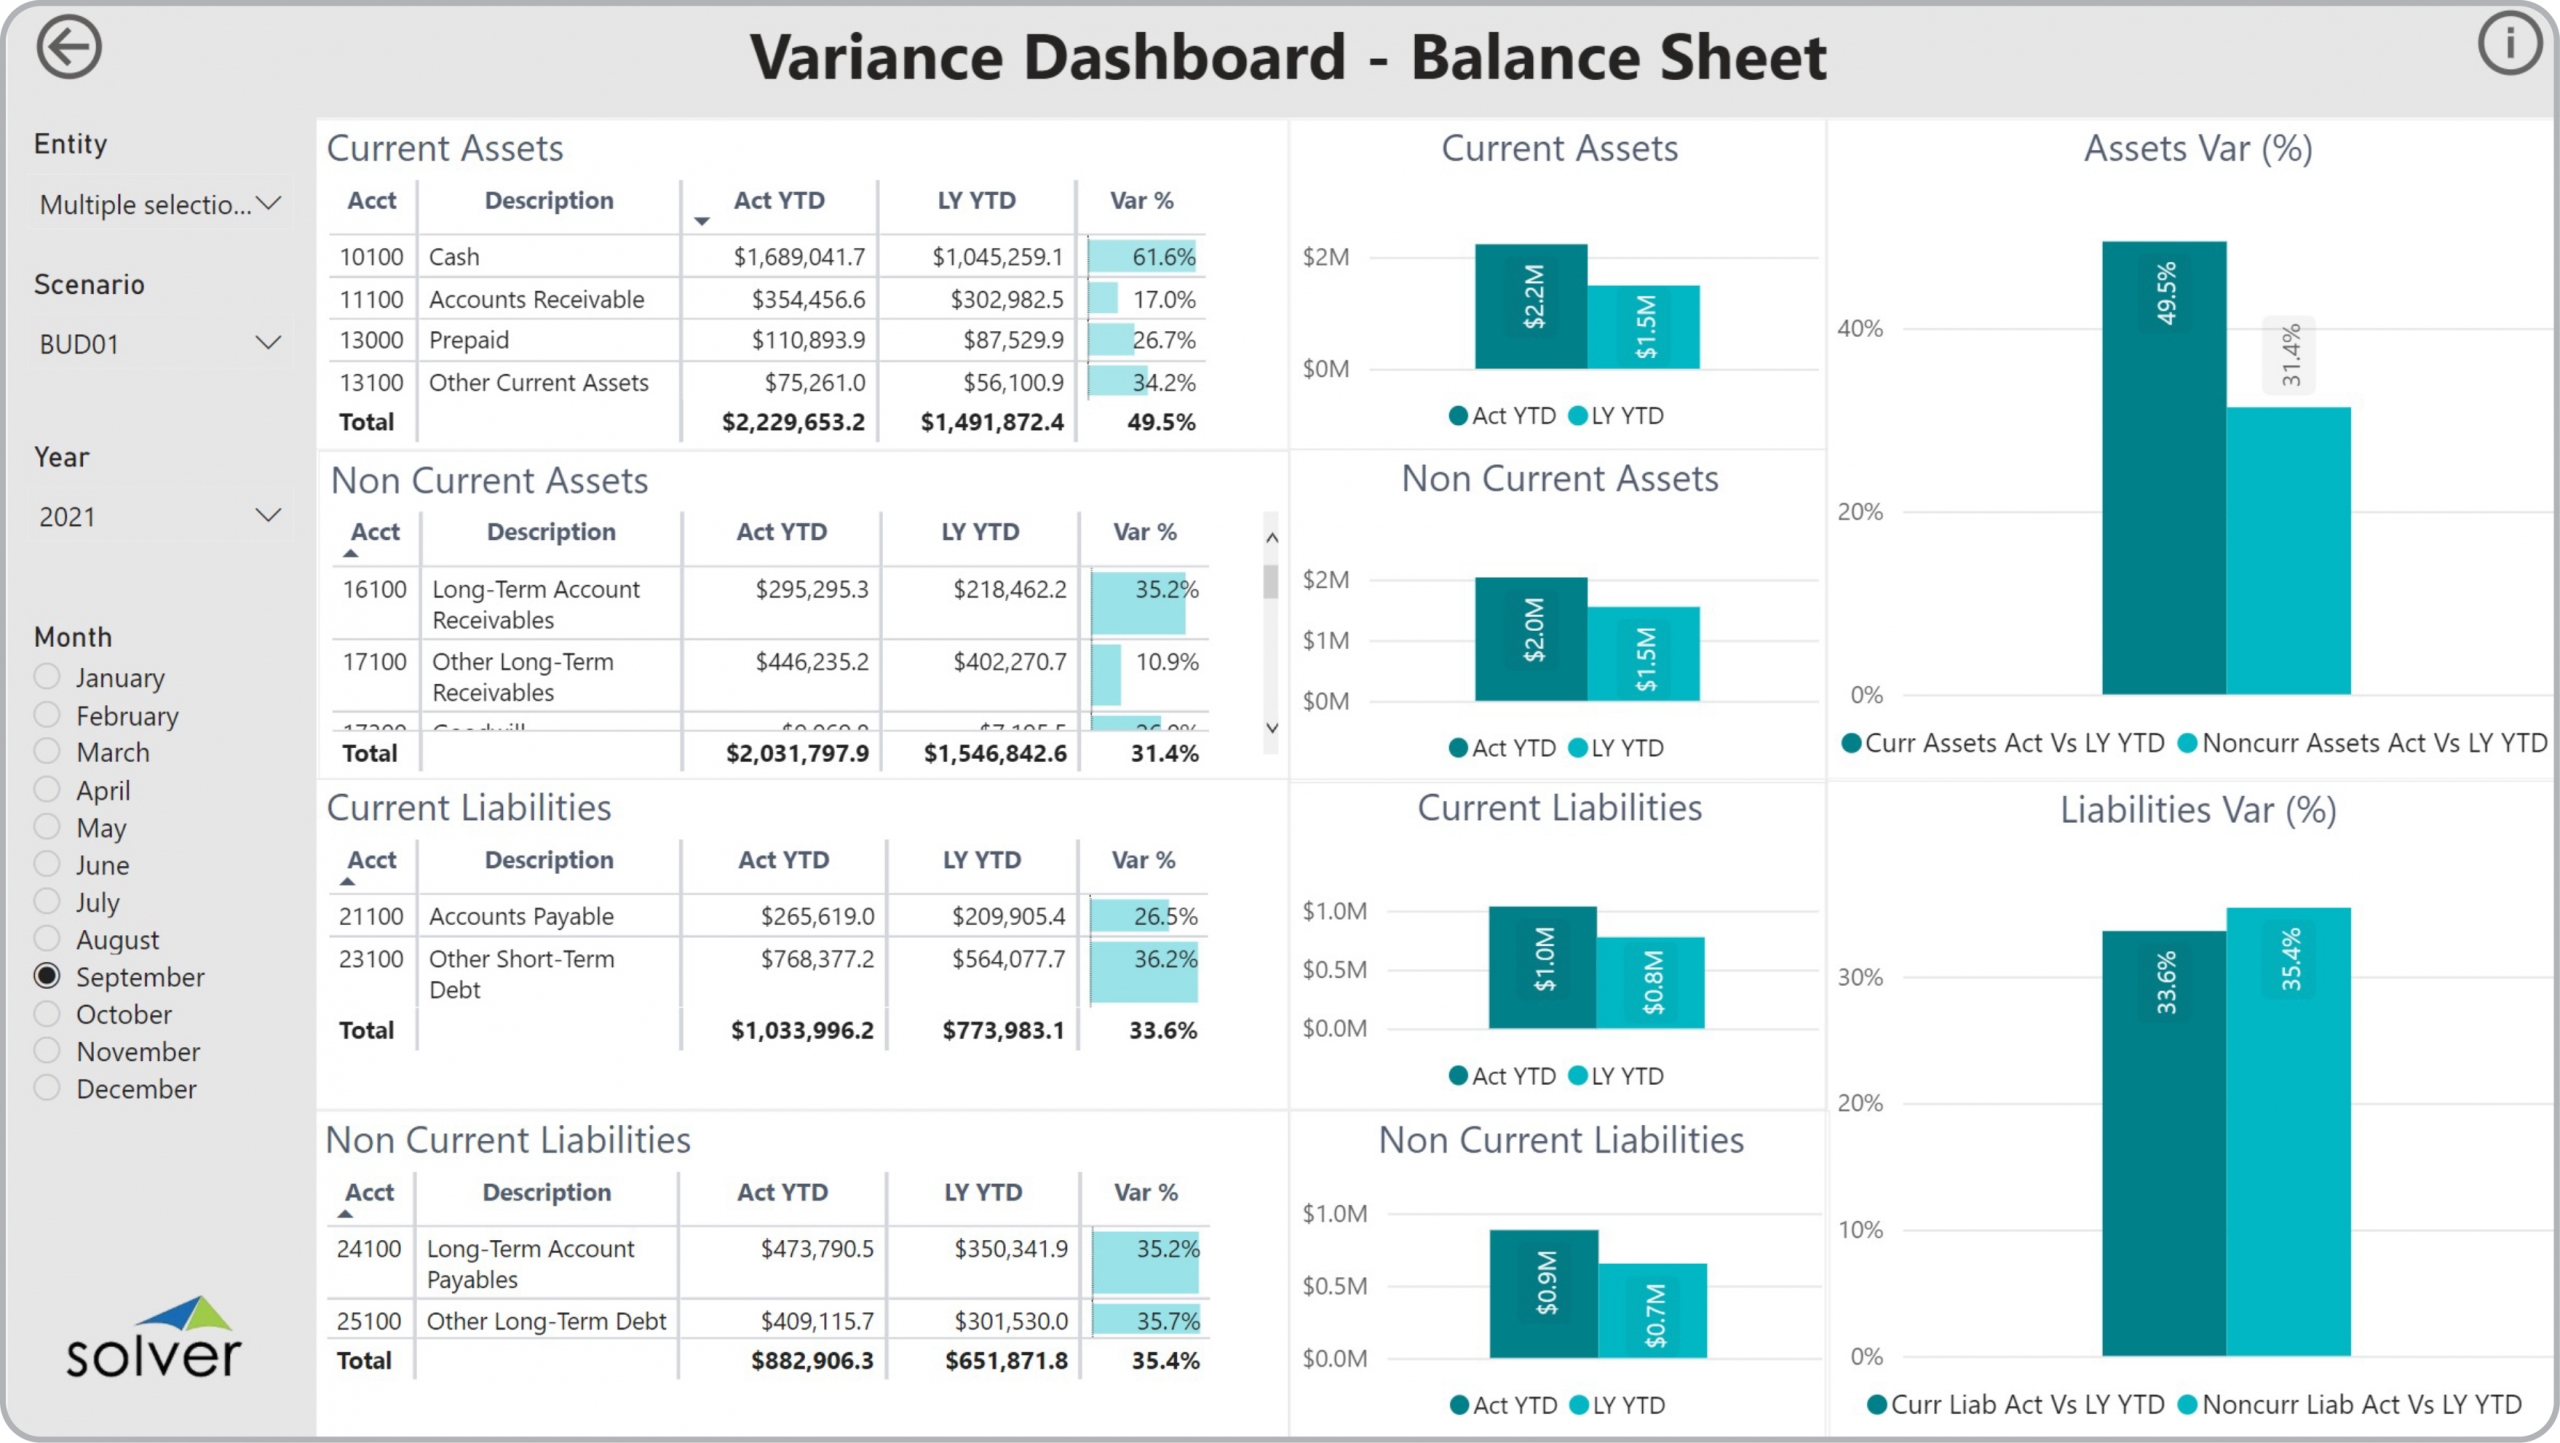
Using Balance Sheet Variance Dashboards to Streamline the Monthly Analysis Process
How can Financial Dashboard s Drive Faster and Better Decisions? As CFOs increasingly become key ...
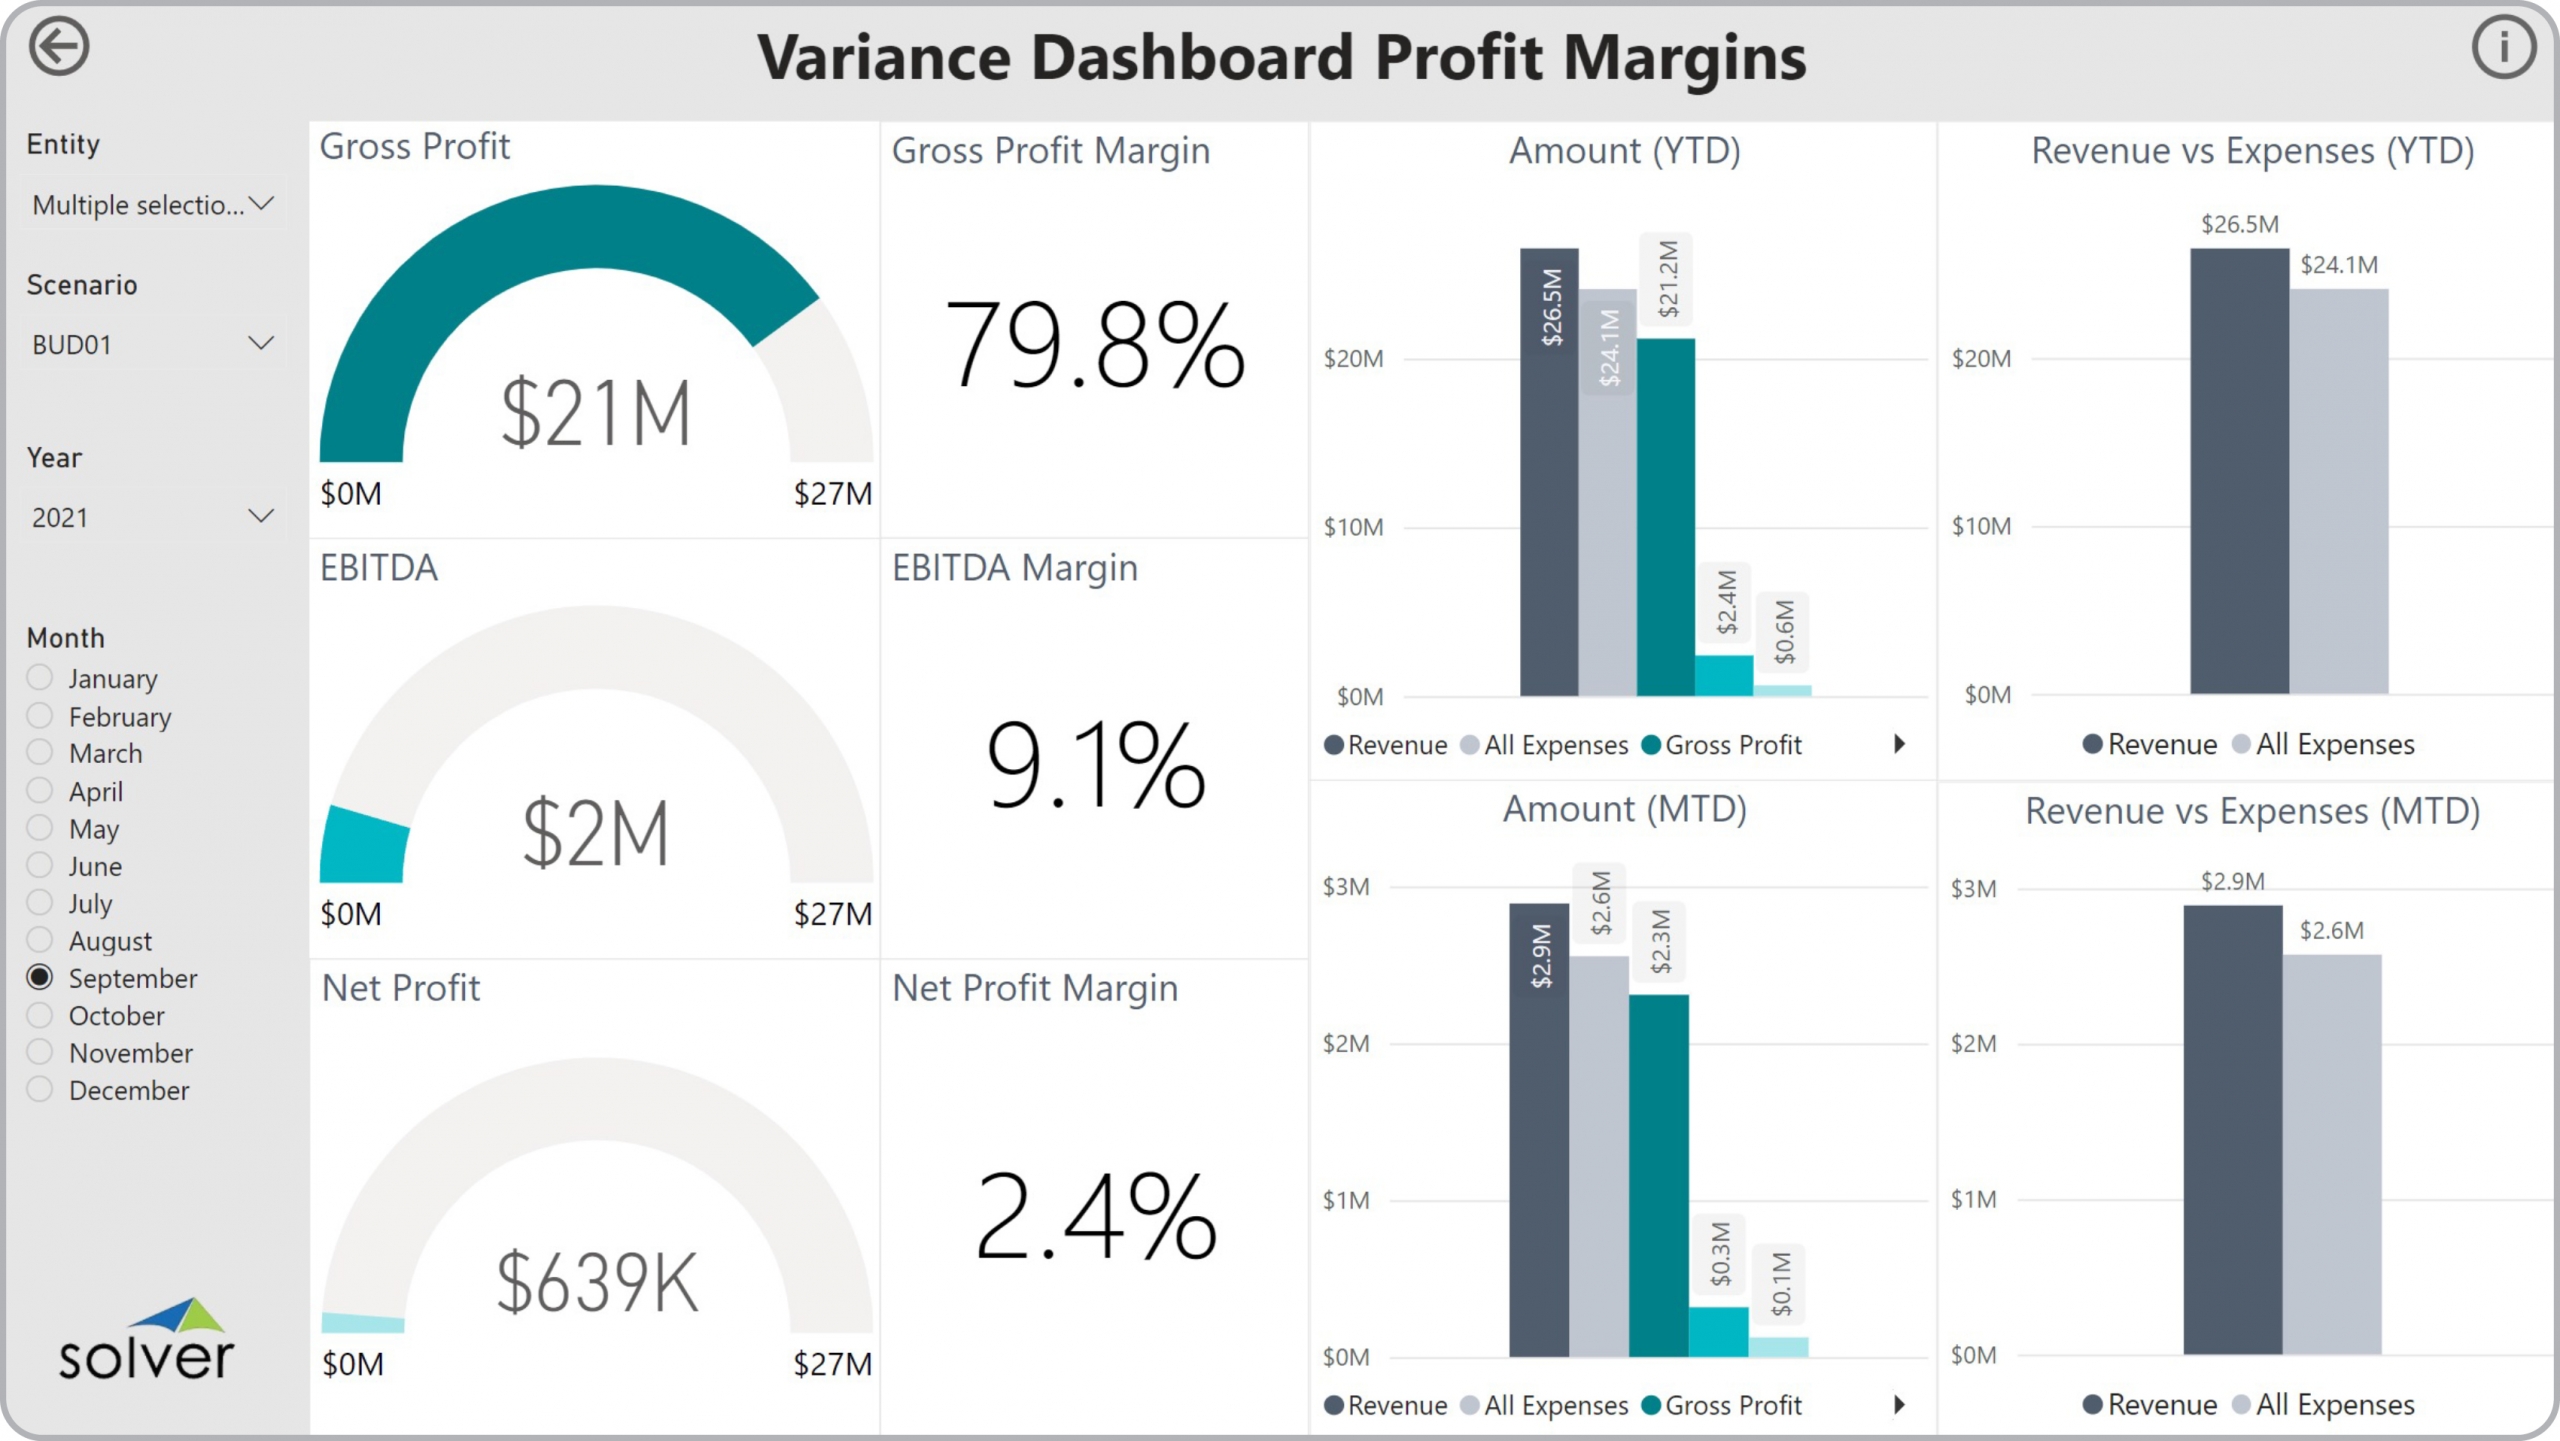
Using Profit Margin Variance Dashboards to Streamline the Monthly Analysis Process
How can Financial Dashboard s Drive Faster and Better Decisions? As CFOs increasingly become ...
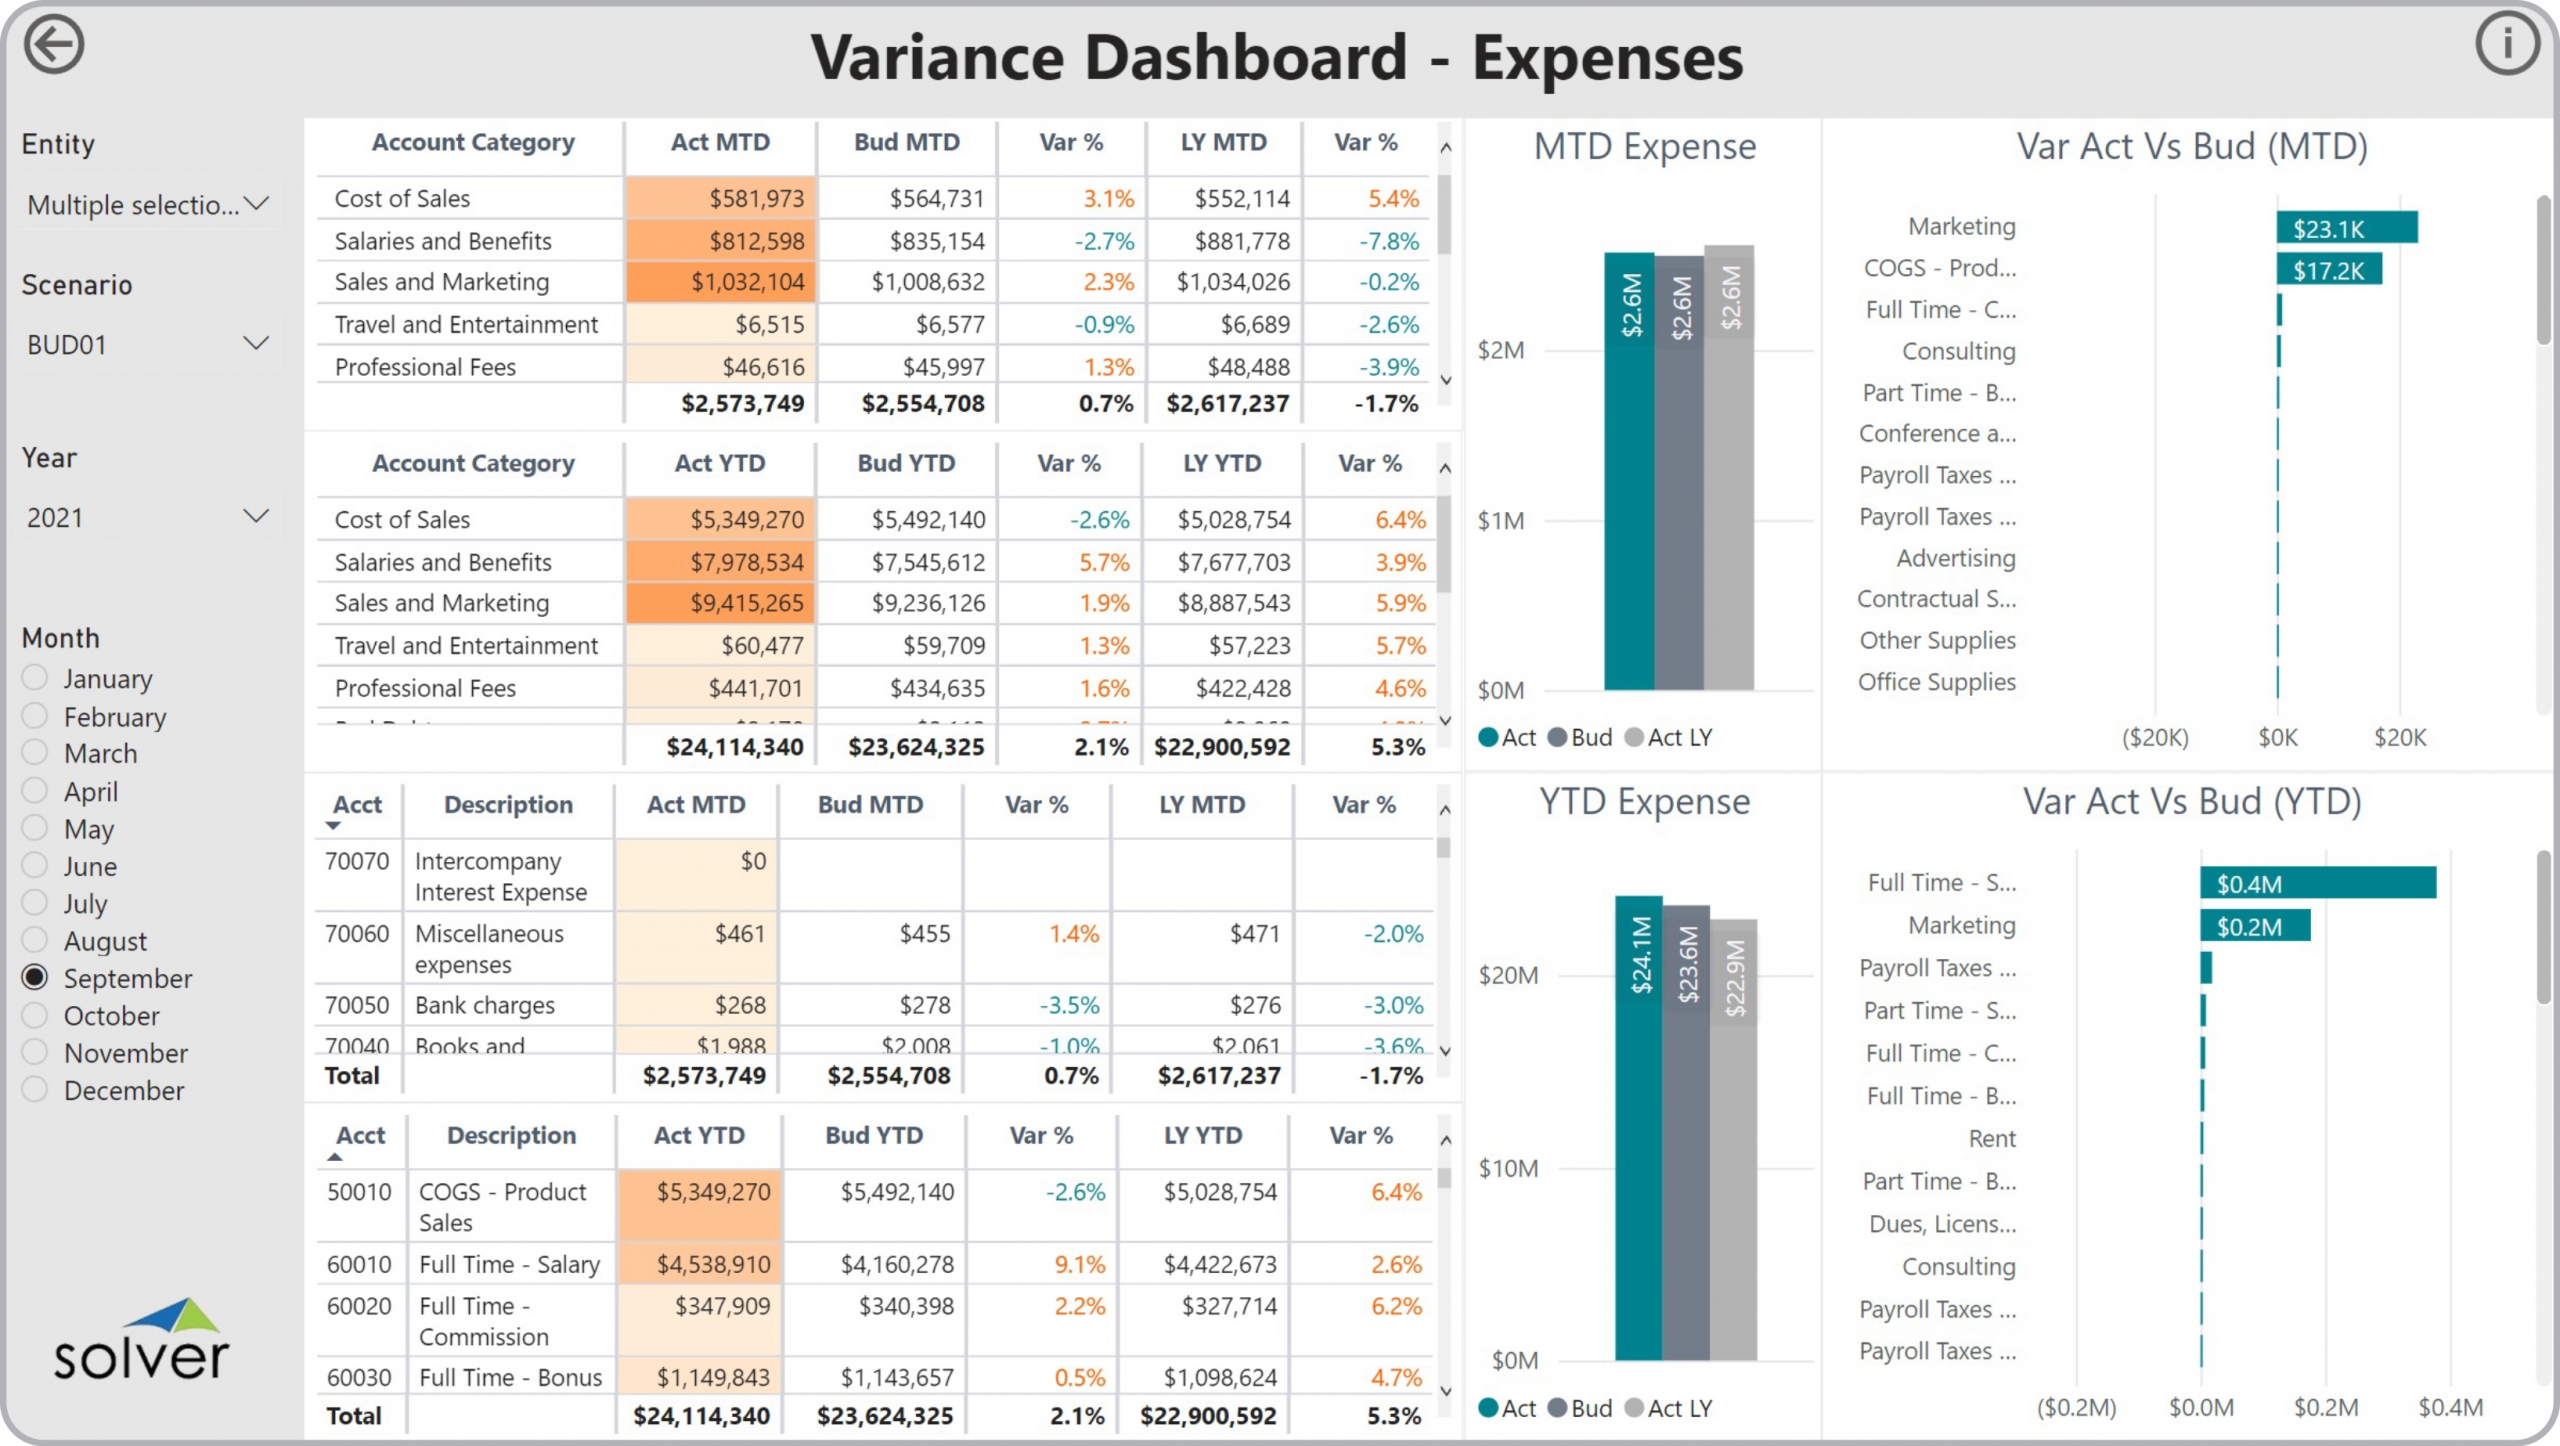
Using Expense Variance Dashboards to Streamline the Monthly Analysis Process
How can Financial Dashboard s Drive Faster and Better Decisions? As CFOs increasingly become key ...
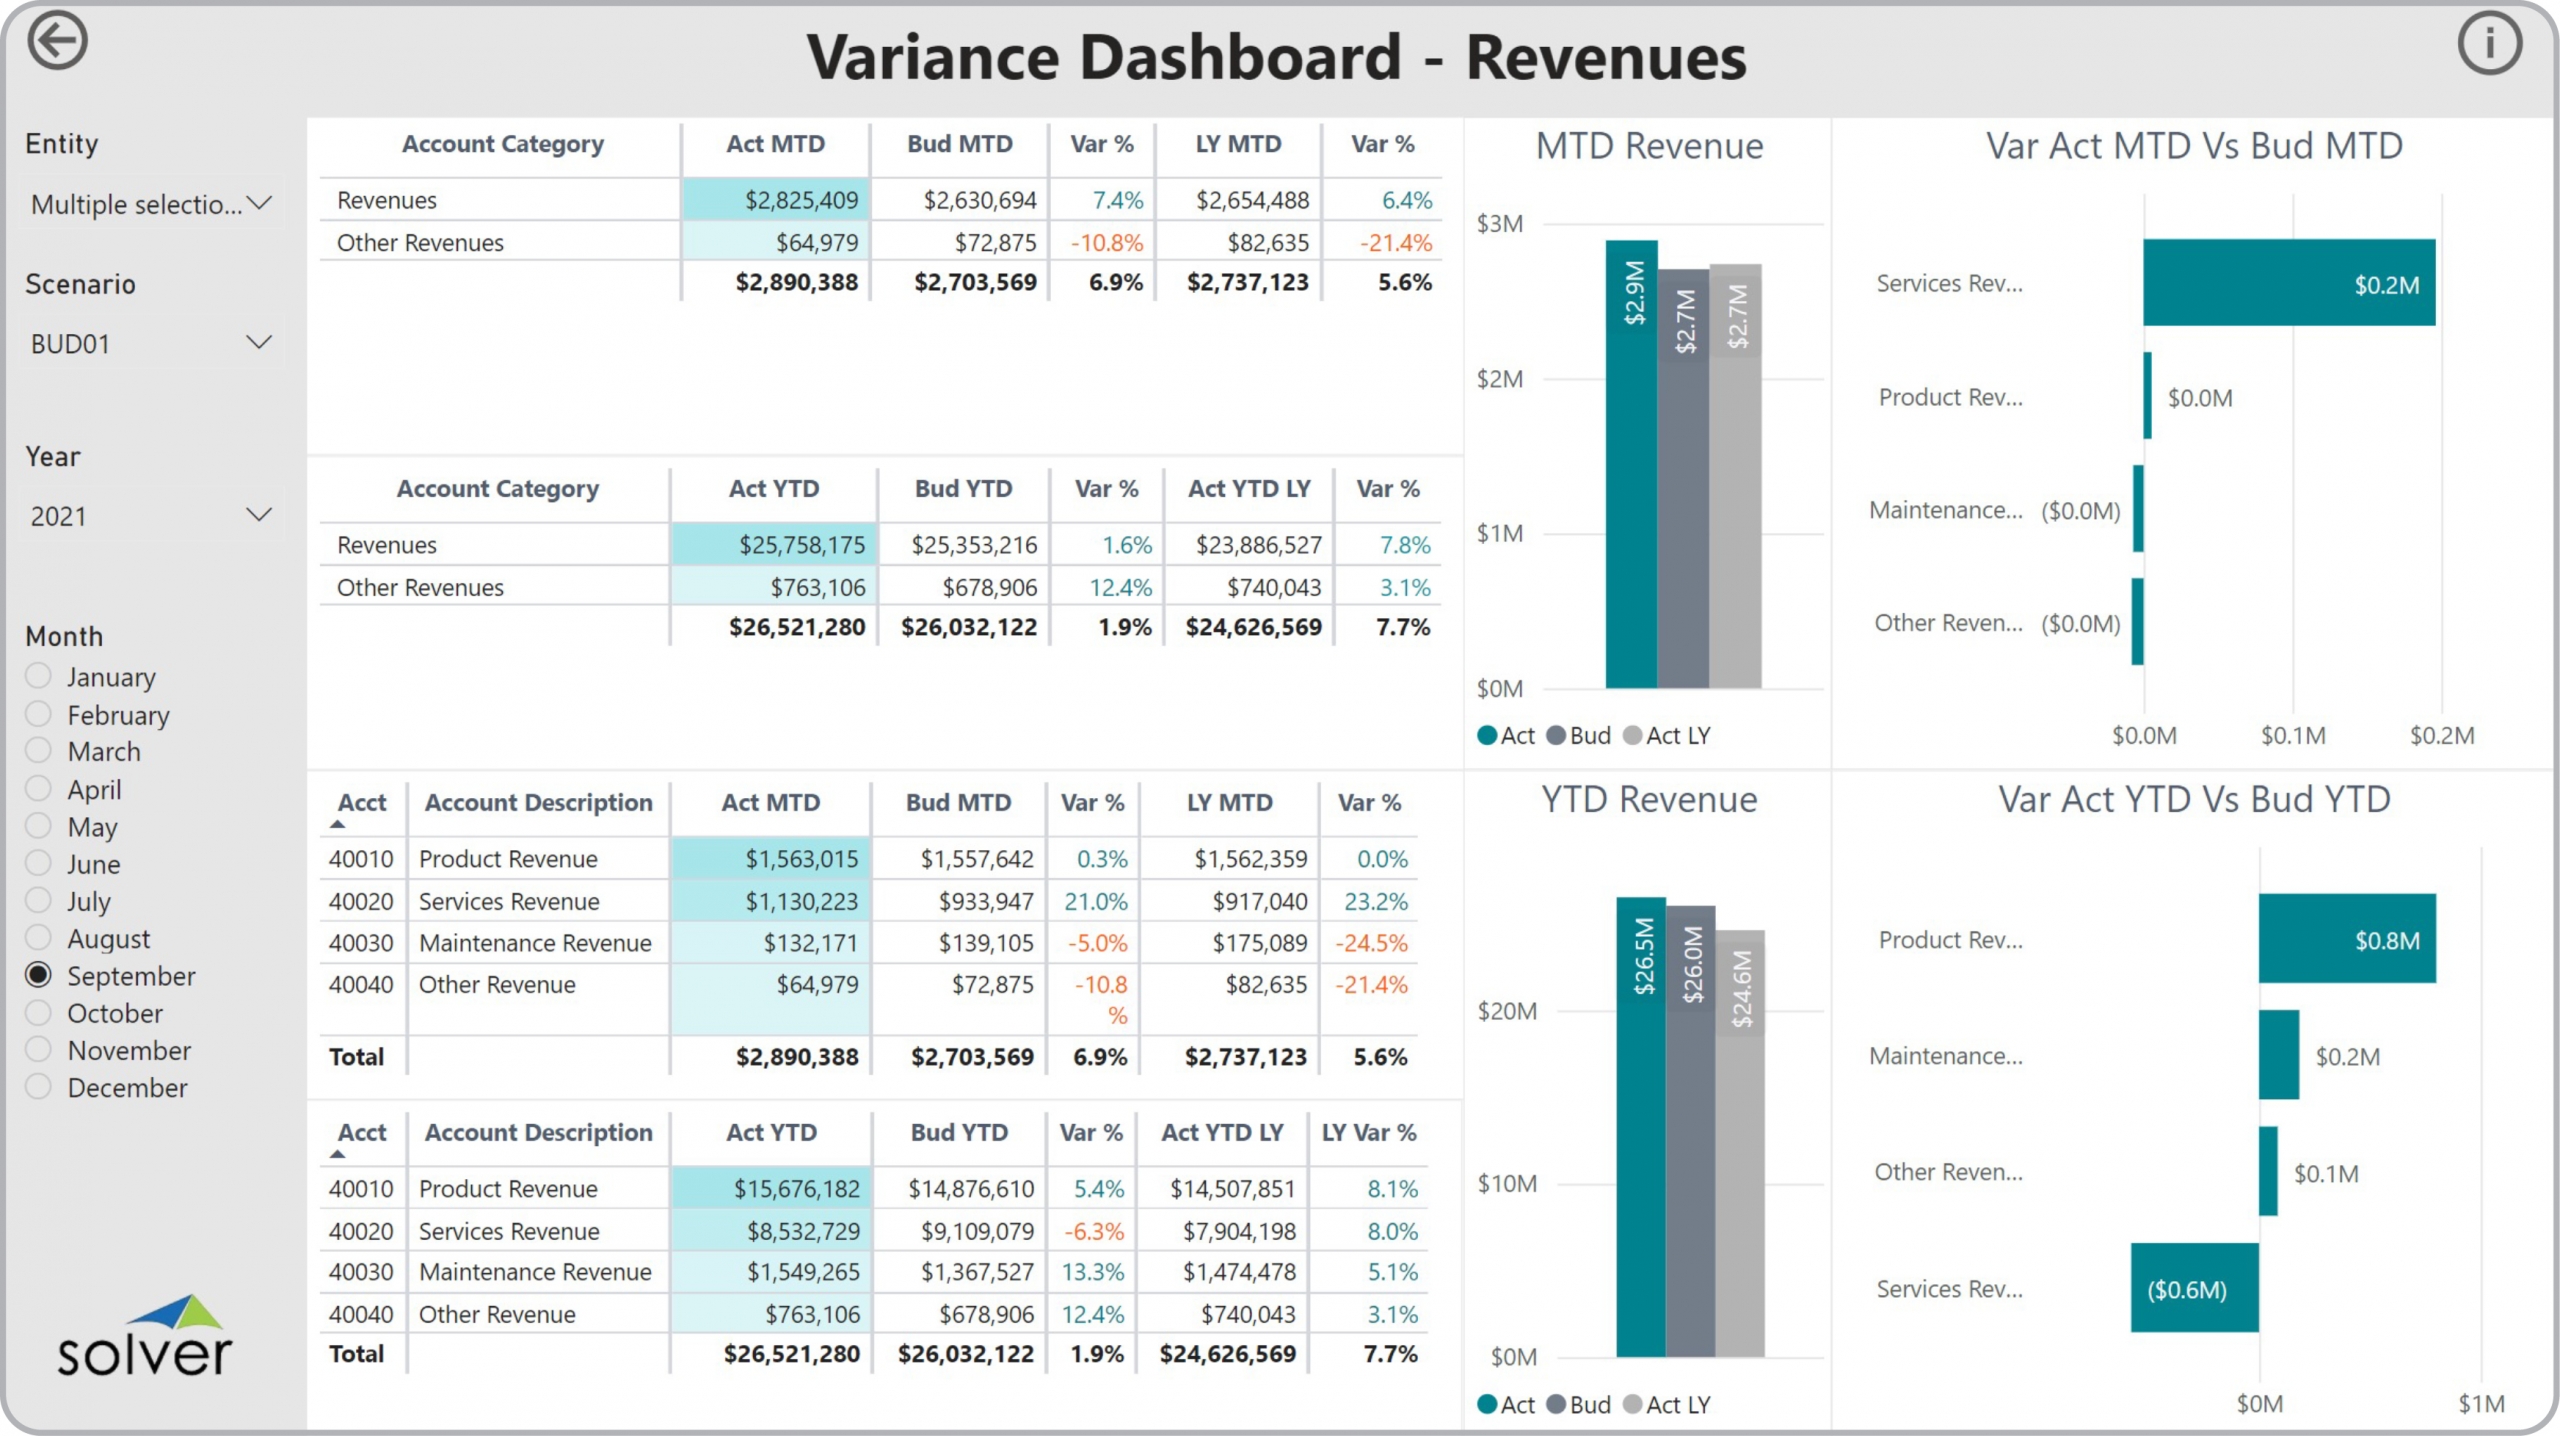
Using Revenue Variance Dashboards to Streamline the Monthly Analysis Process
How can Financial Dashboard s Drive Faster and Better Decisions? As CFOs increasingly become key ...
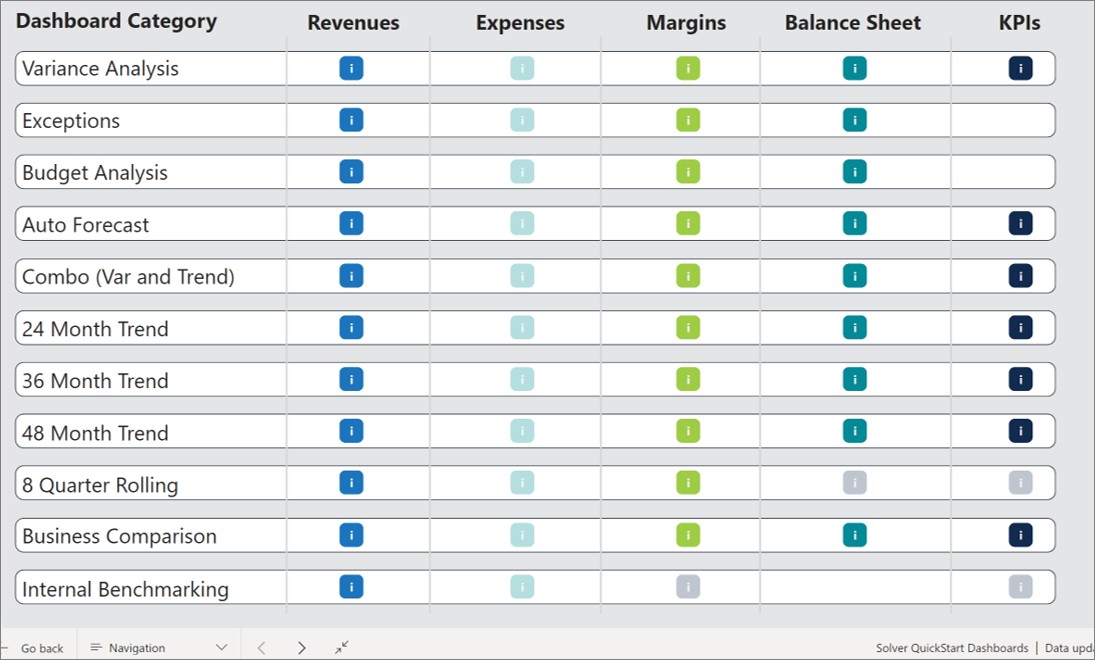
Using Interactive Dashboard Navigation Menus to Simplify Financial Analysis
How can Dashboard Navigation Menus Help Drive Faster and Better Decisions? As CFOs increasingly ...
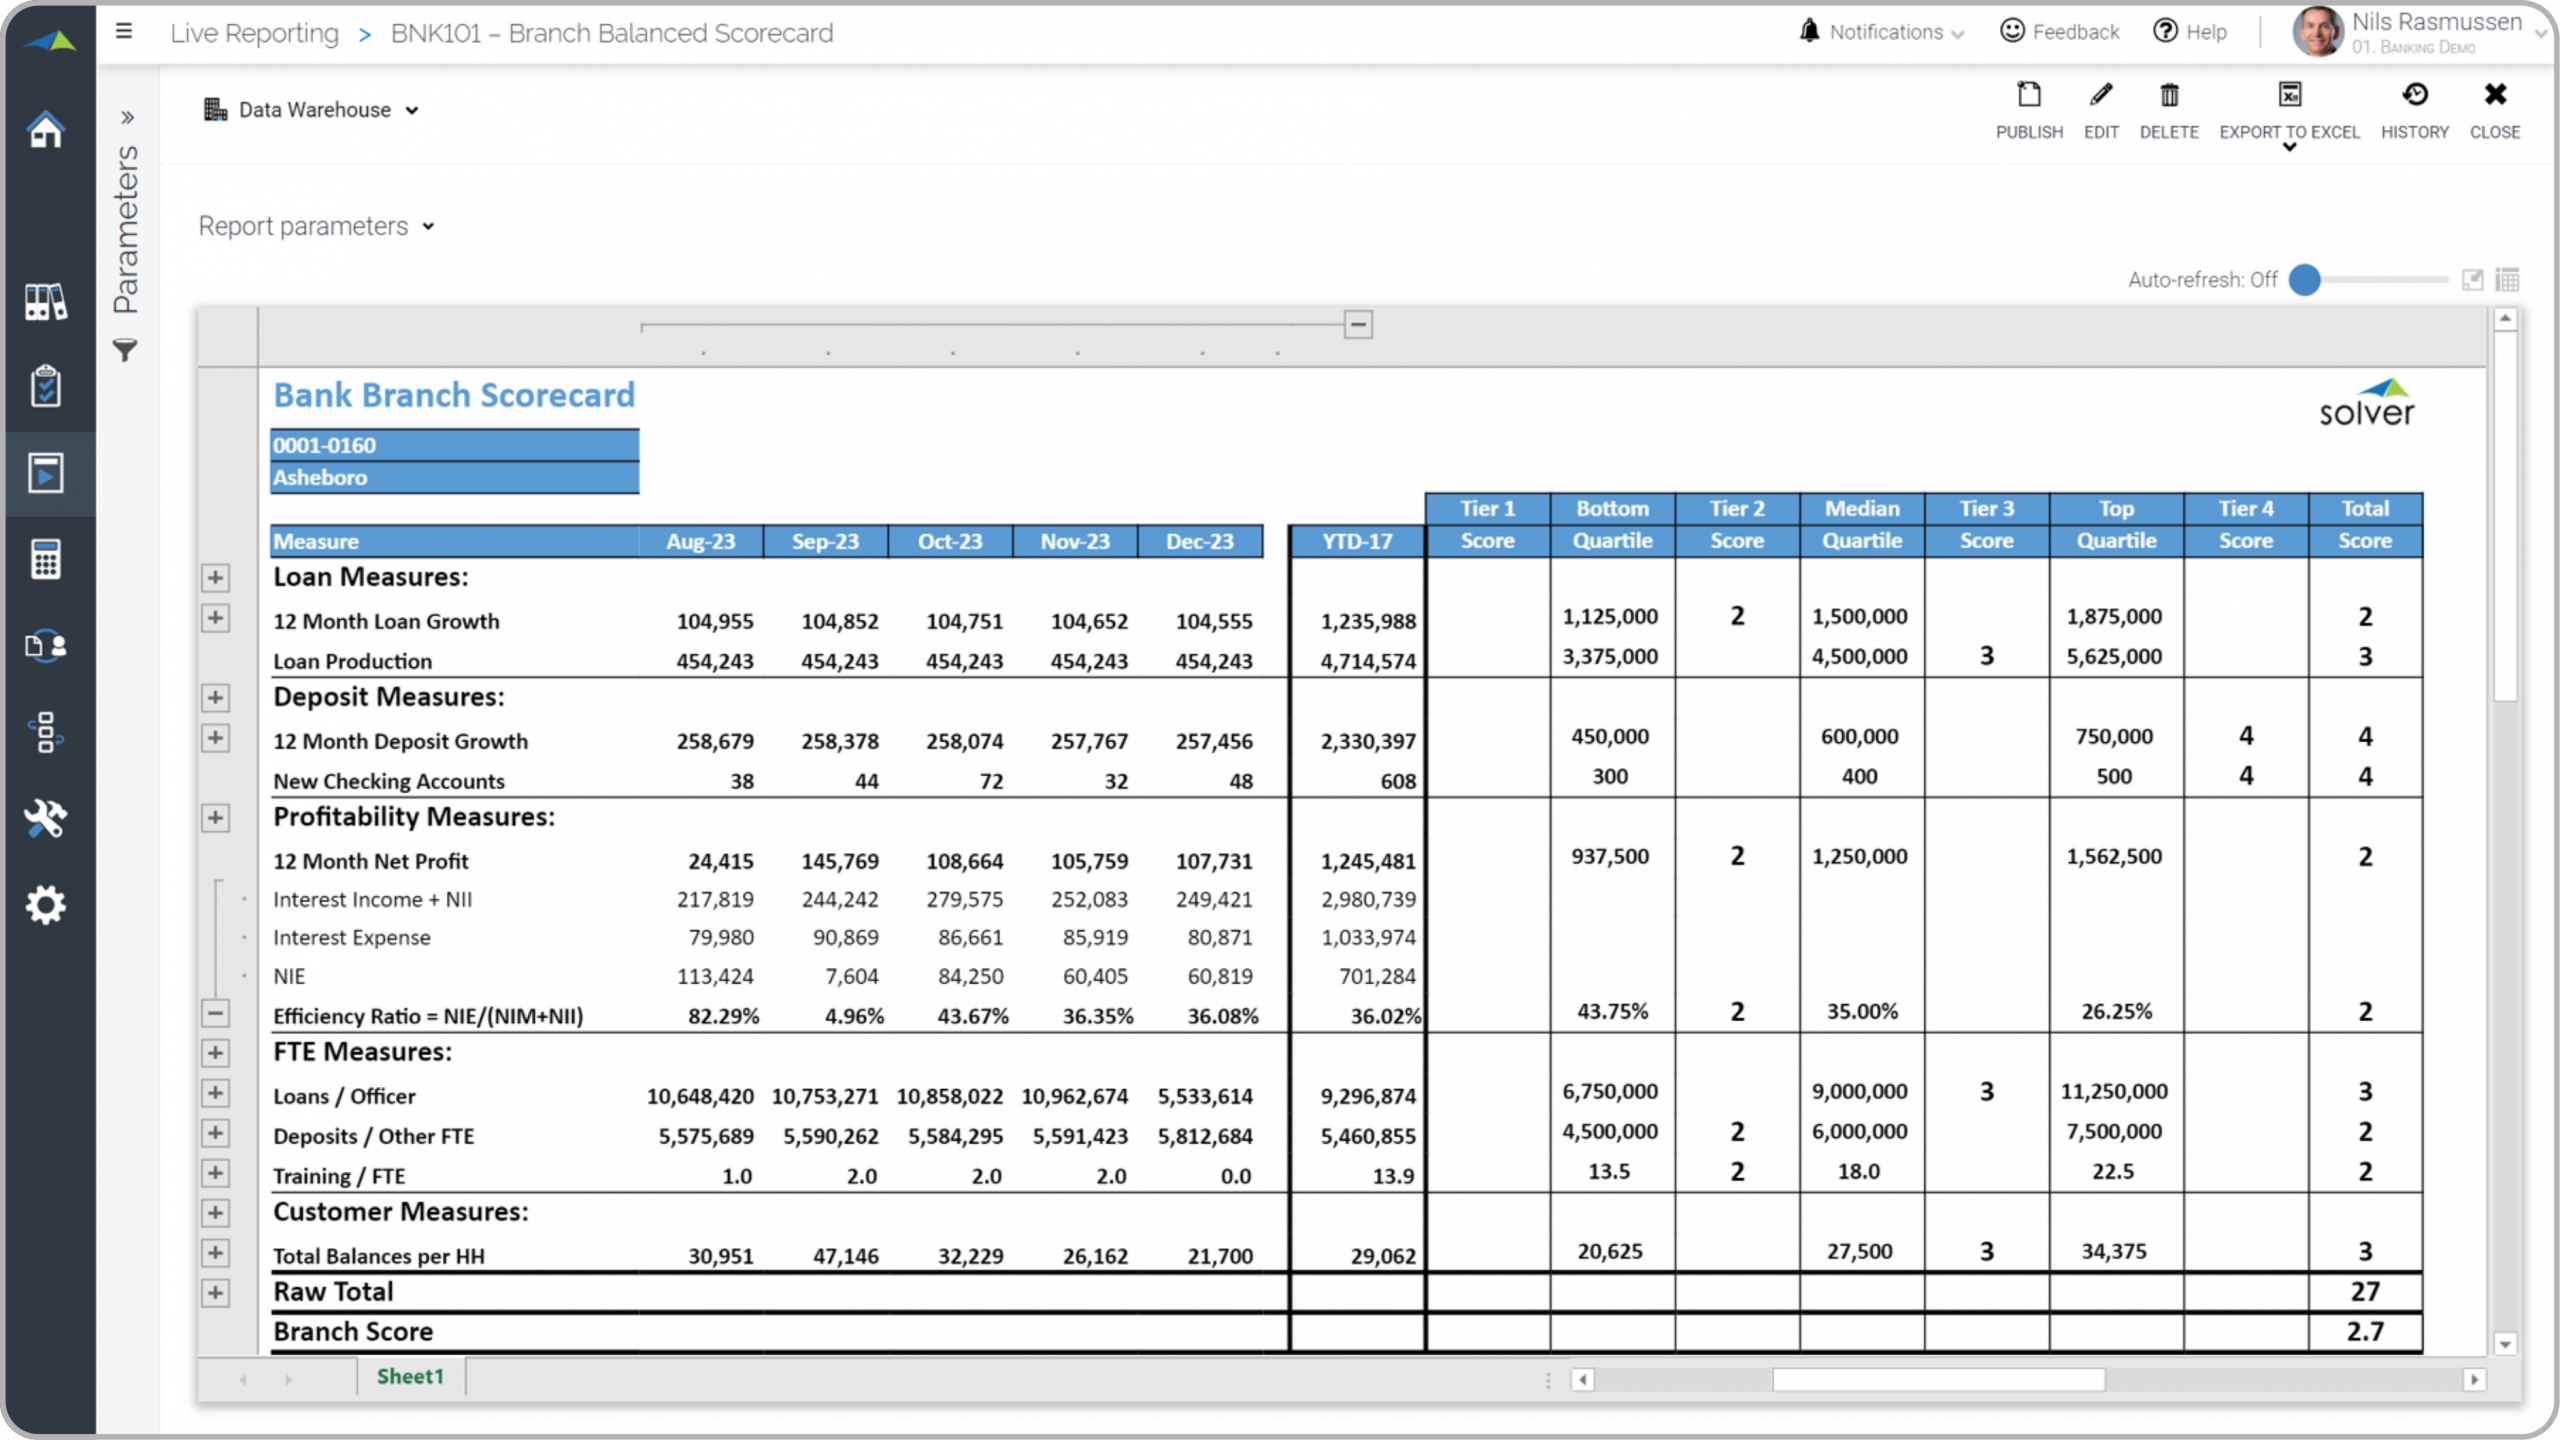
Balanced Scorecard Report for Bank Branches
What is a Balanced Scorecard for Bank Branches ? Balanced Scorecard Reports are considered KPI ...
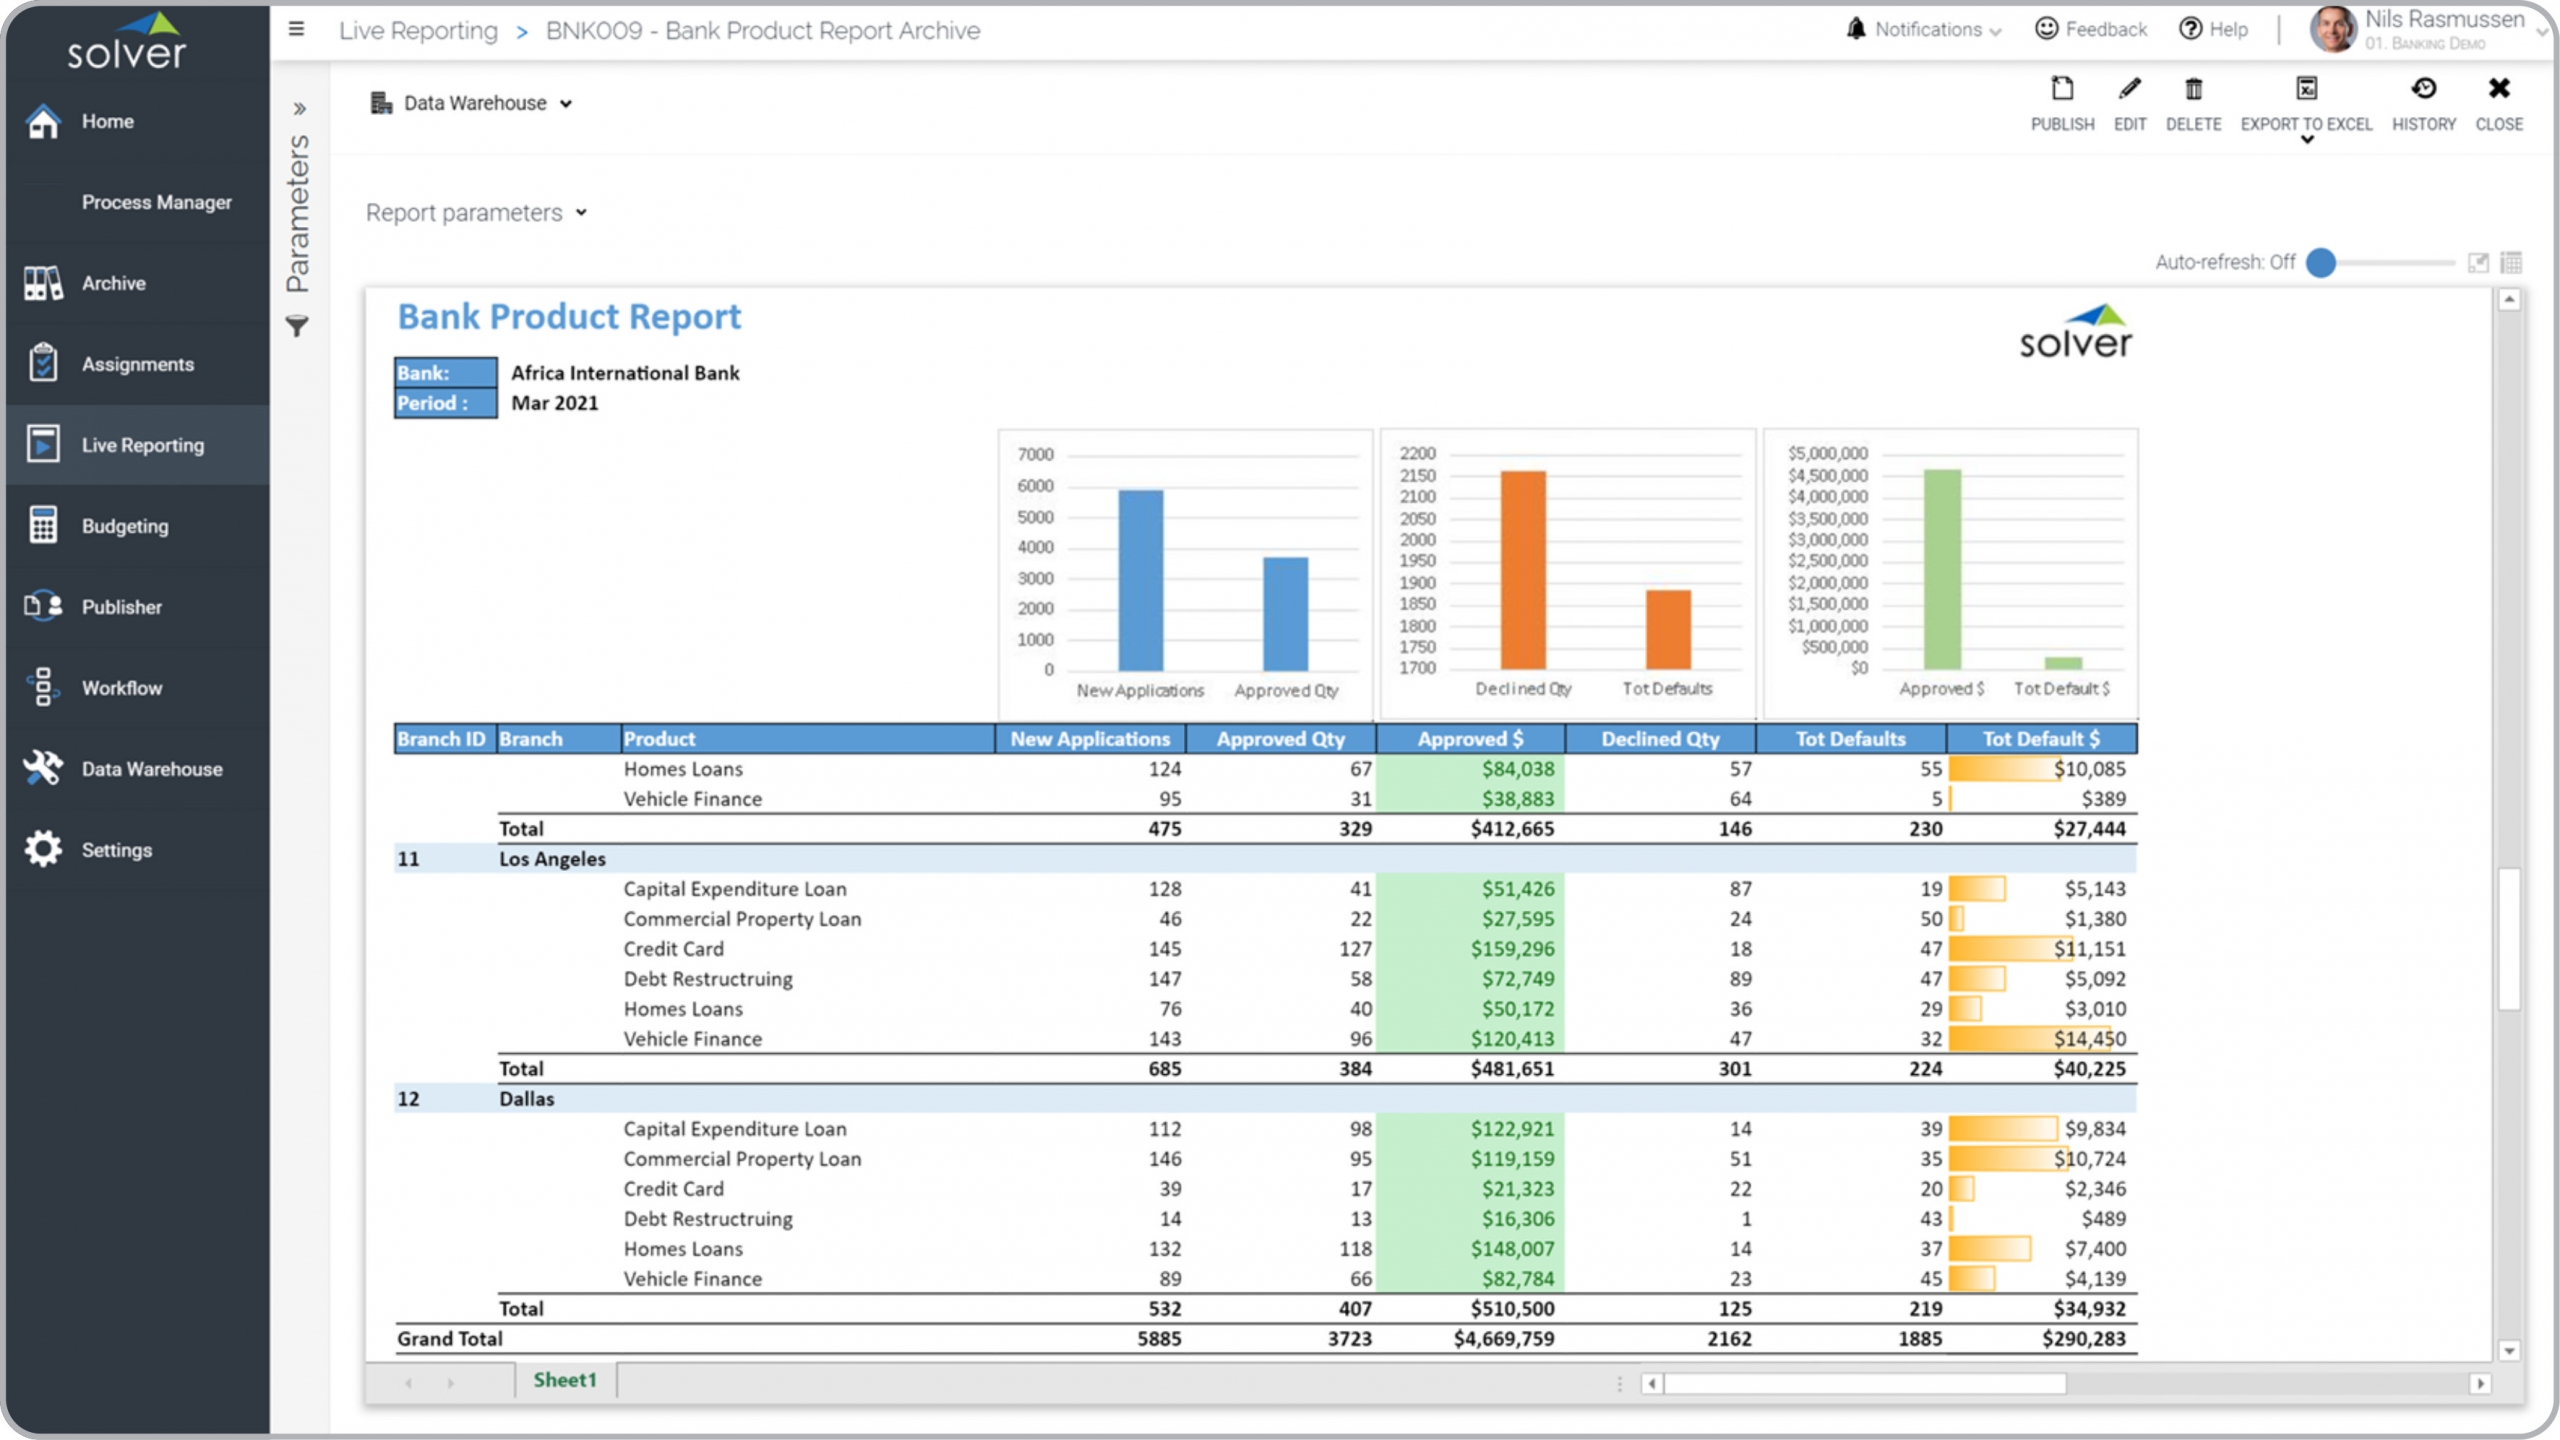
Product KPI Report for Banks
What is a Product KPI Report for Banks ? Product KPI Reports are considered operational analysis ...
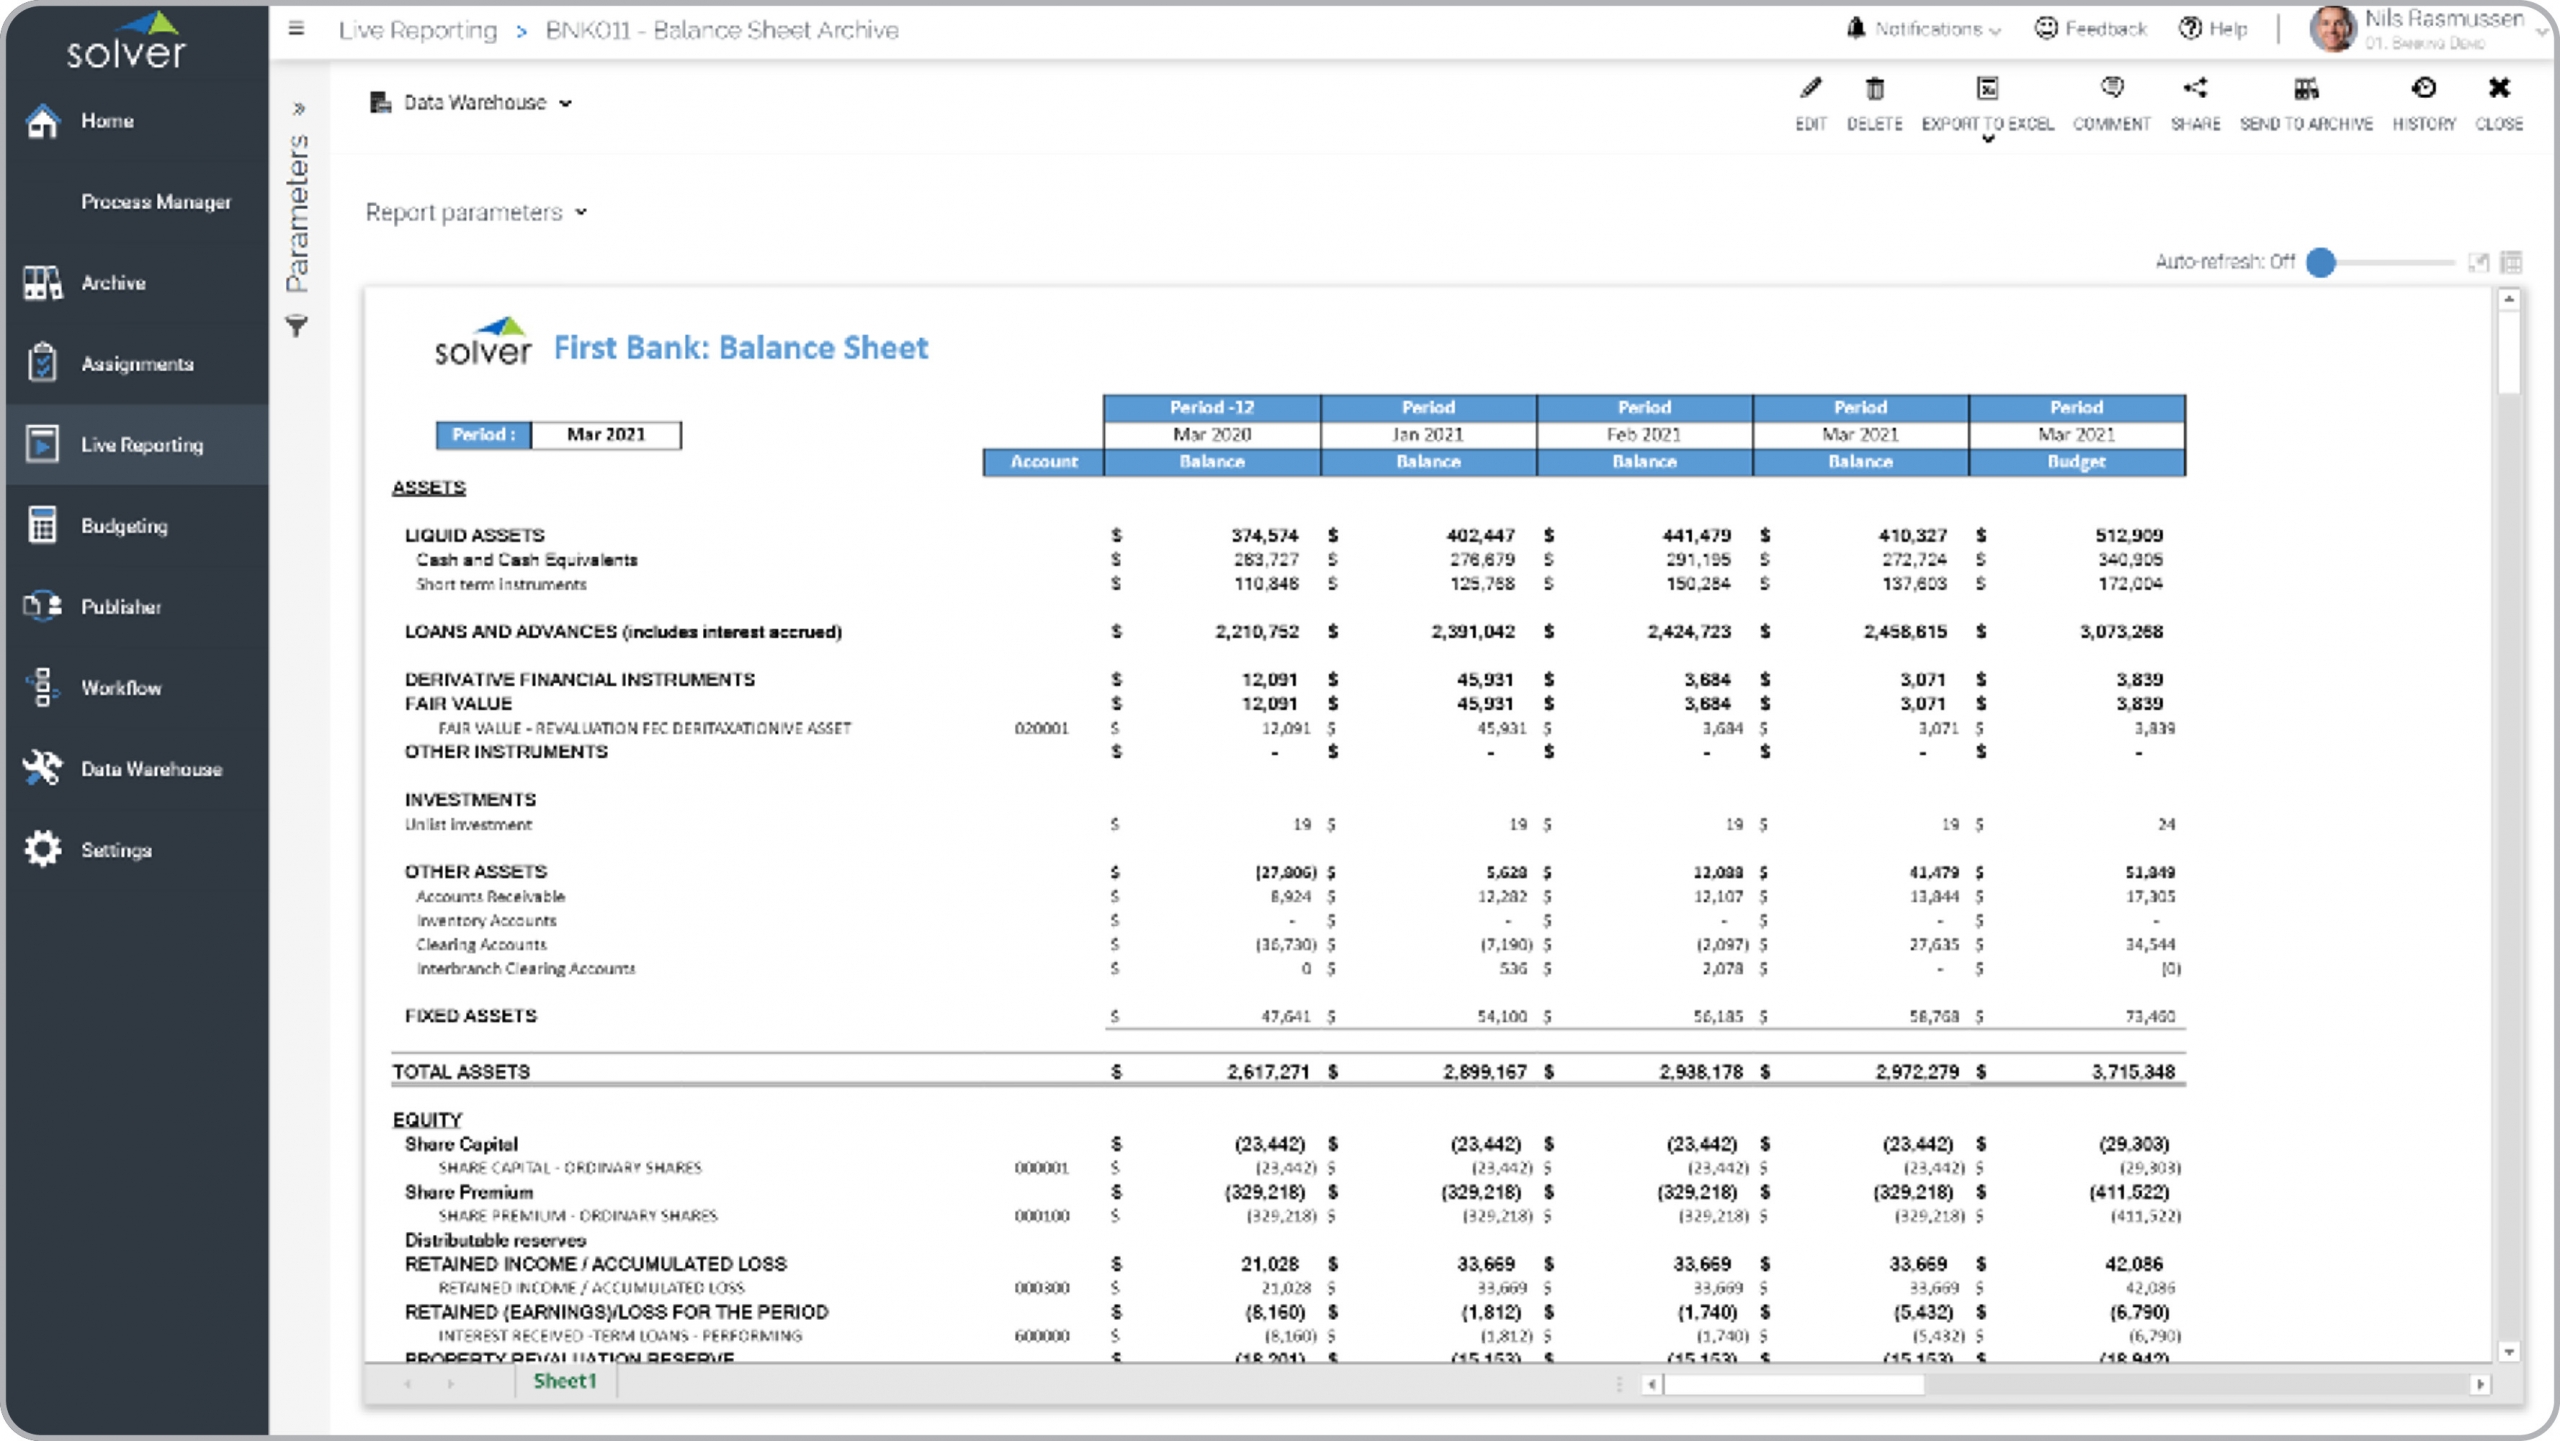
Trended Balance Sheet Report for Banks
What is a Trended Balance Sheet Report for Banks ? Trended Balance Sheets are considered analytical ...
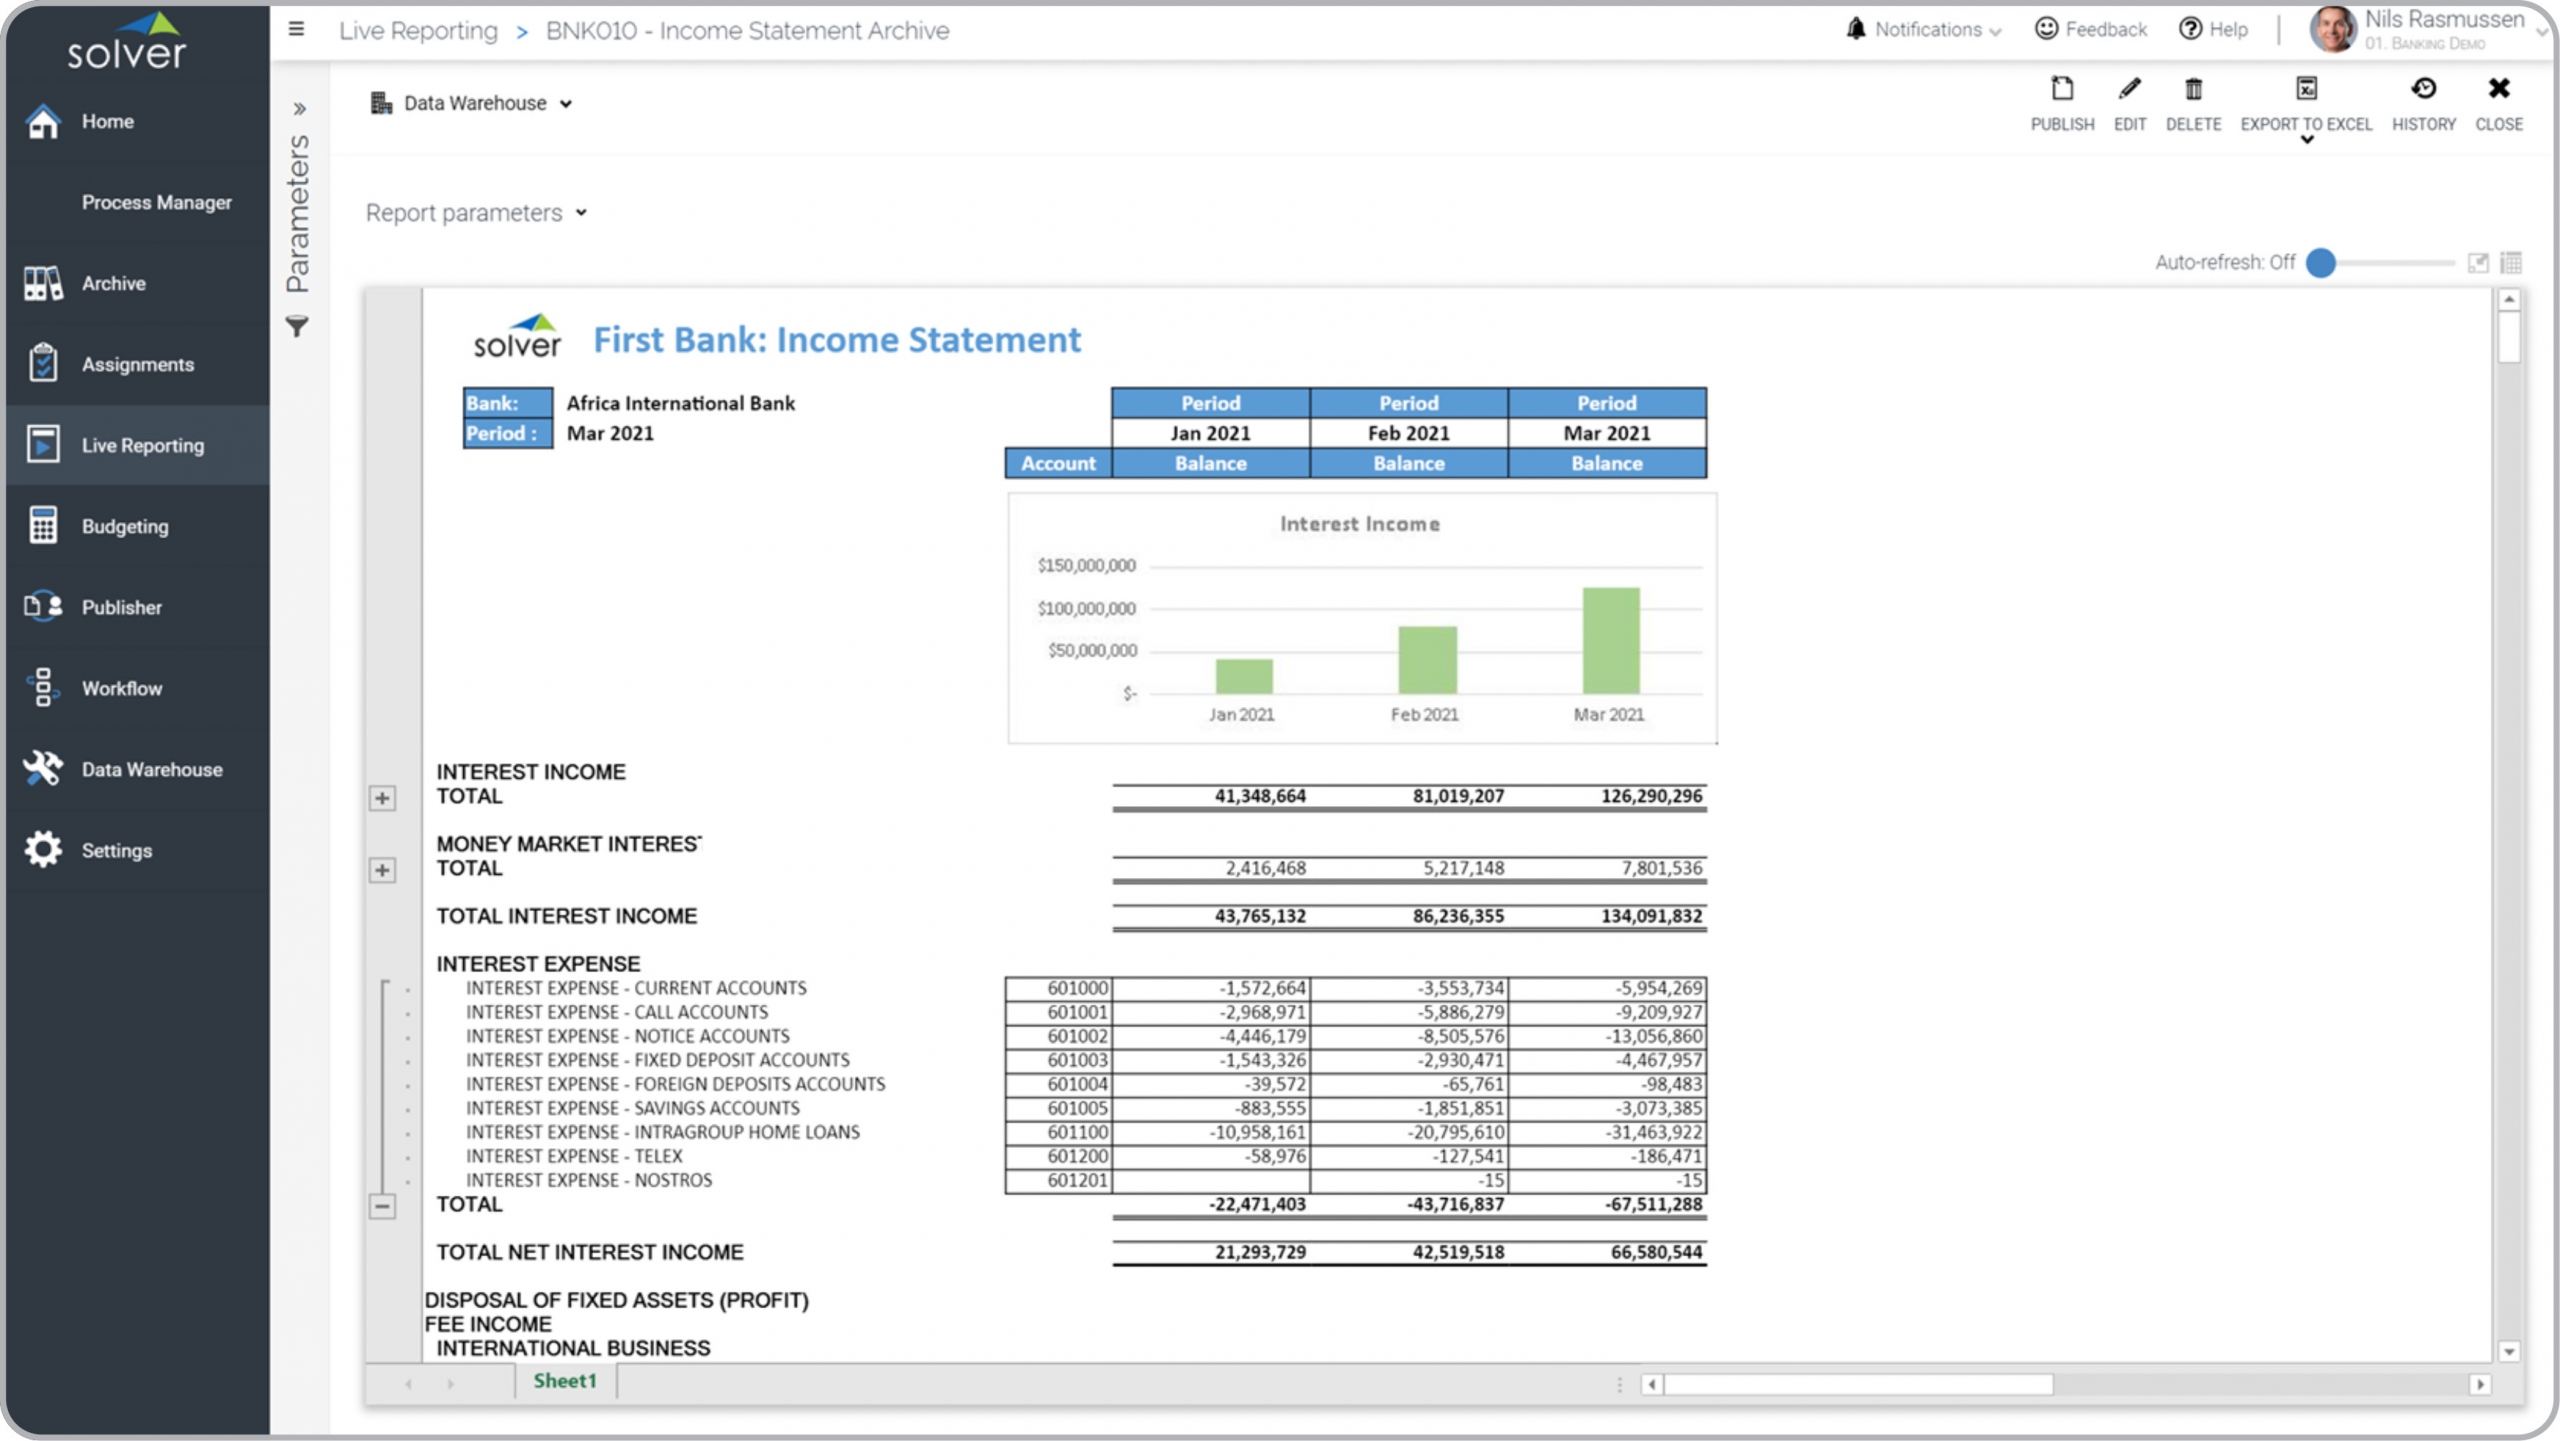
Trended Income Statement for Banks
What is a Trended Income Statement for Banks ? Trended Income Statements are considered core ...
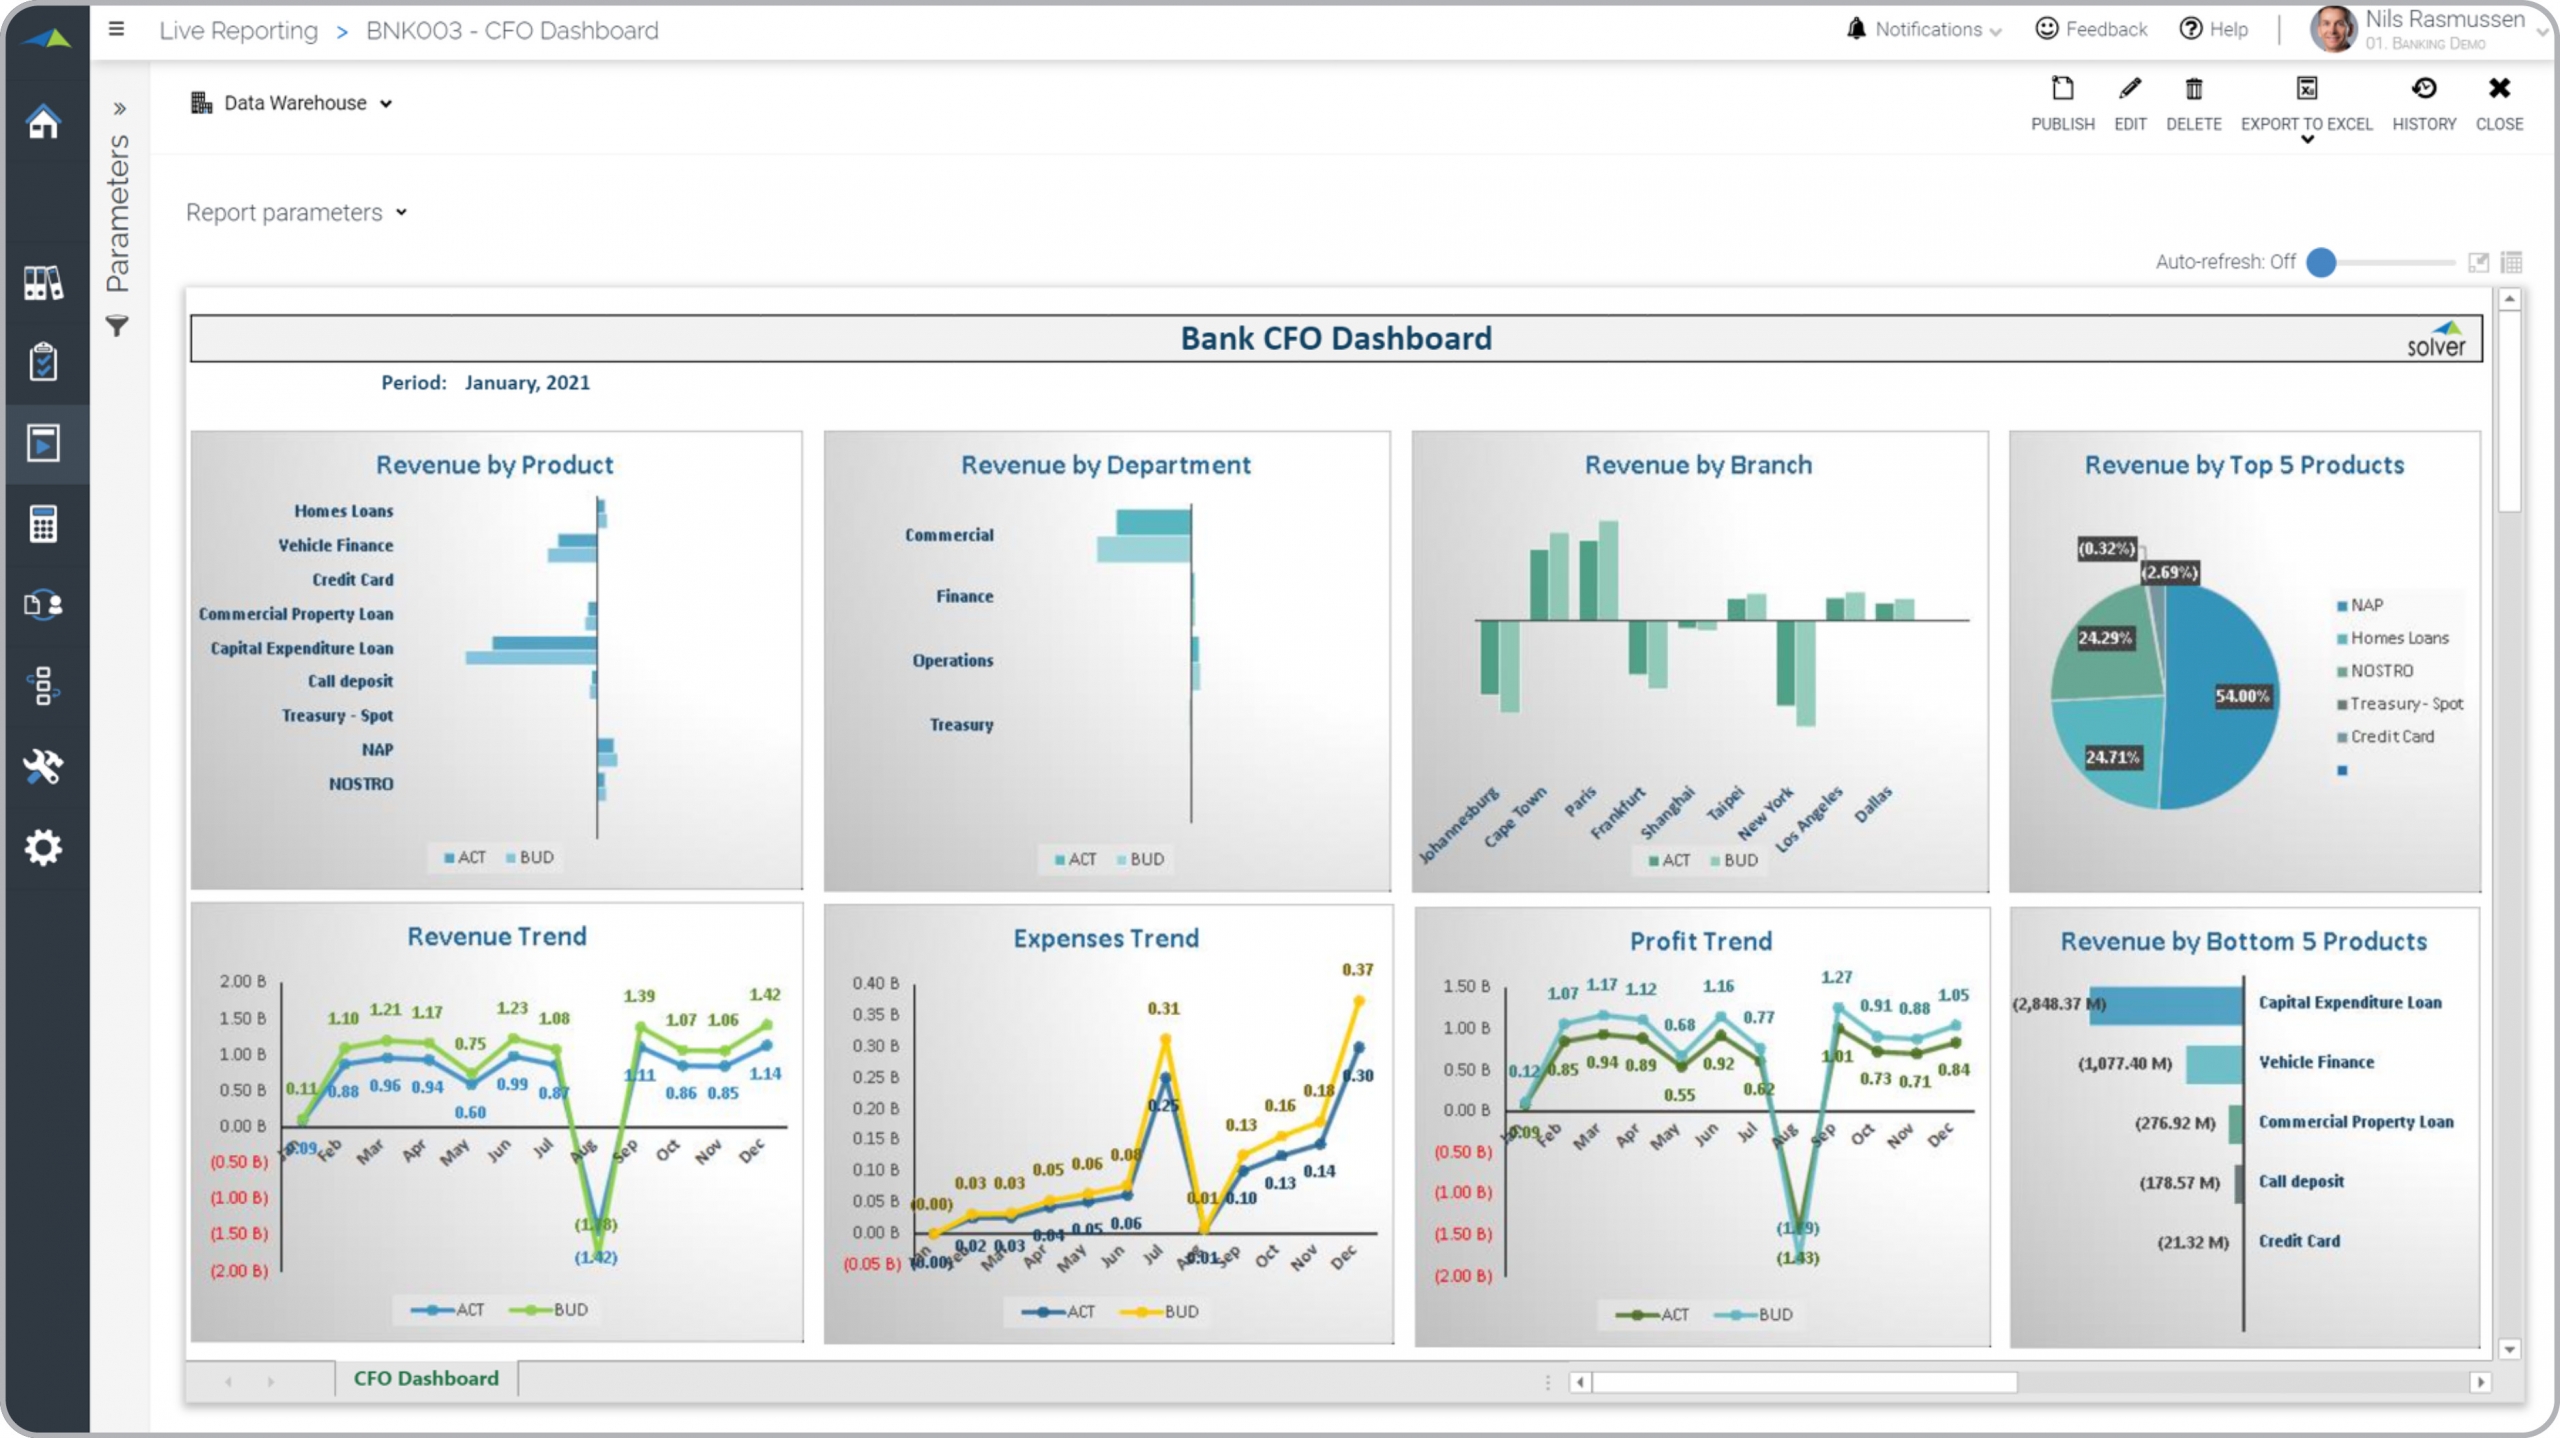
CFO Dashboard for Banks
What is a CFO Dashboard for Banks ? CFO Dashboards are considered financial analysis tools and are ...
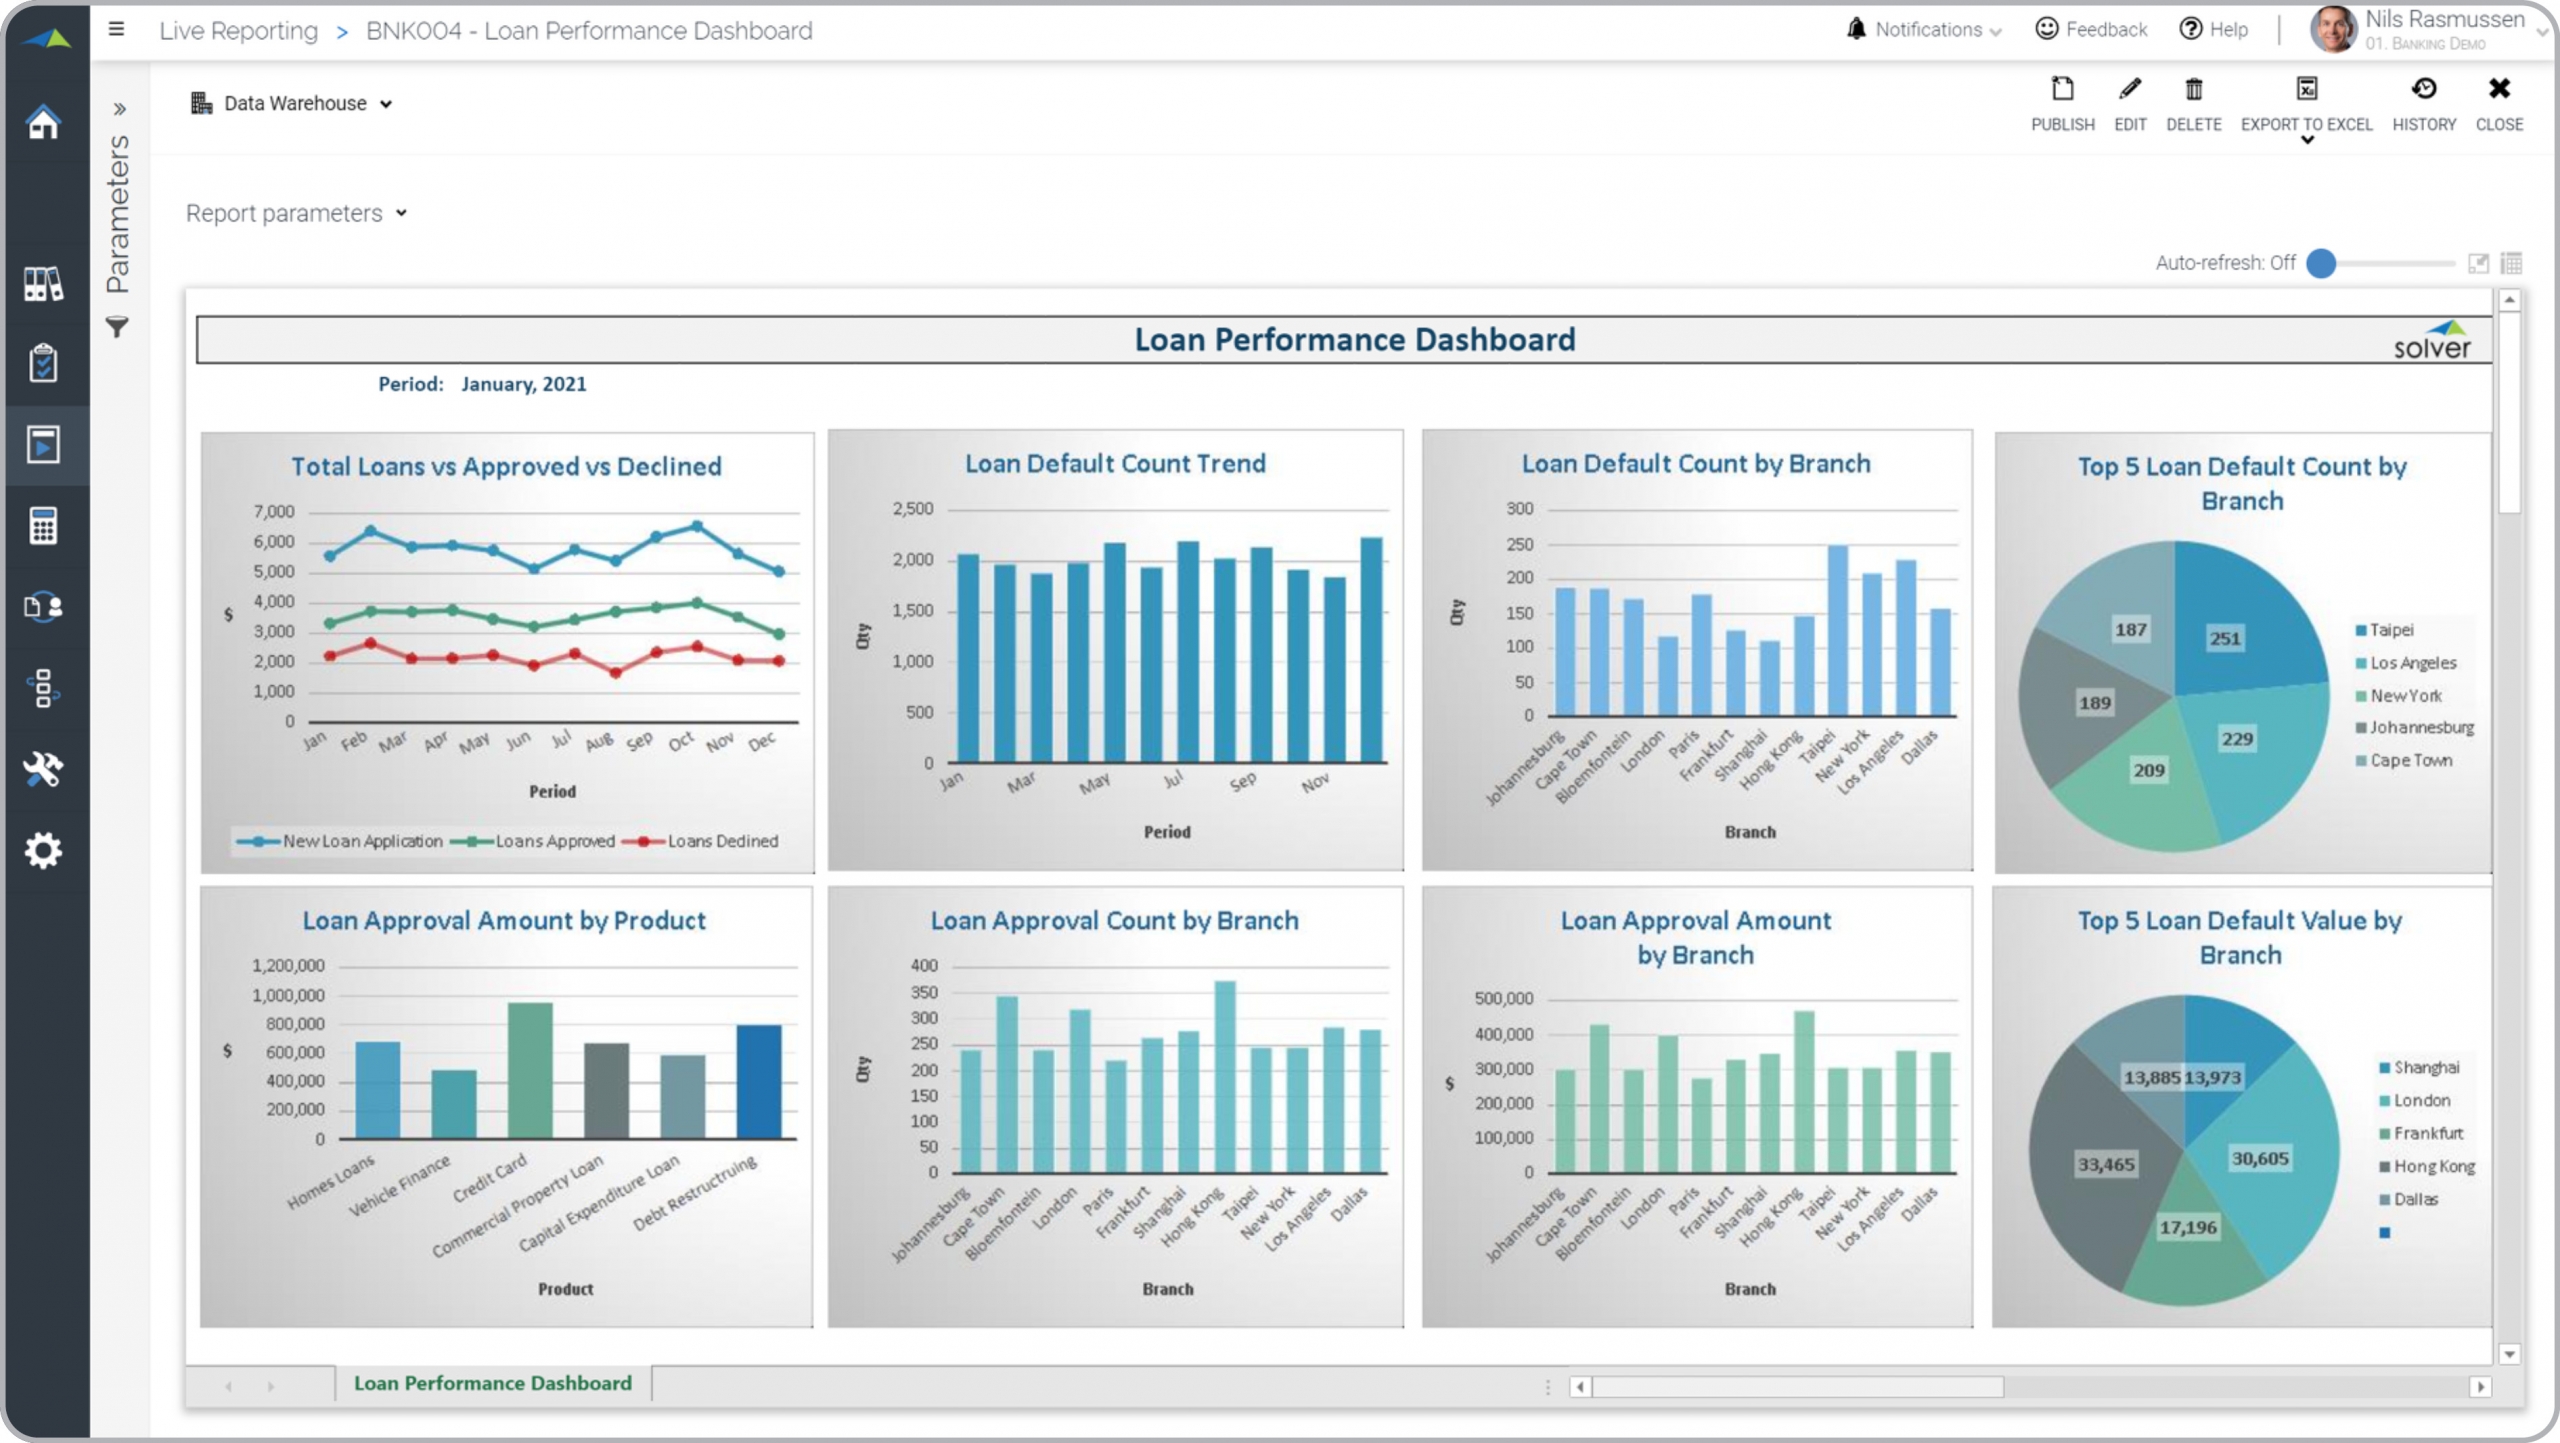
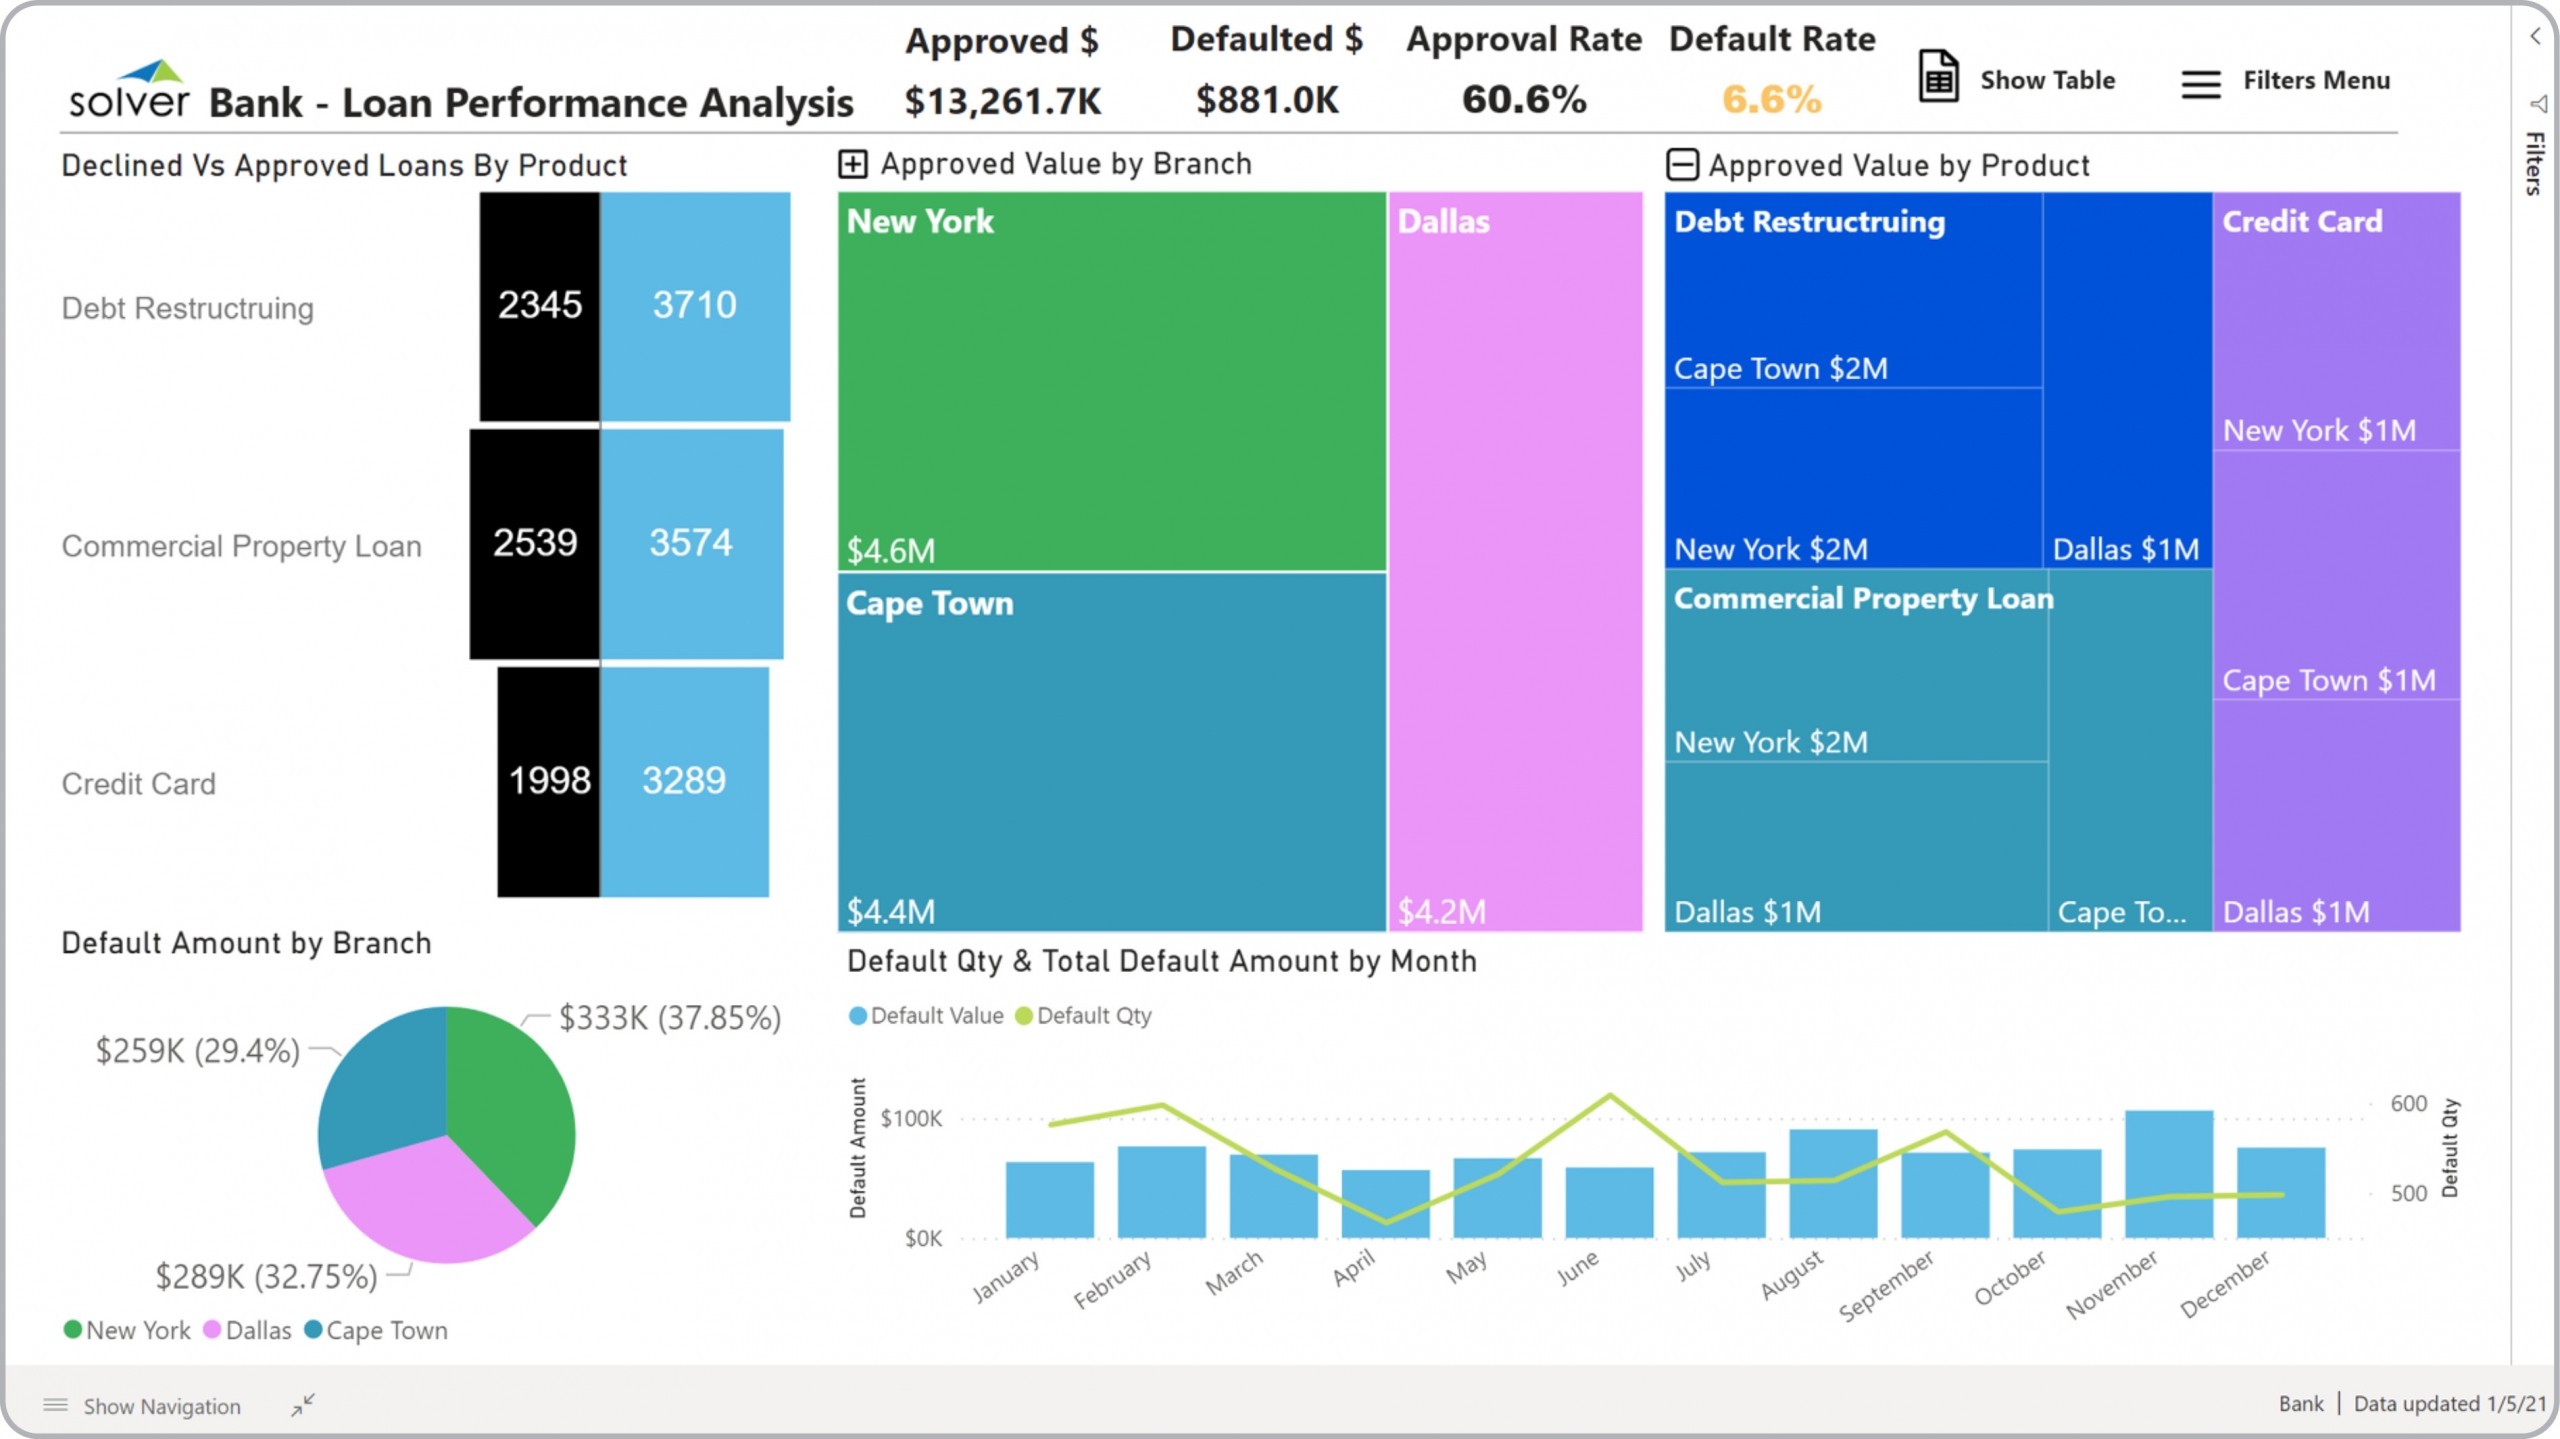
Loan Performance Dashboard for Banks
What is a Loan Performance Dashboard for Banks ? Loan Performance Dashboards are considered ...
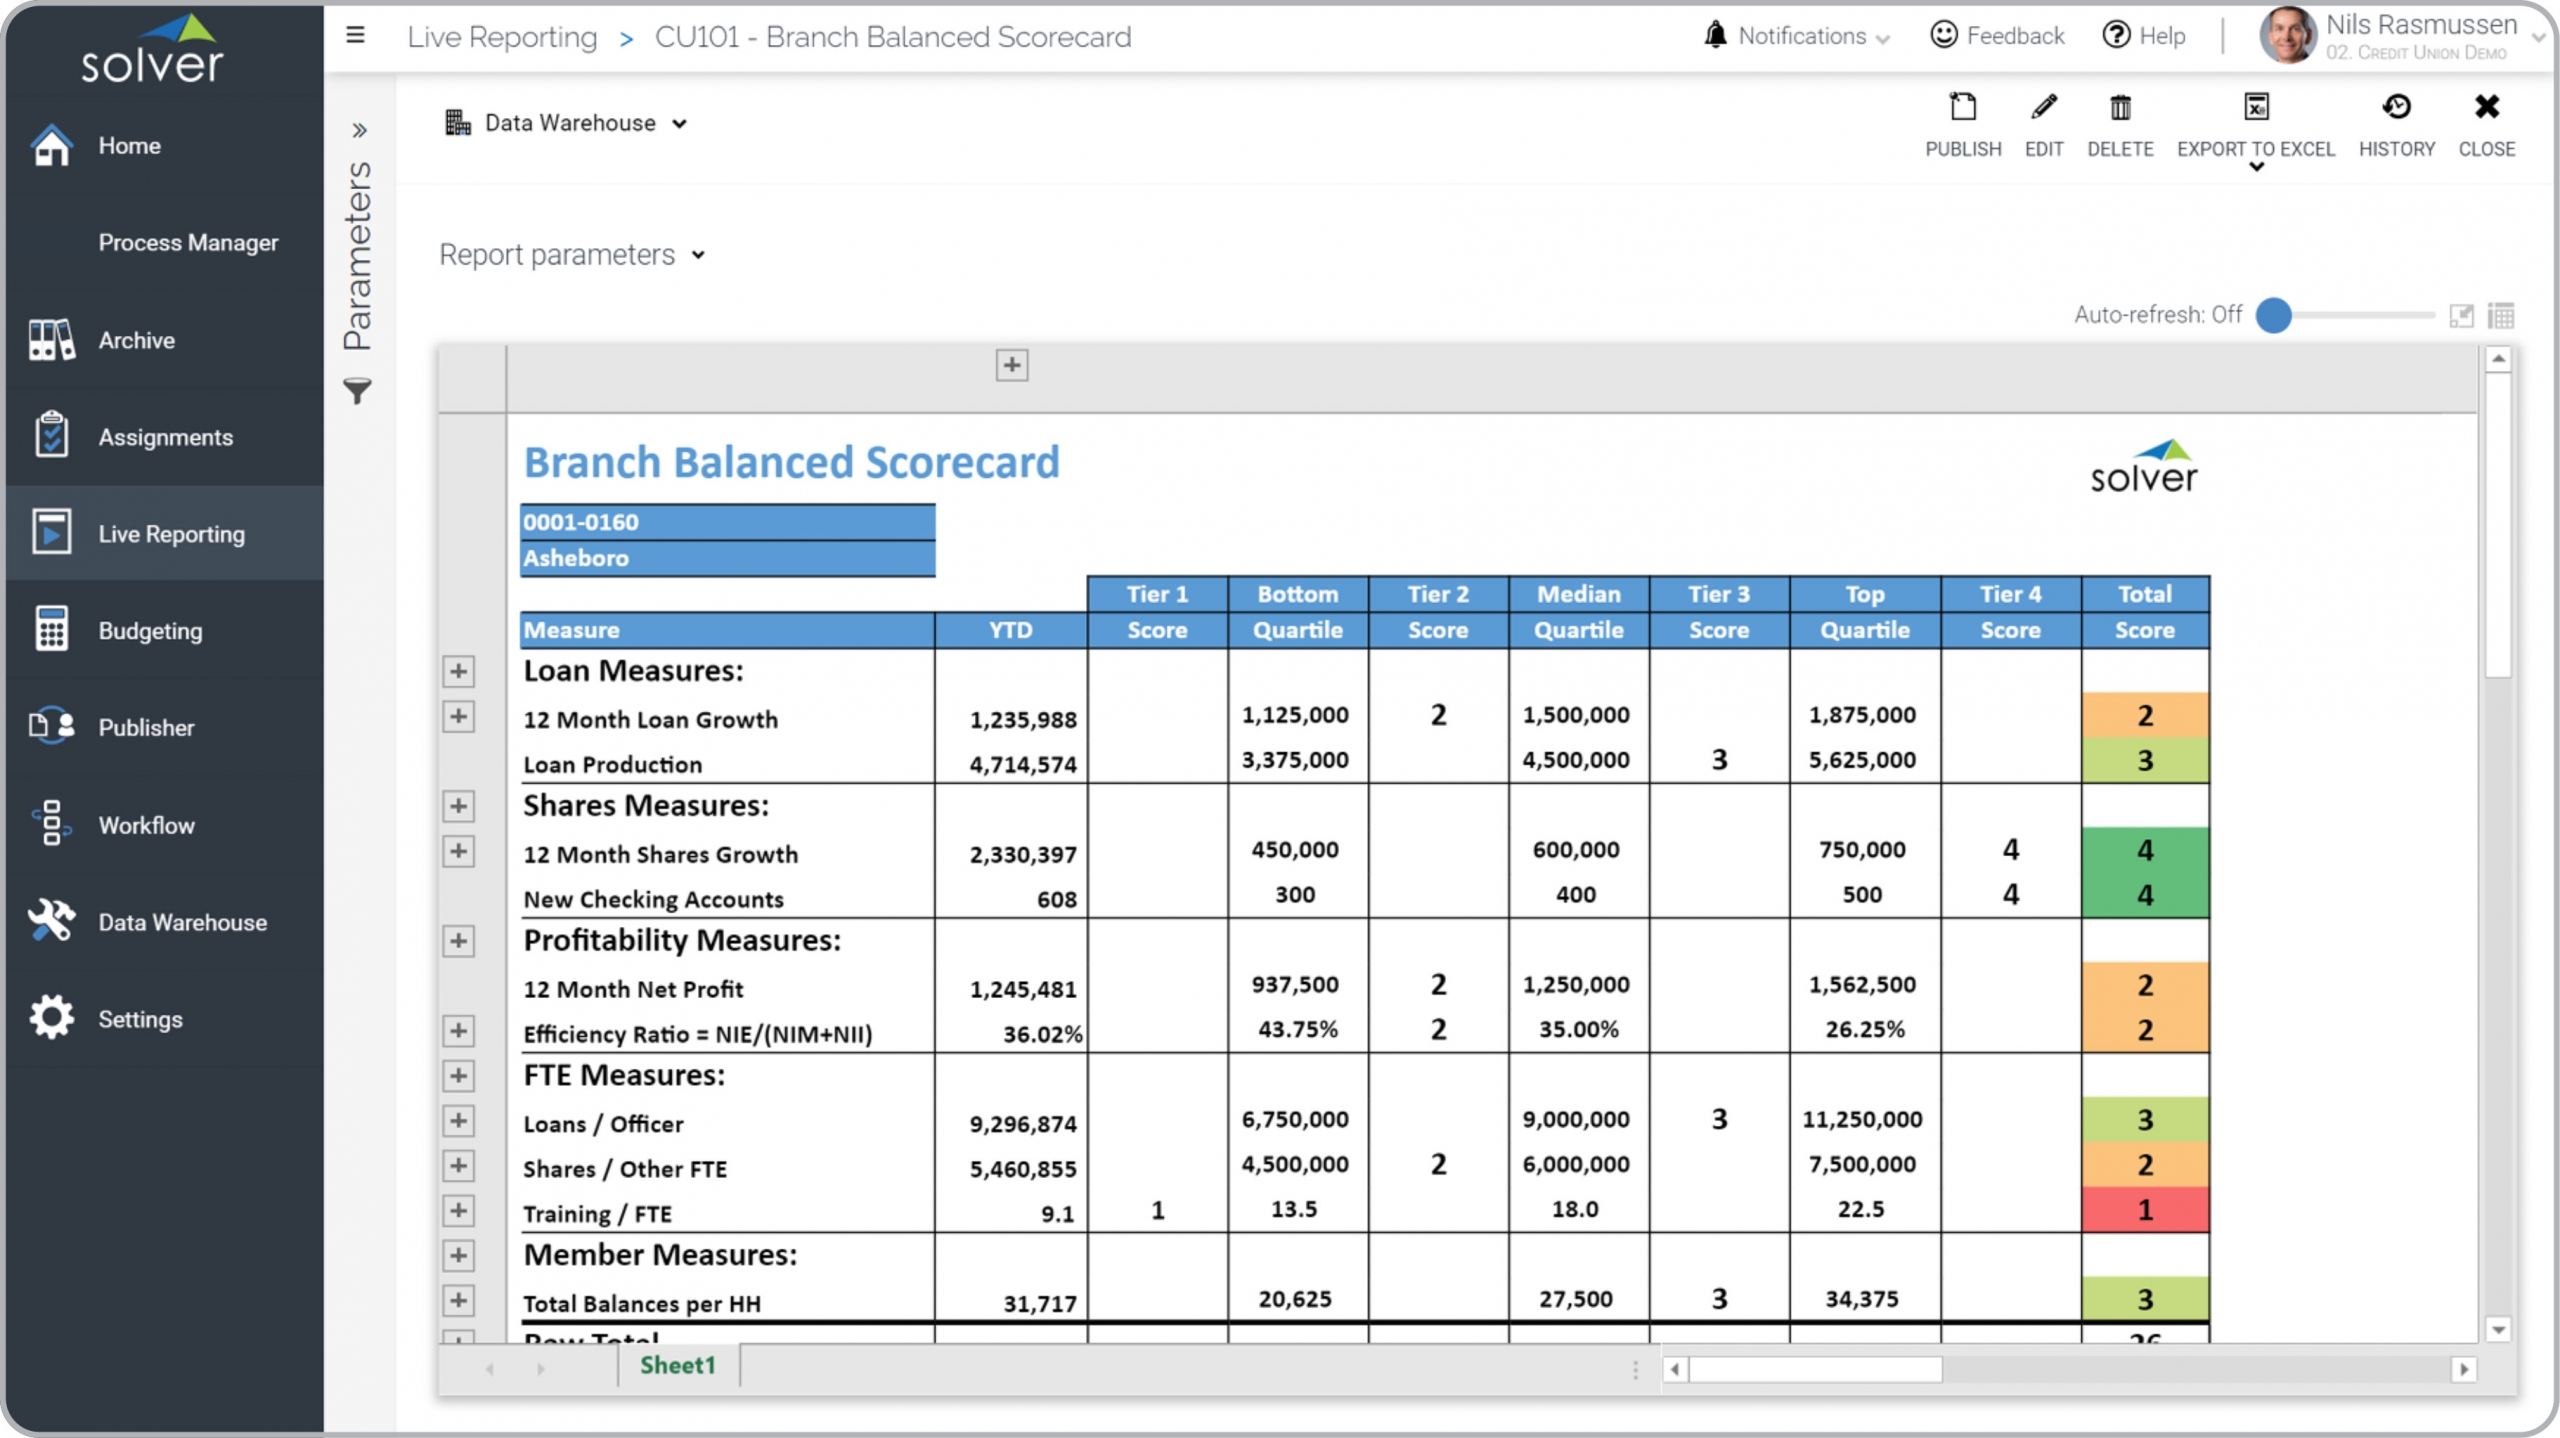
Balanced Scorecard Report for Credit Union Branches
What is a Balanced Scorecard ? Balanced Scorecard Reports are considered KPI tools and are used by ...
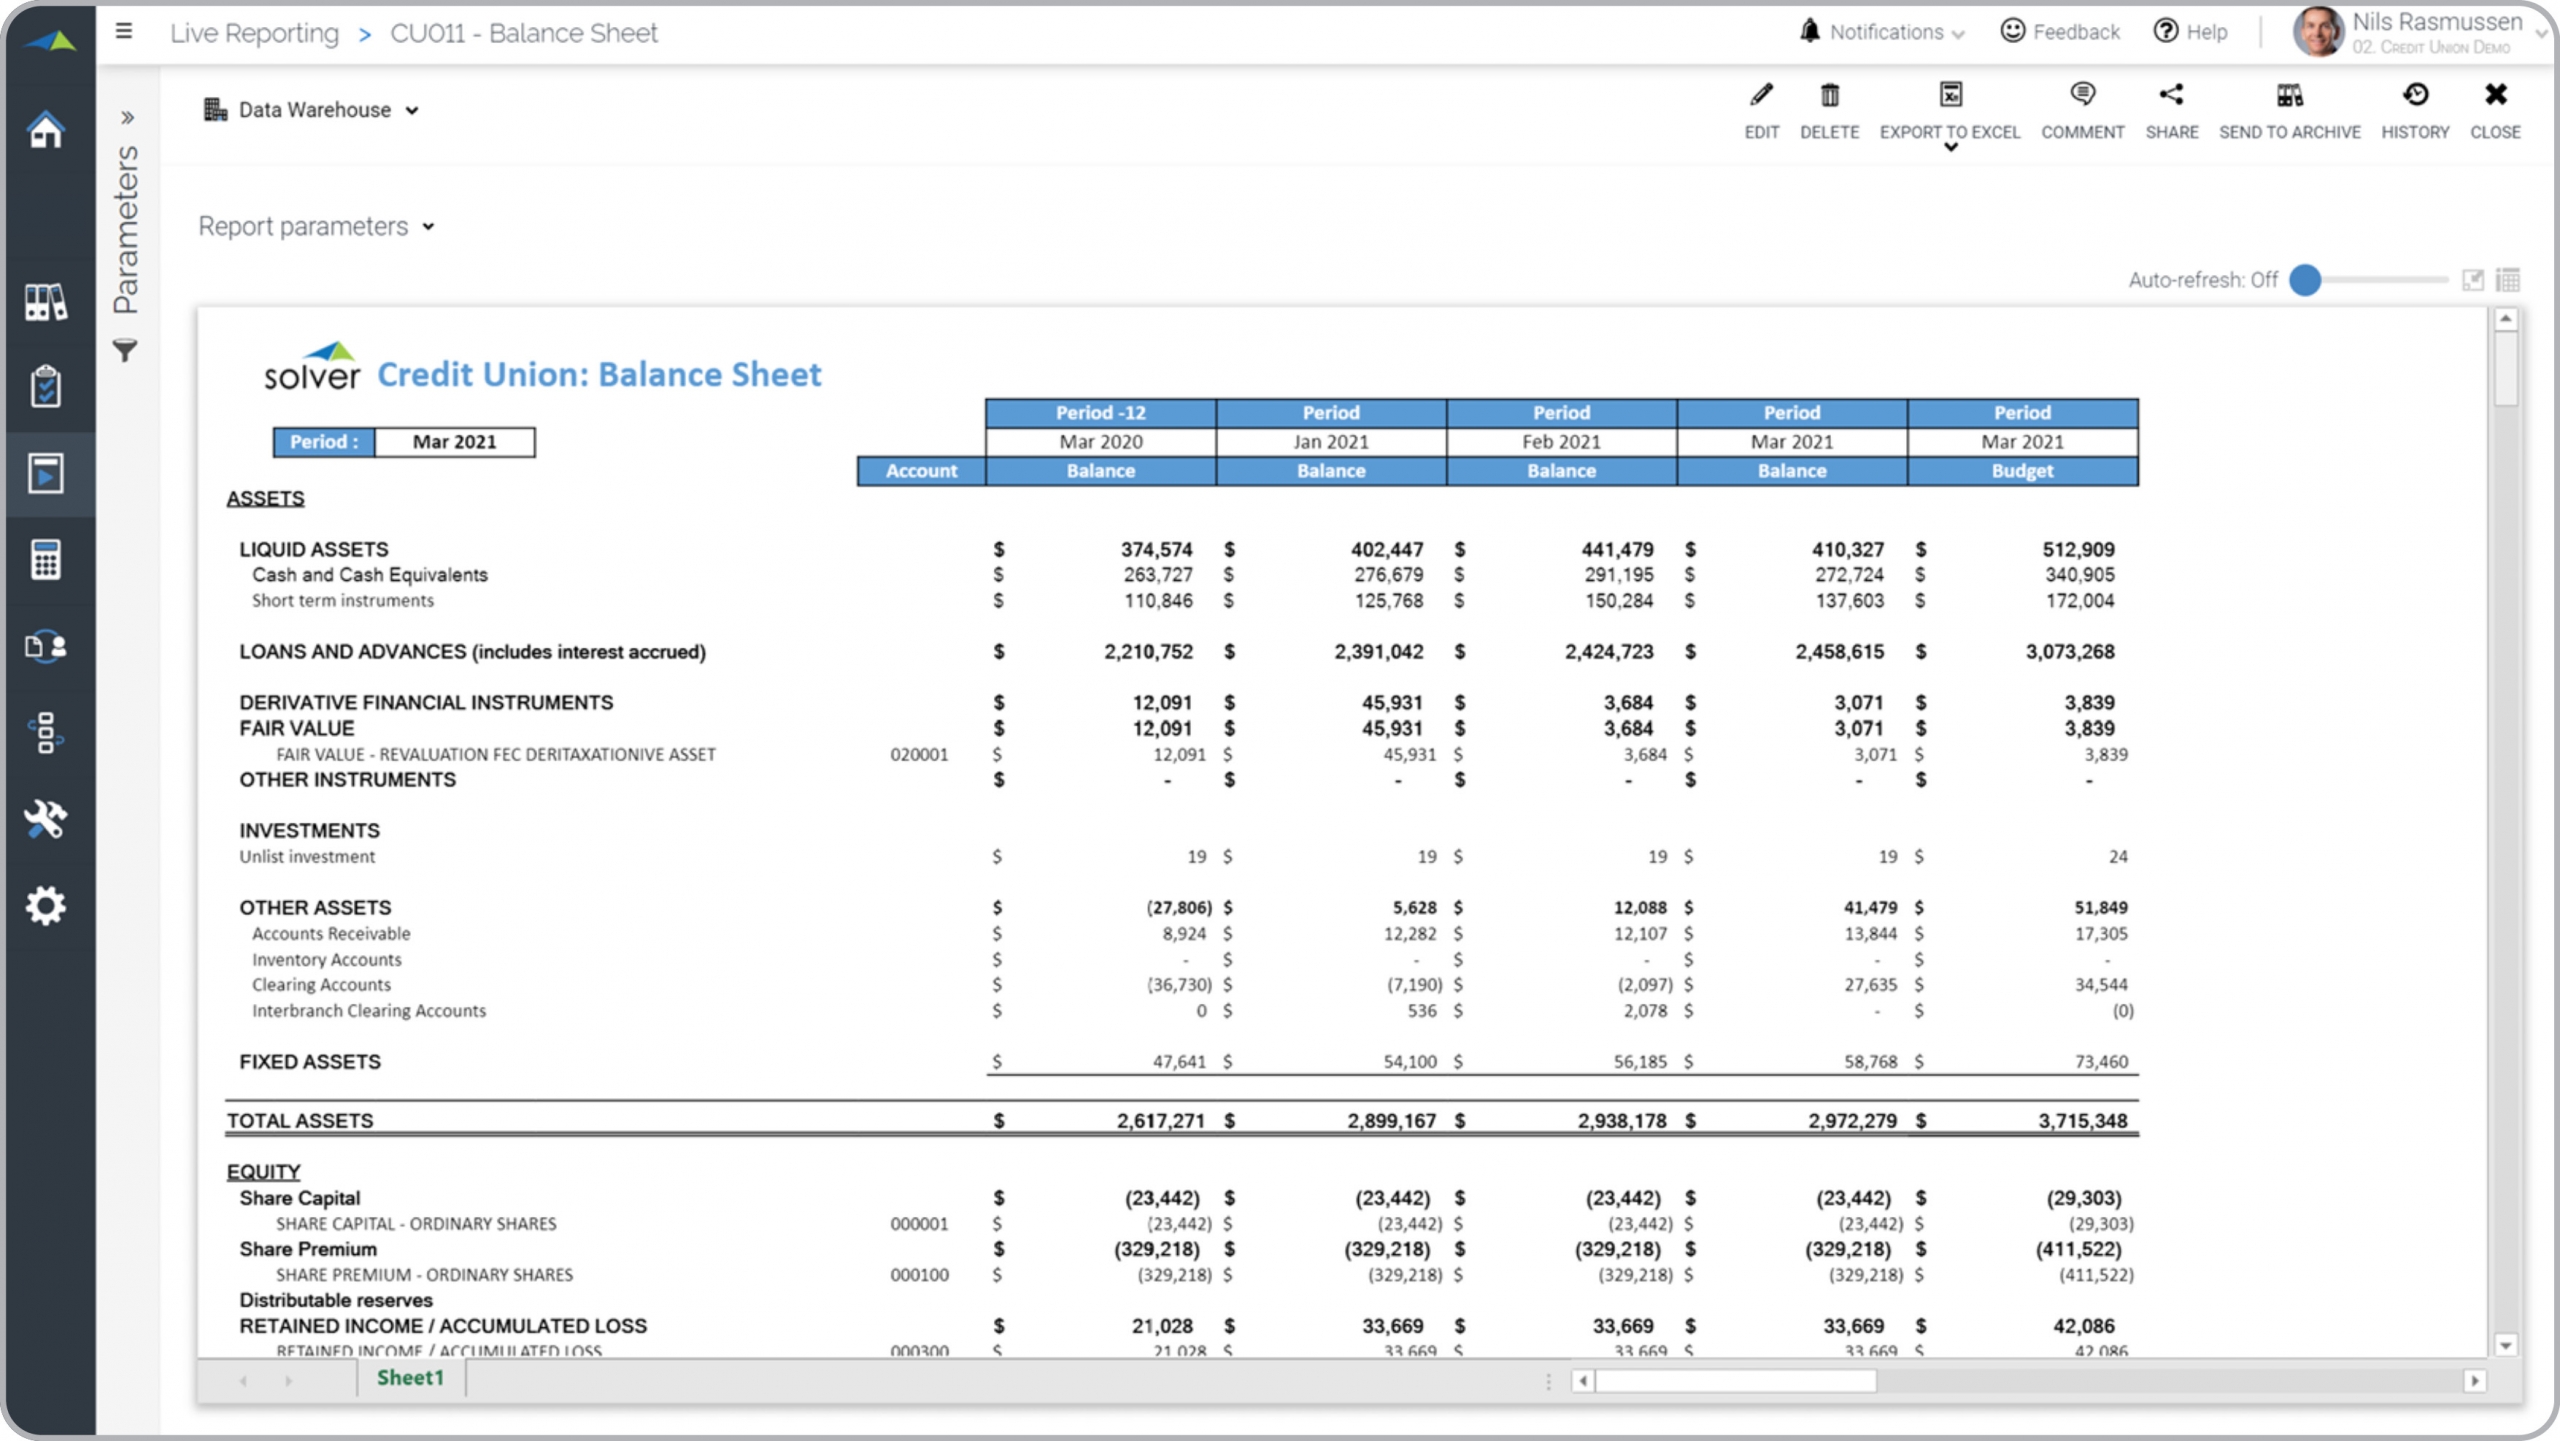
Trended Balance Sheet for Credit Unions
What is a Trended Balance Sheet ? Trended Balance Sheets are considered analytical financial ...
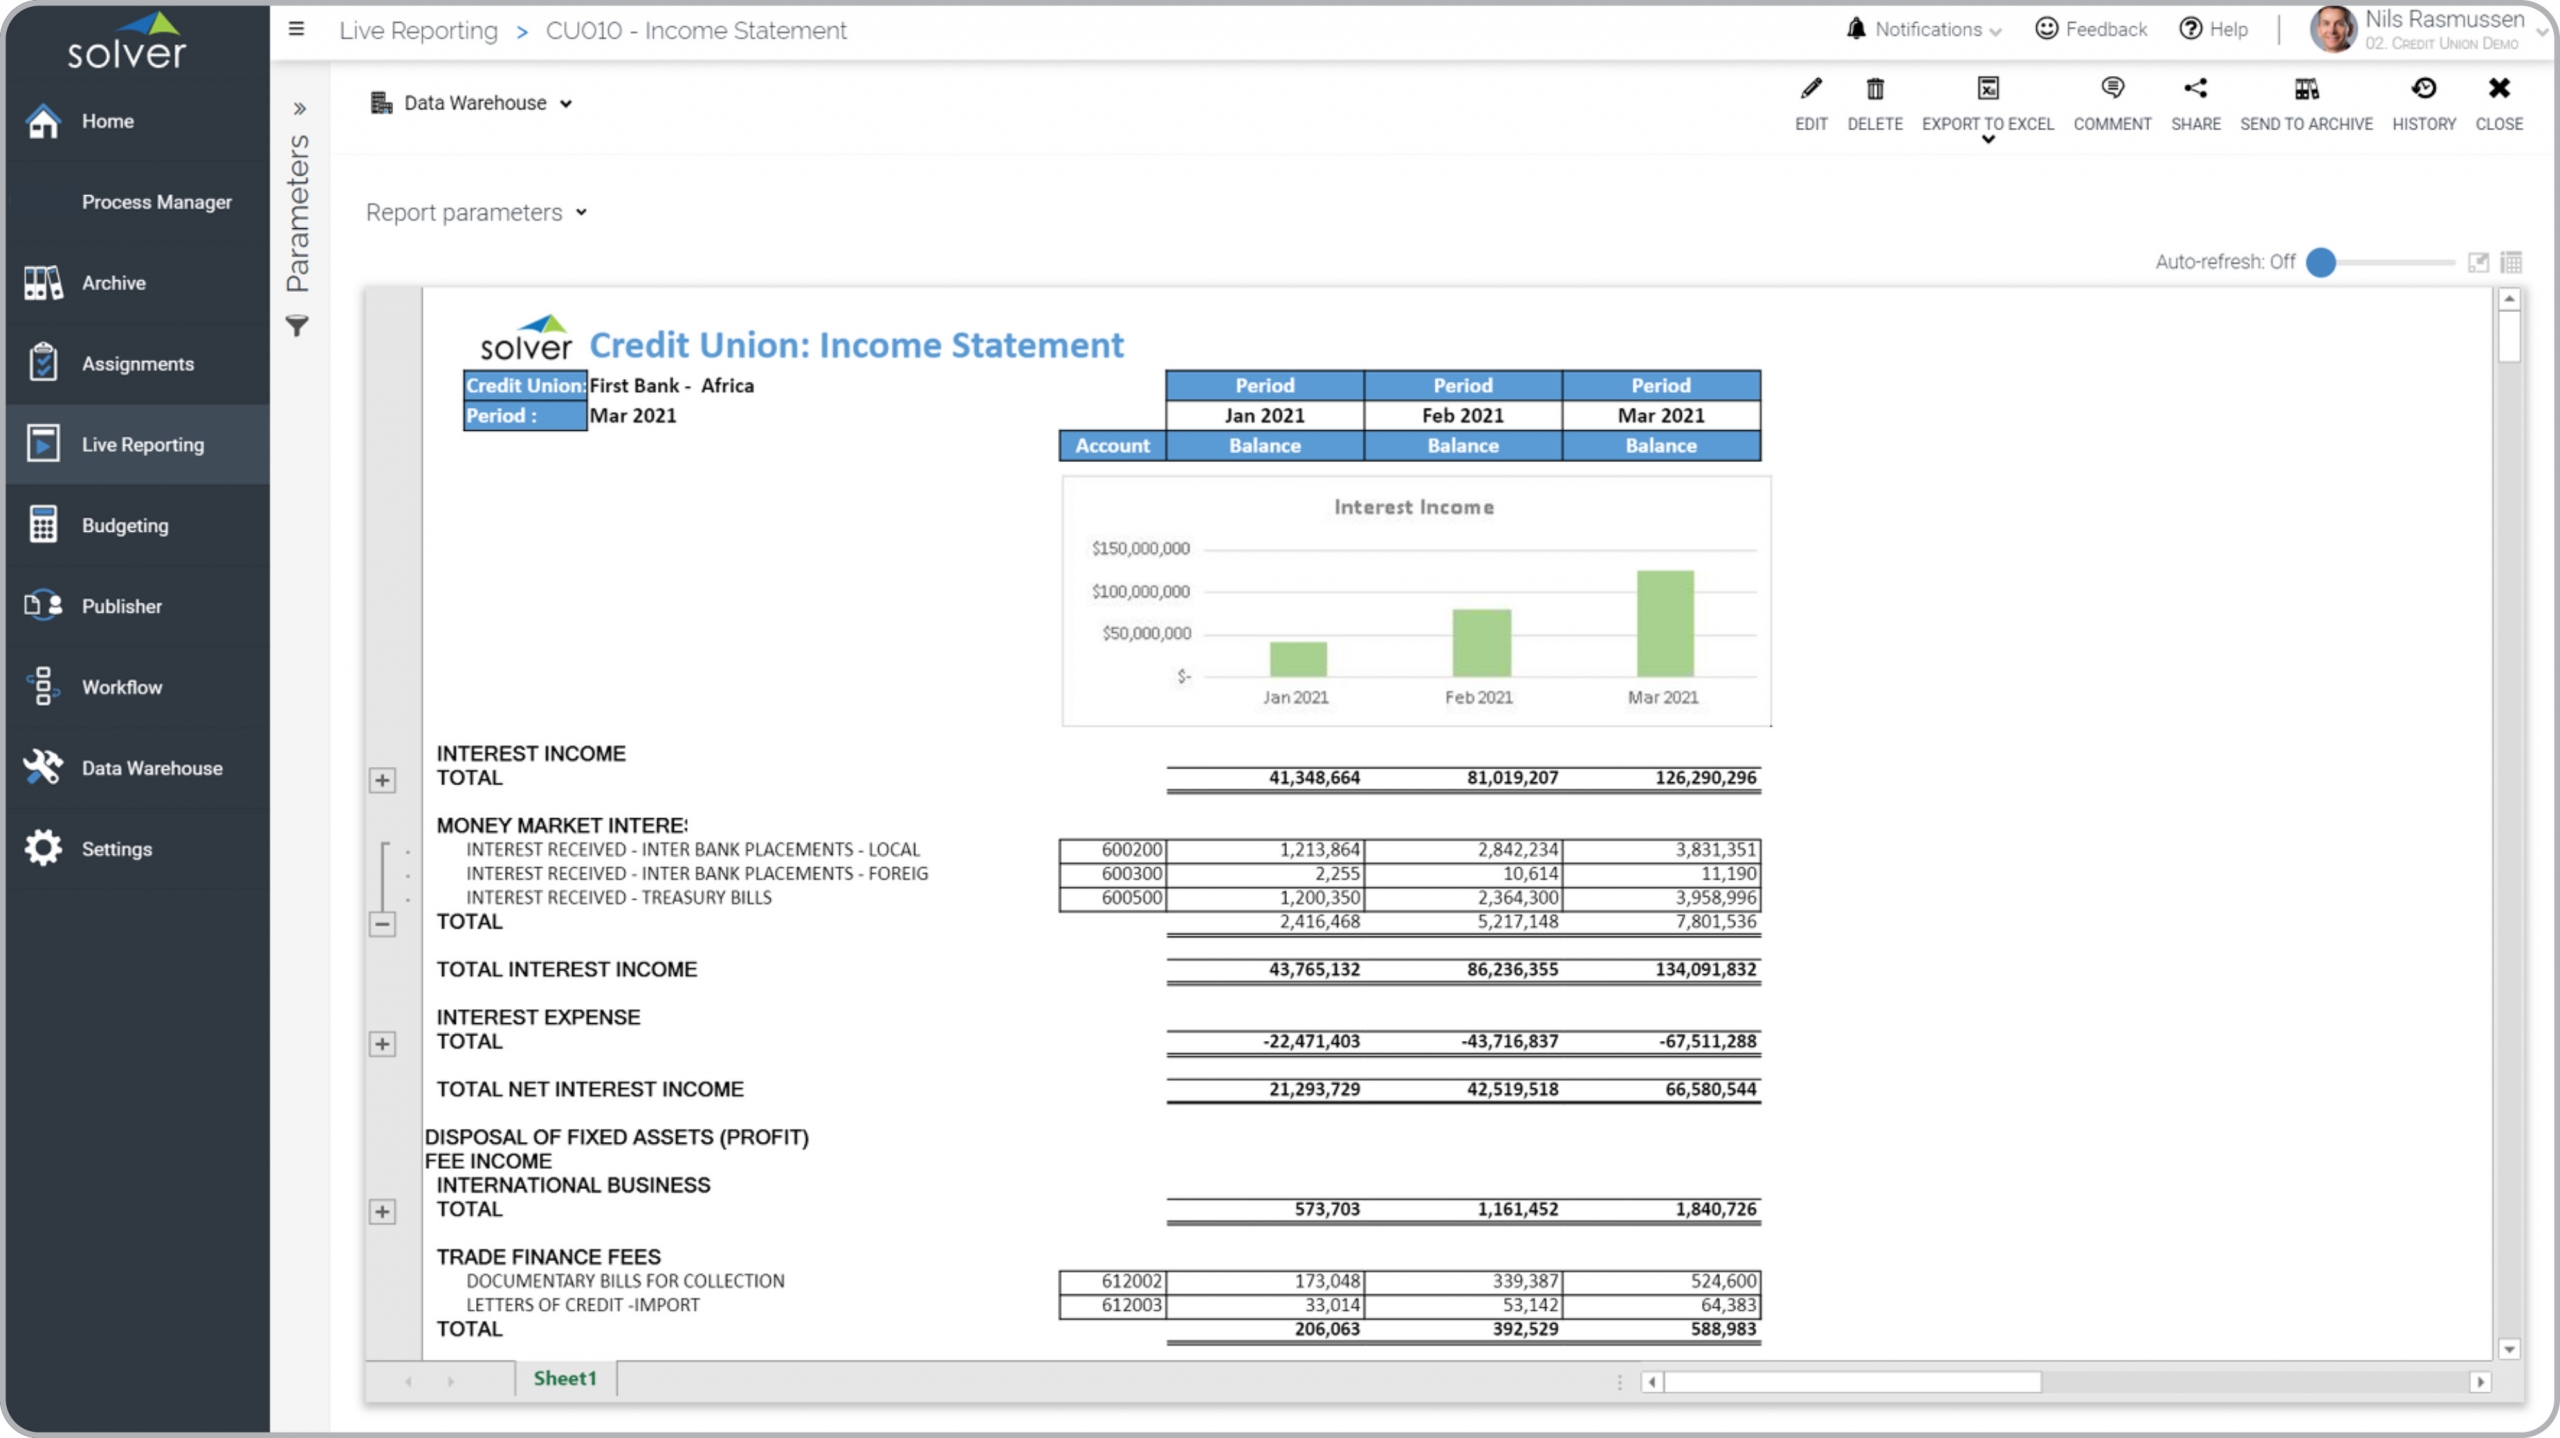
Trended Income Statement for Credit Unions
What is a Trended Income Statement ? Trended Income Statements are considered core financial ...
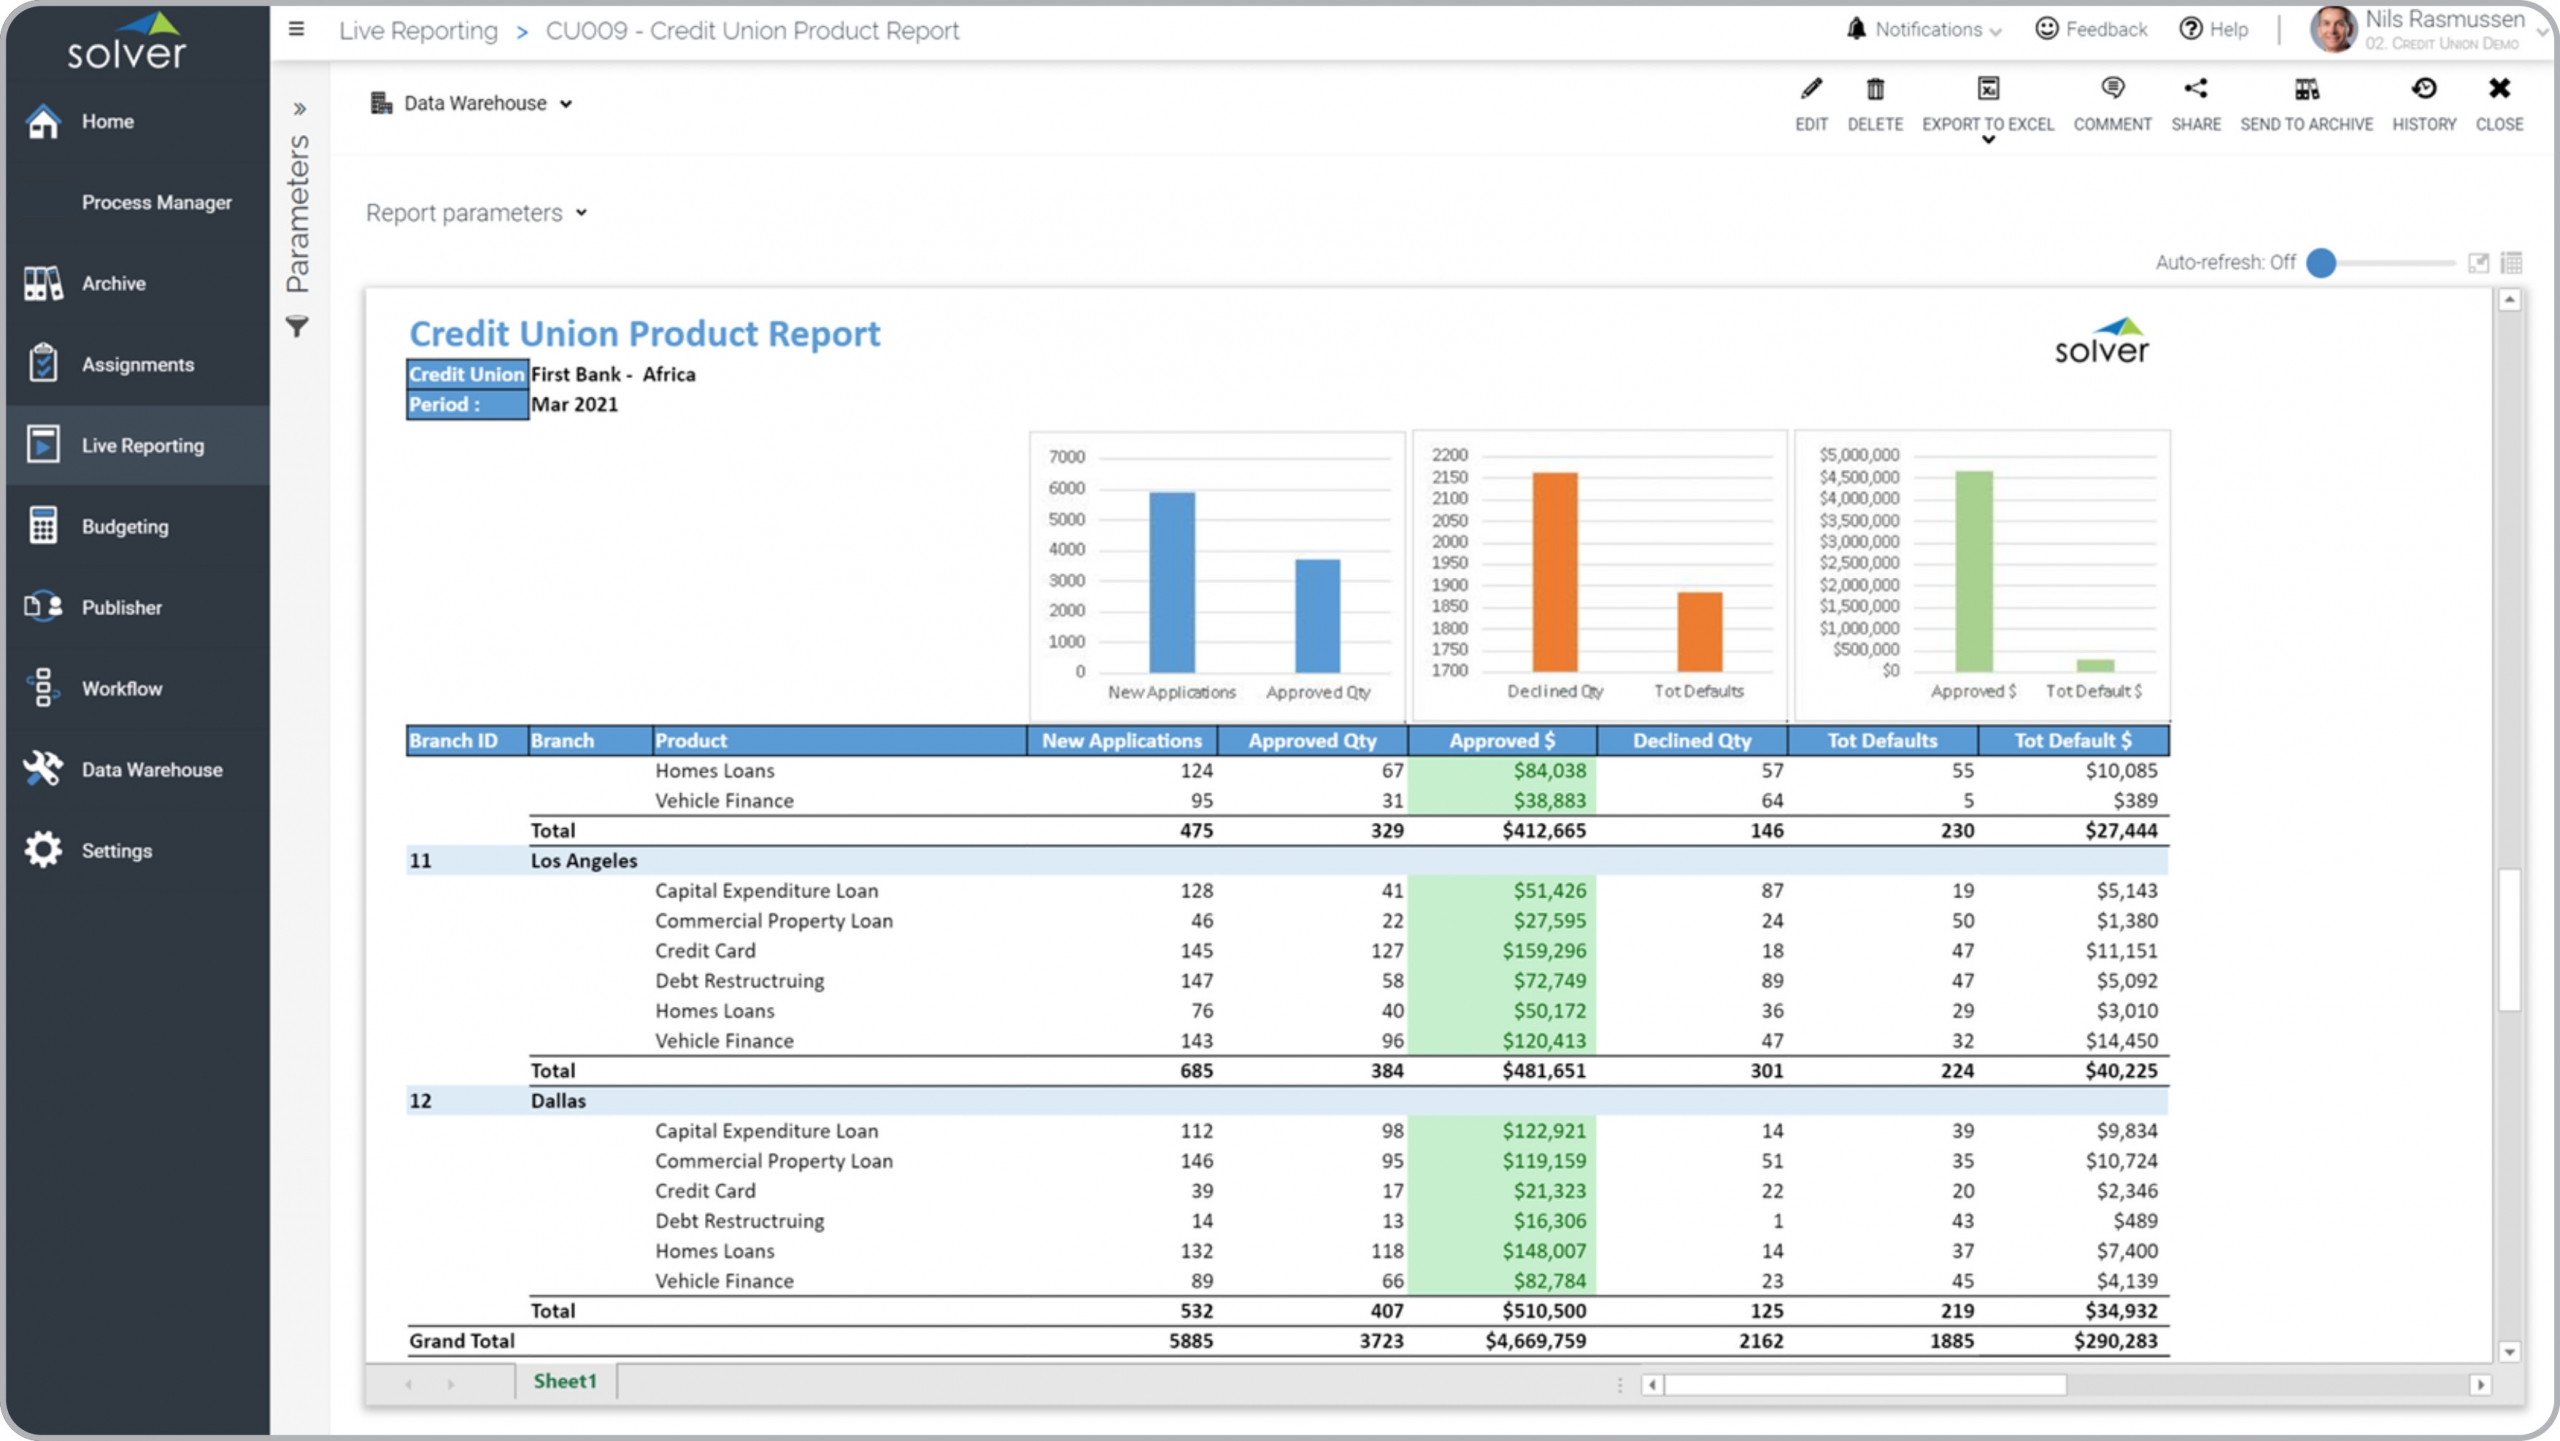
Product KPI Report for Credit Unions
What is a Product KPI Report ? Product KPI Reports are considered operational analysis tools and ...
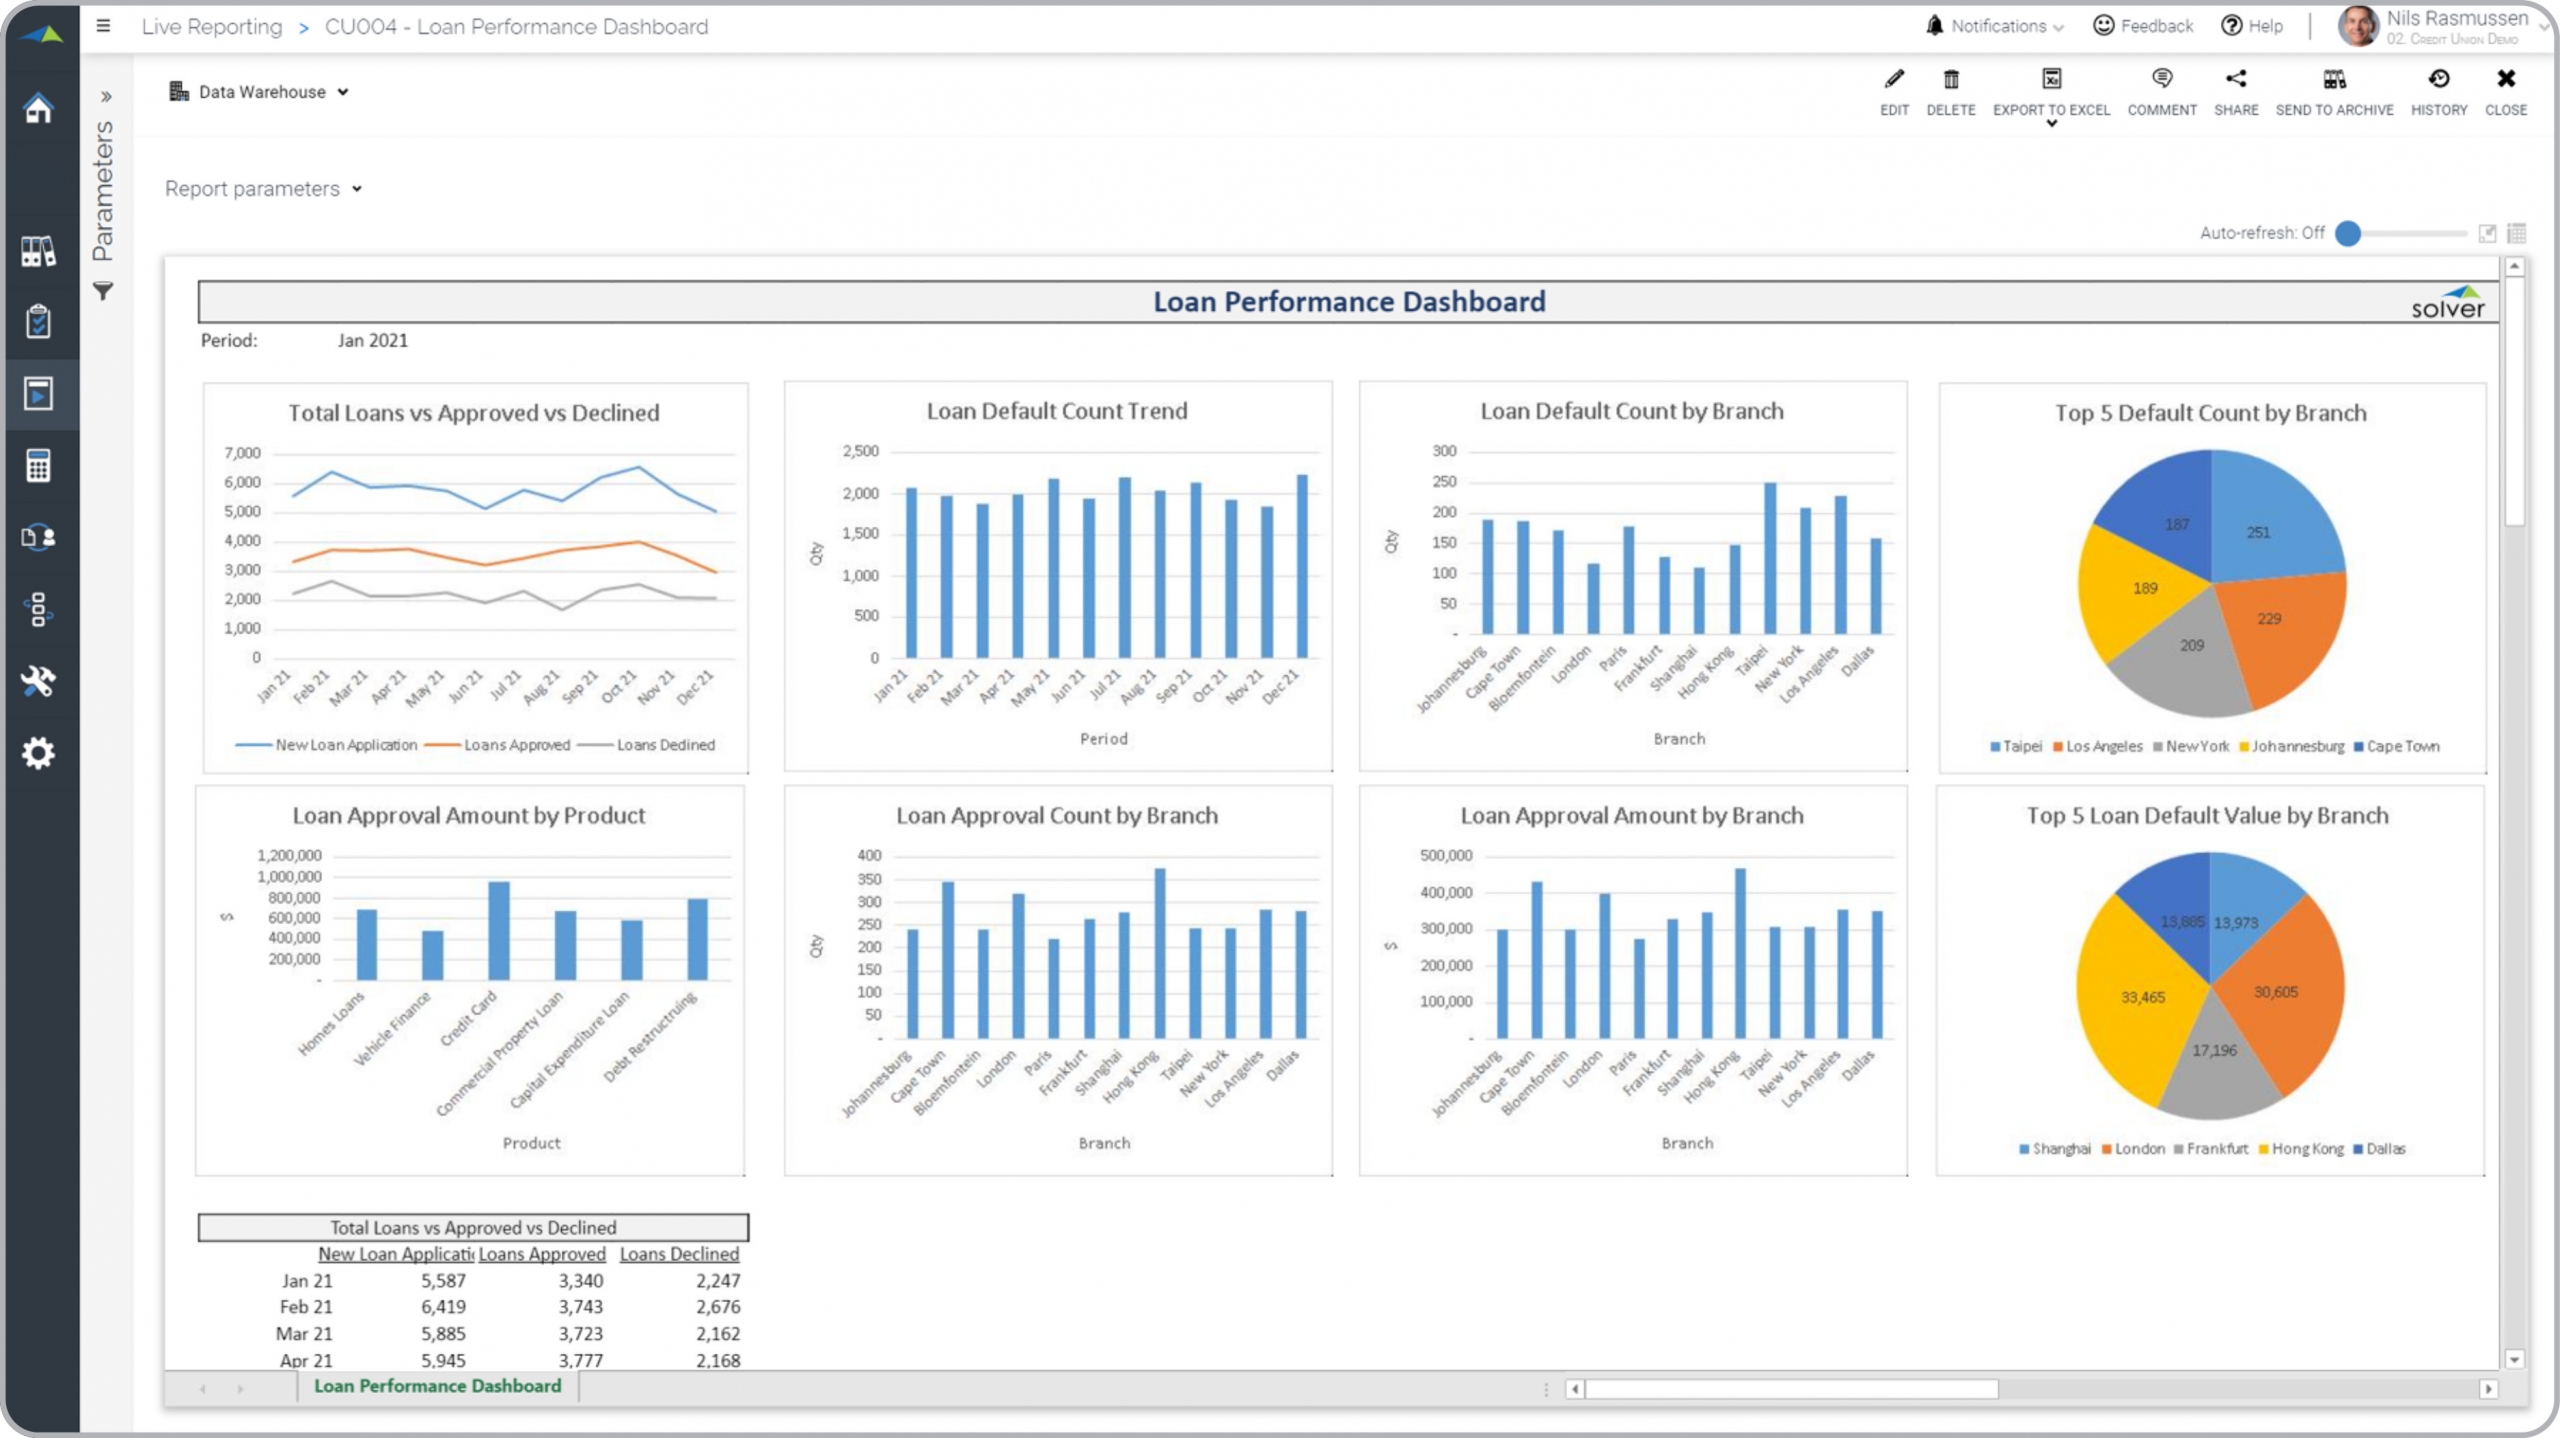
Loan Performance Dashboard for Credit Unions
What is a Loan Performance Dashboard ? Loan Performance Dashboards are considered operational ...
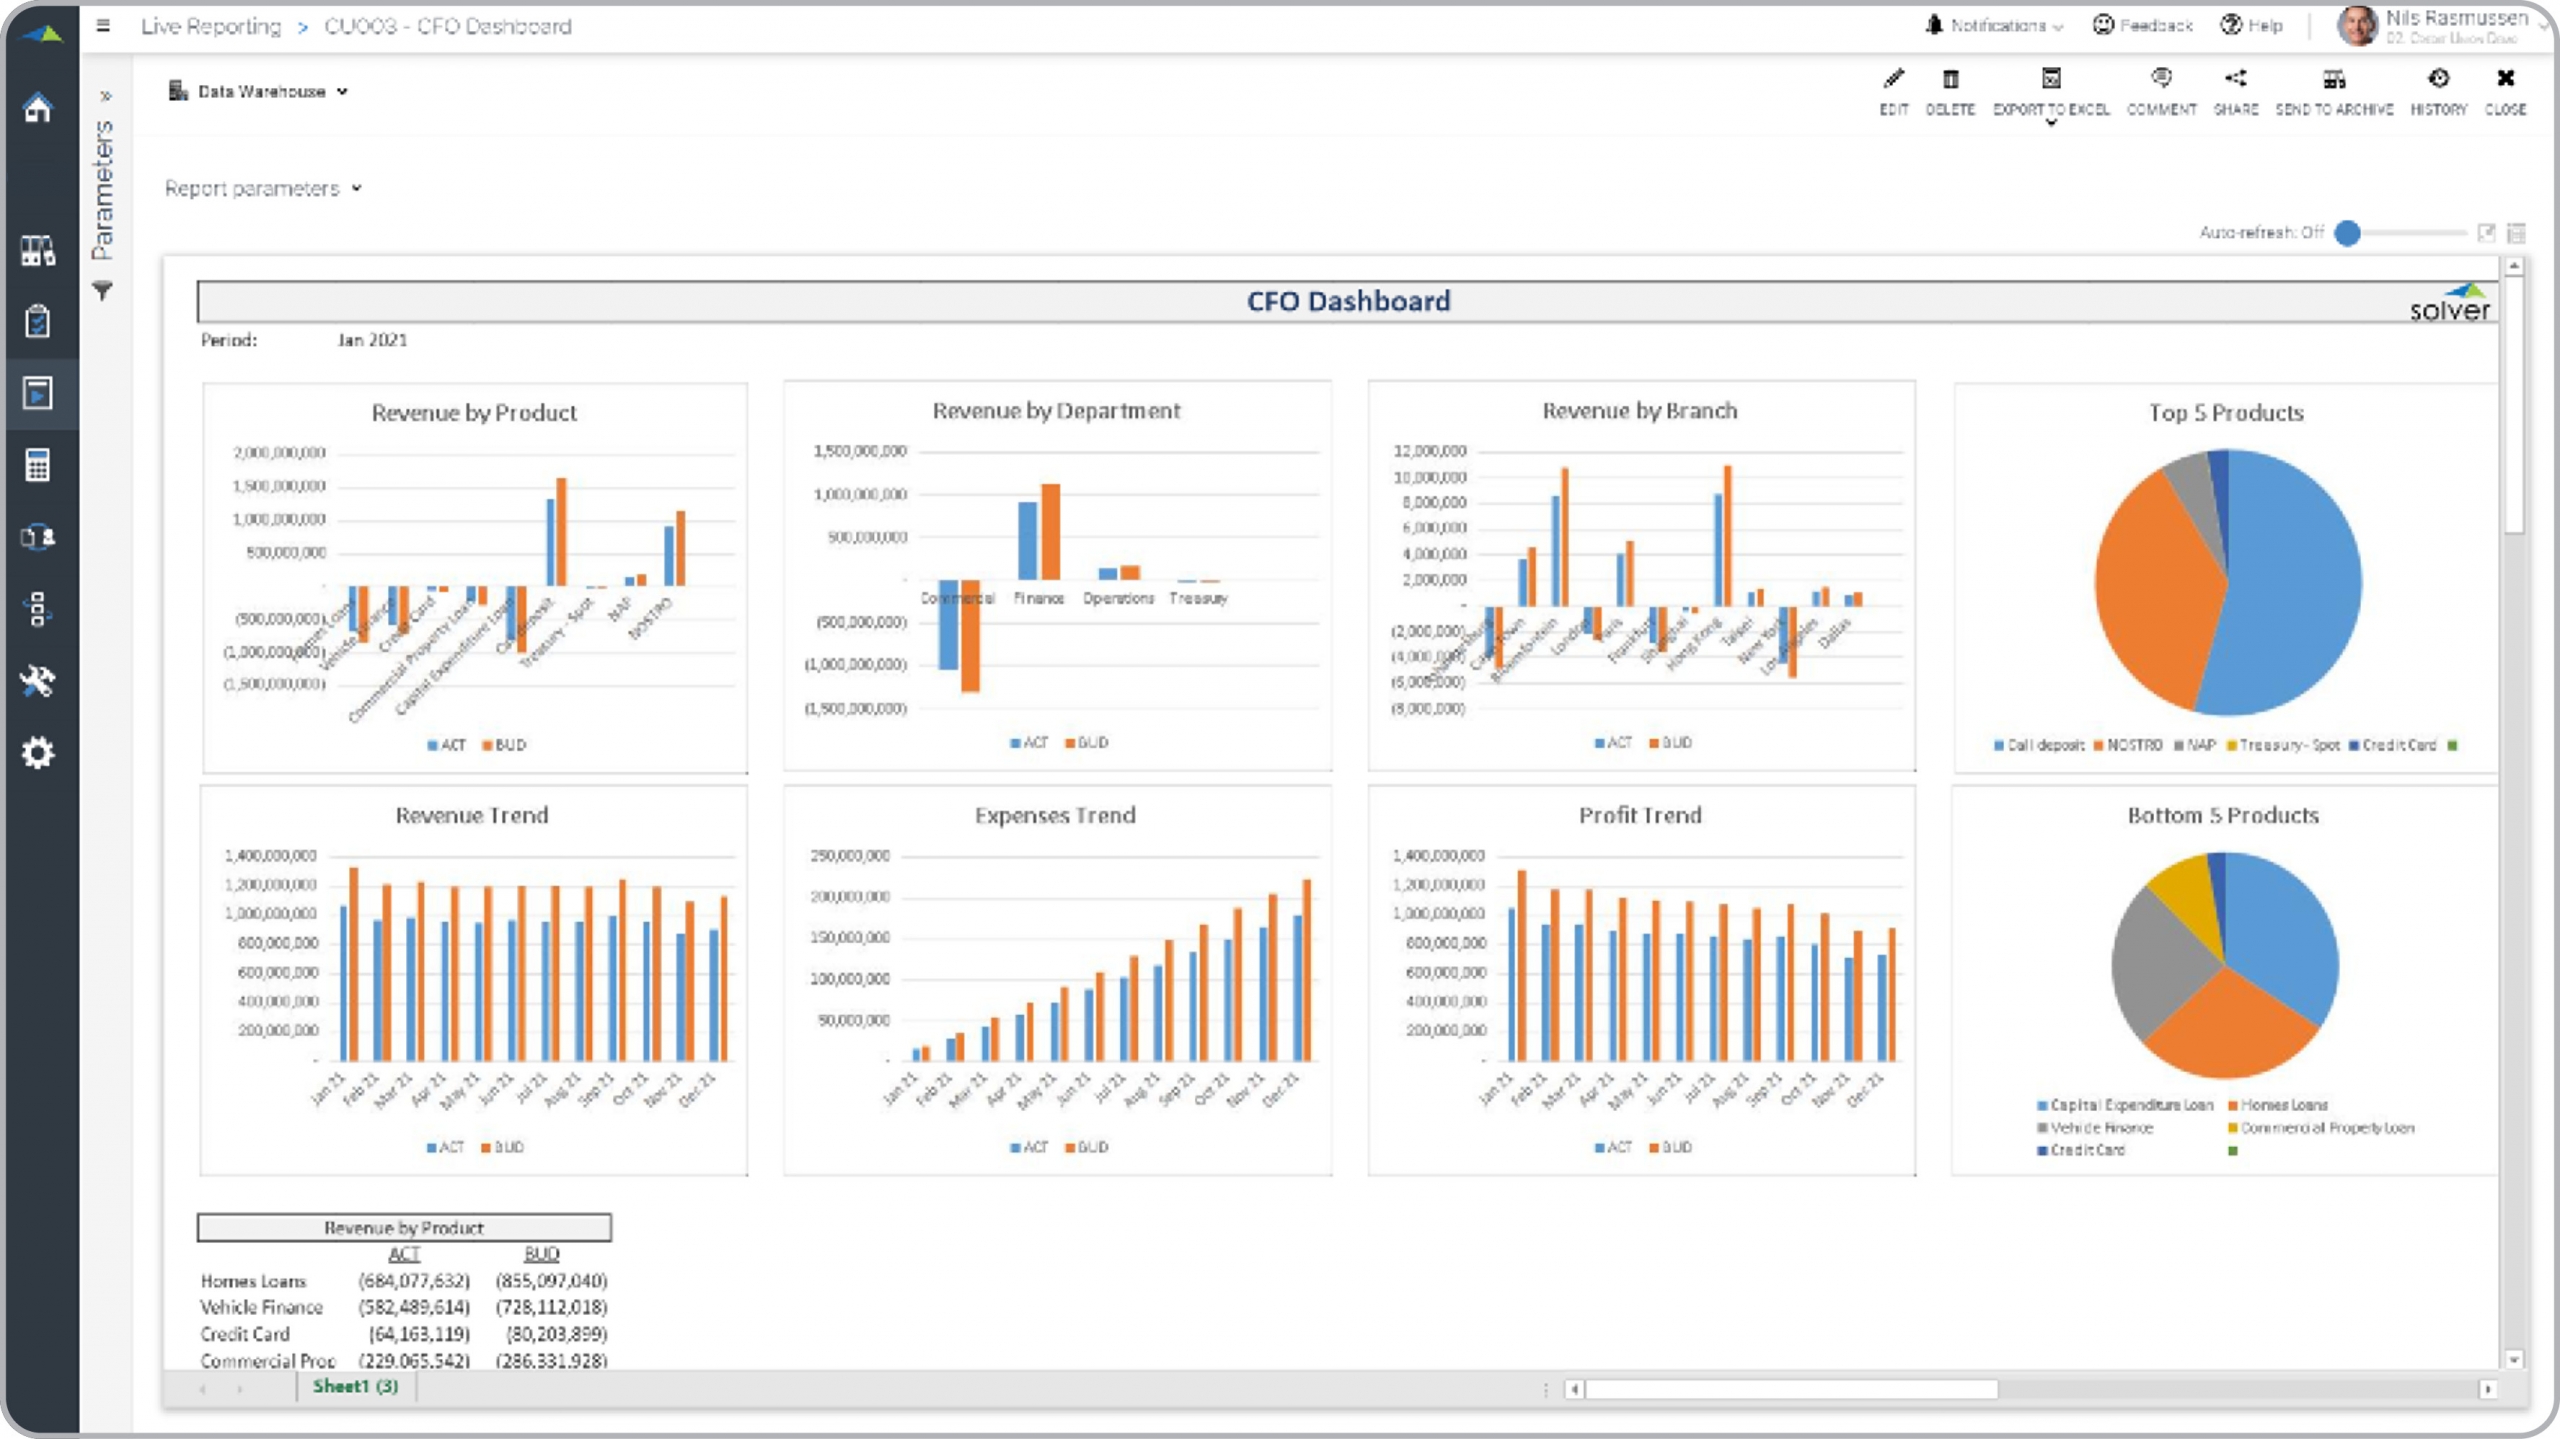
CFO Dashboard for Credit Unions
What is a CFO Dashboard ? CFO Dashboards are considered financial analysis tools and are used by ...
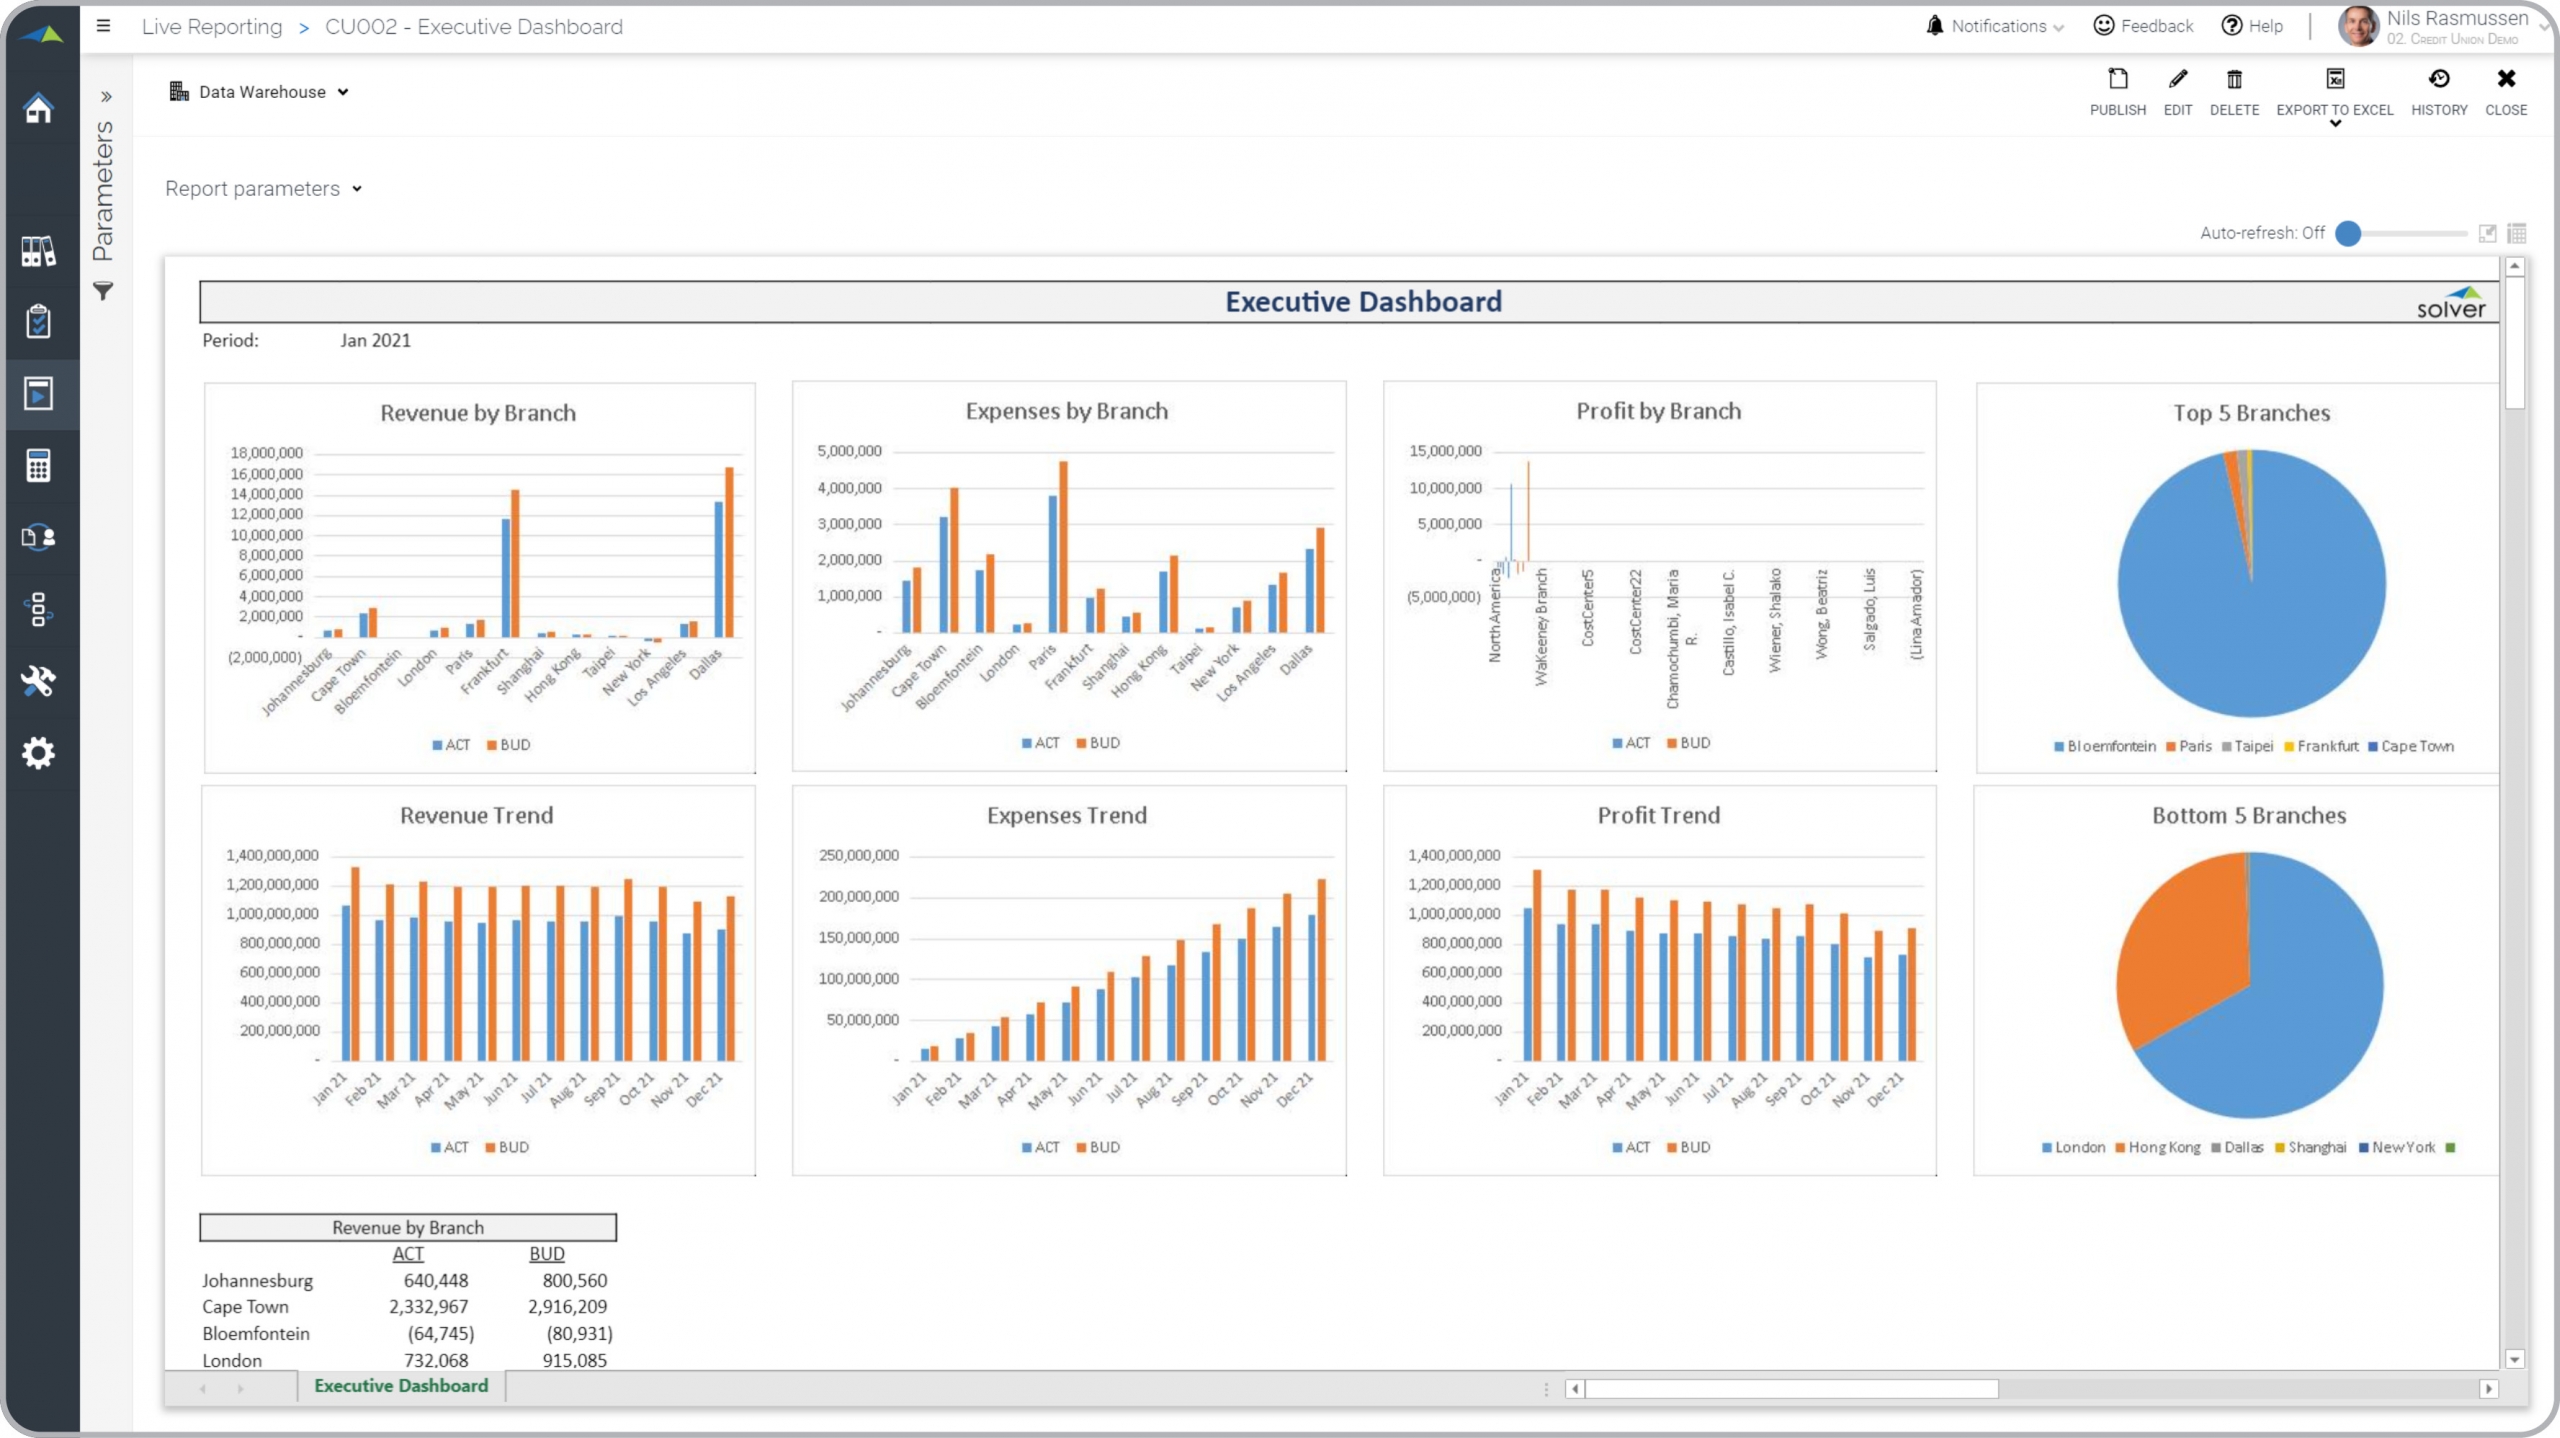
Example of an Executive Dashboard for Credit Unions
What is an Executive Dashboard for Credit Unions ? Executive Dashboards are considered analysis ...
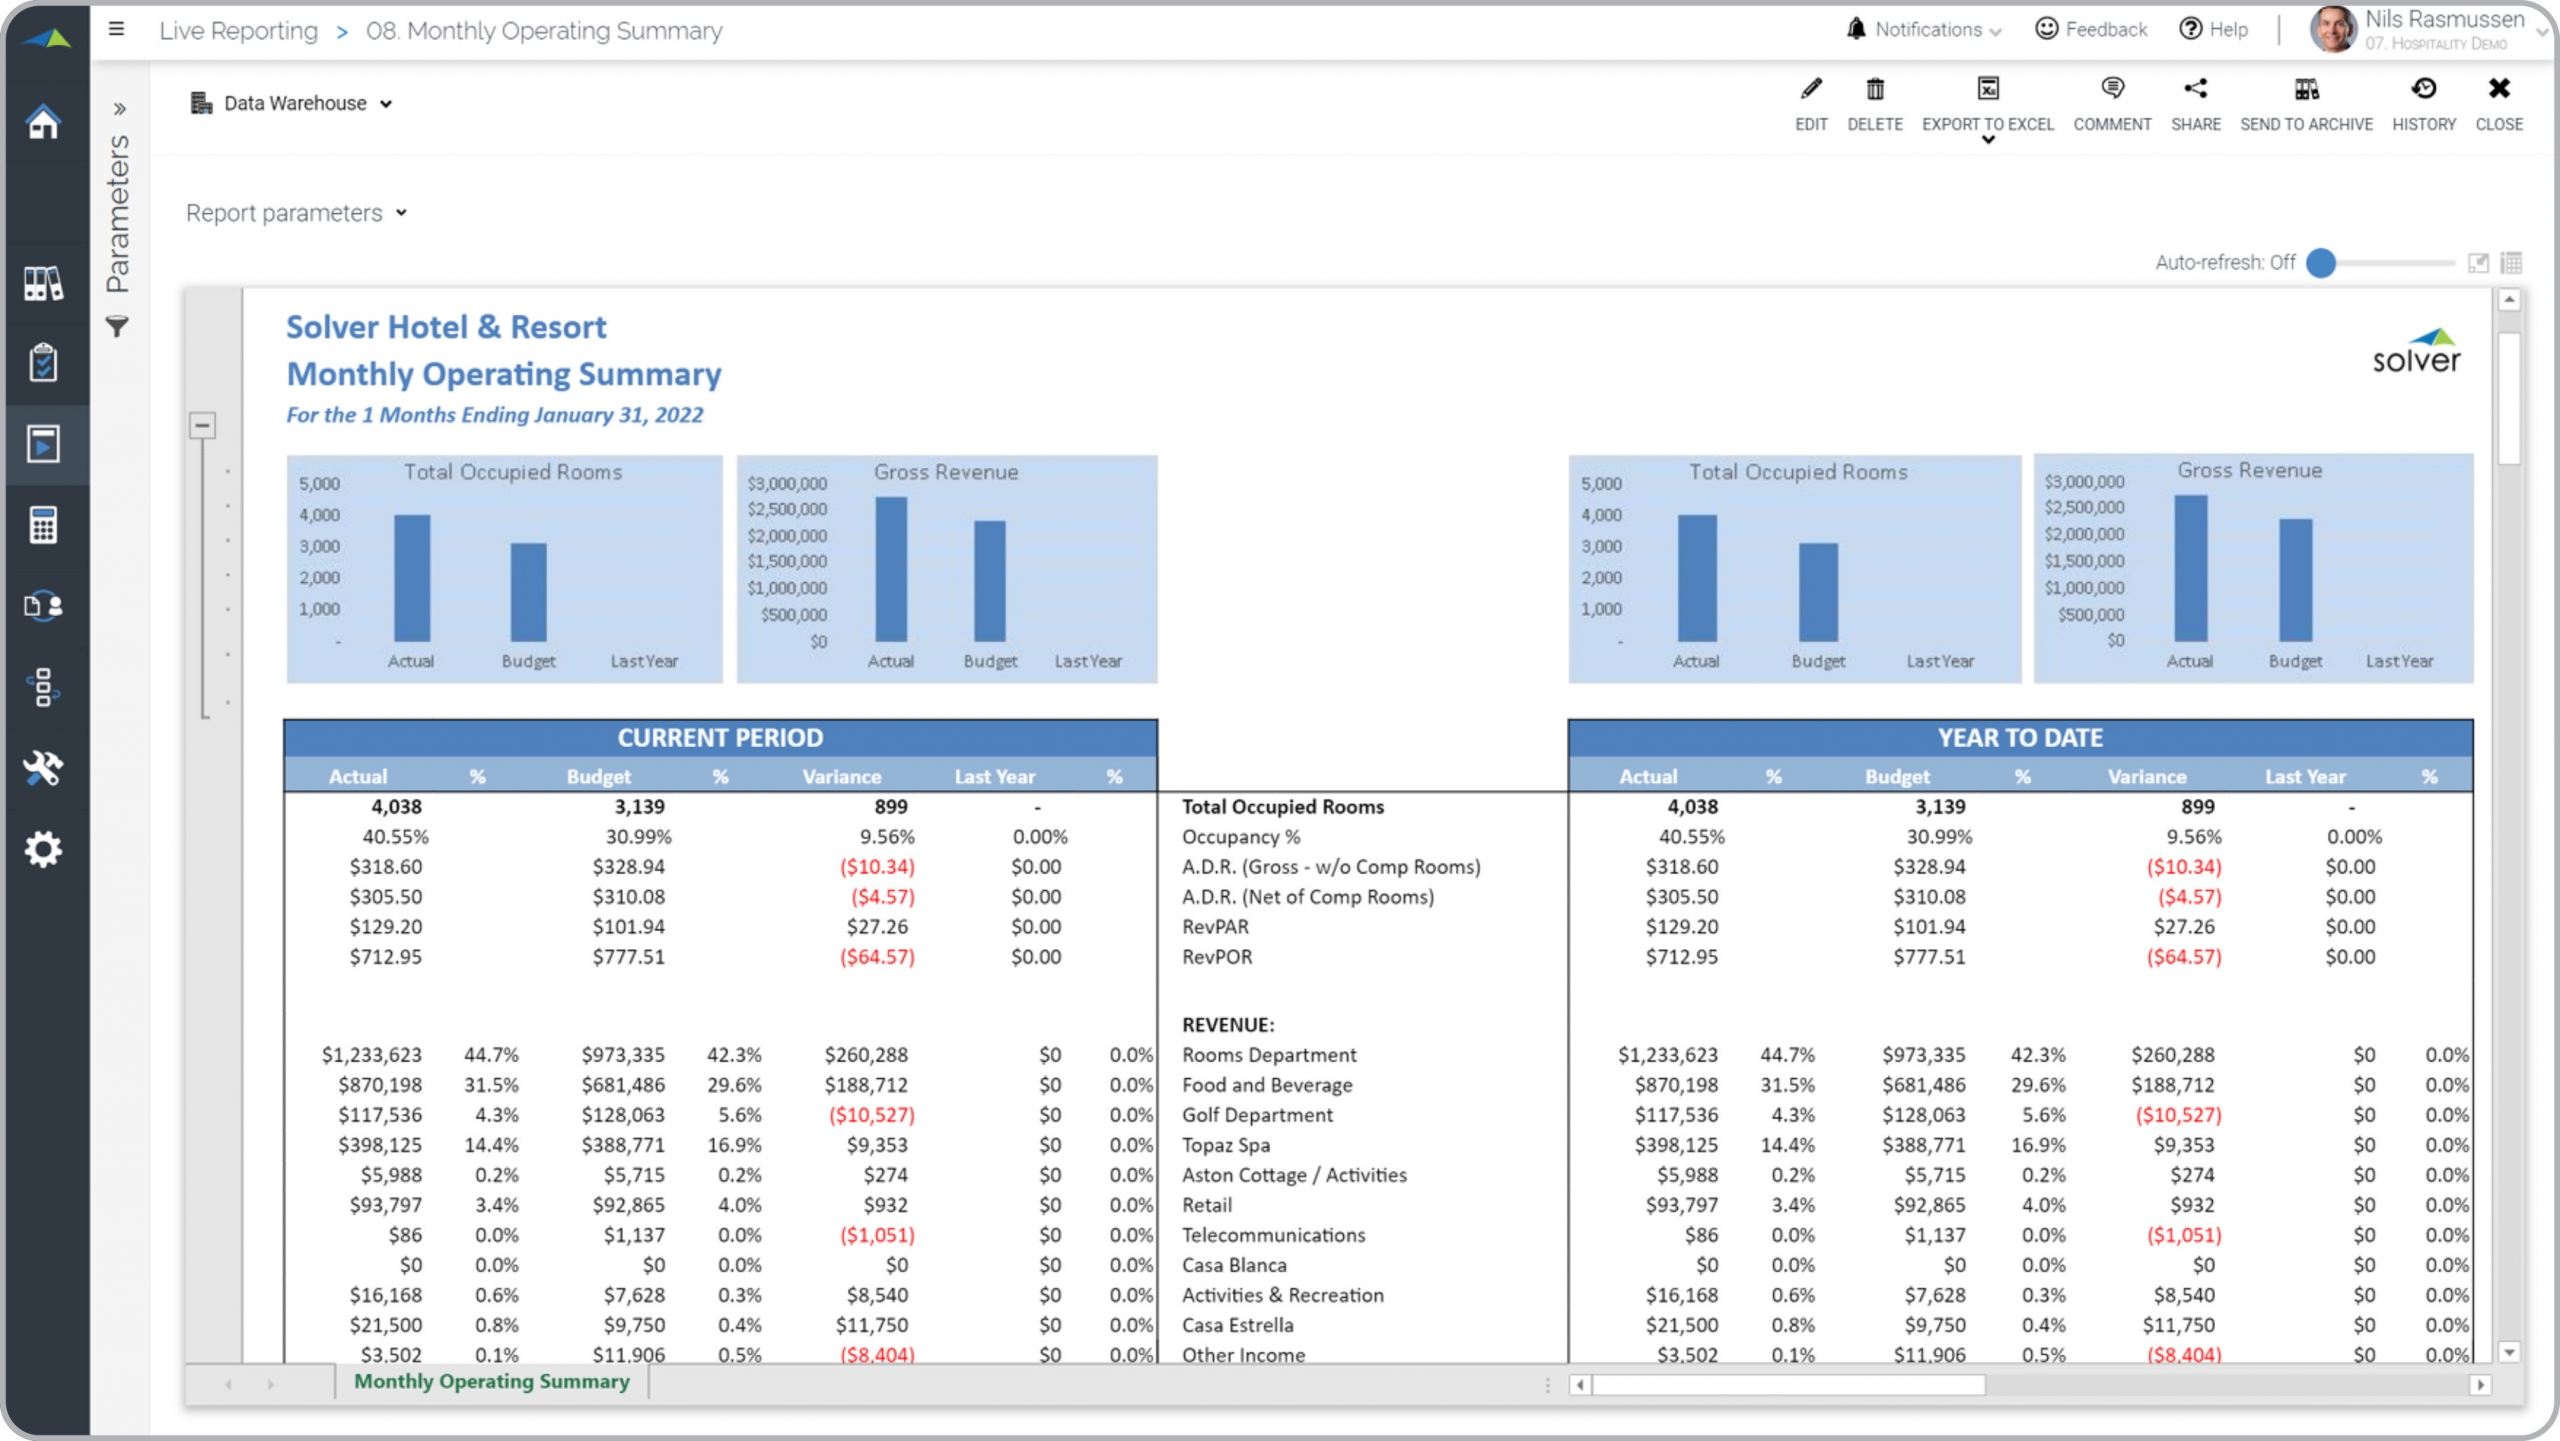
Monthly Operating Summary Report for a Hospitality Company
What is a Monthly Operating Summary Report ? Operating Summary Reports are considered business- and ...
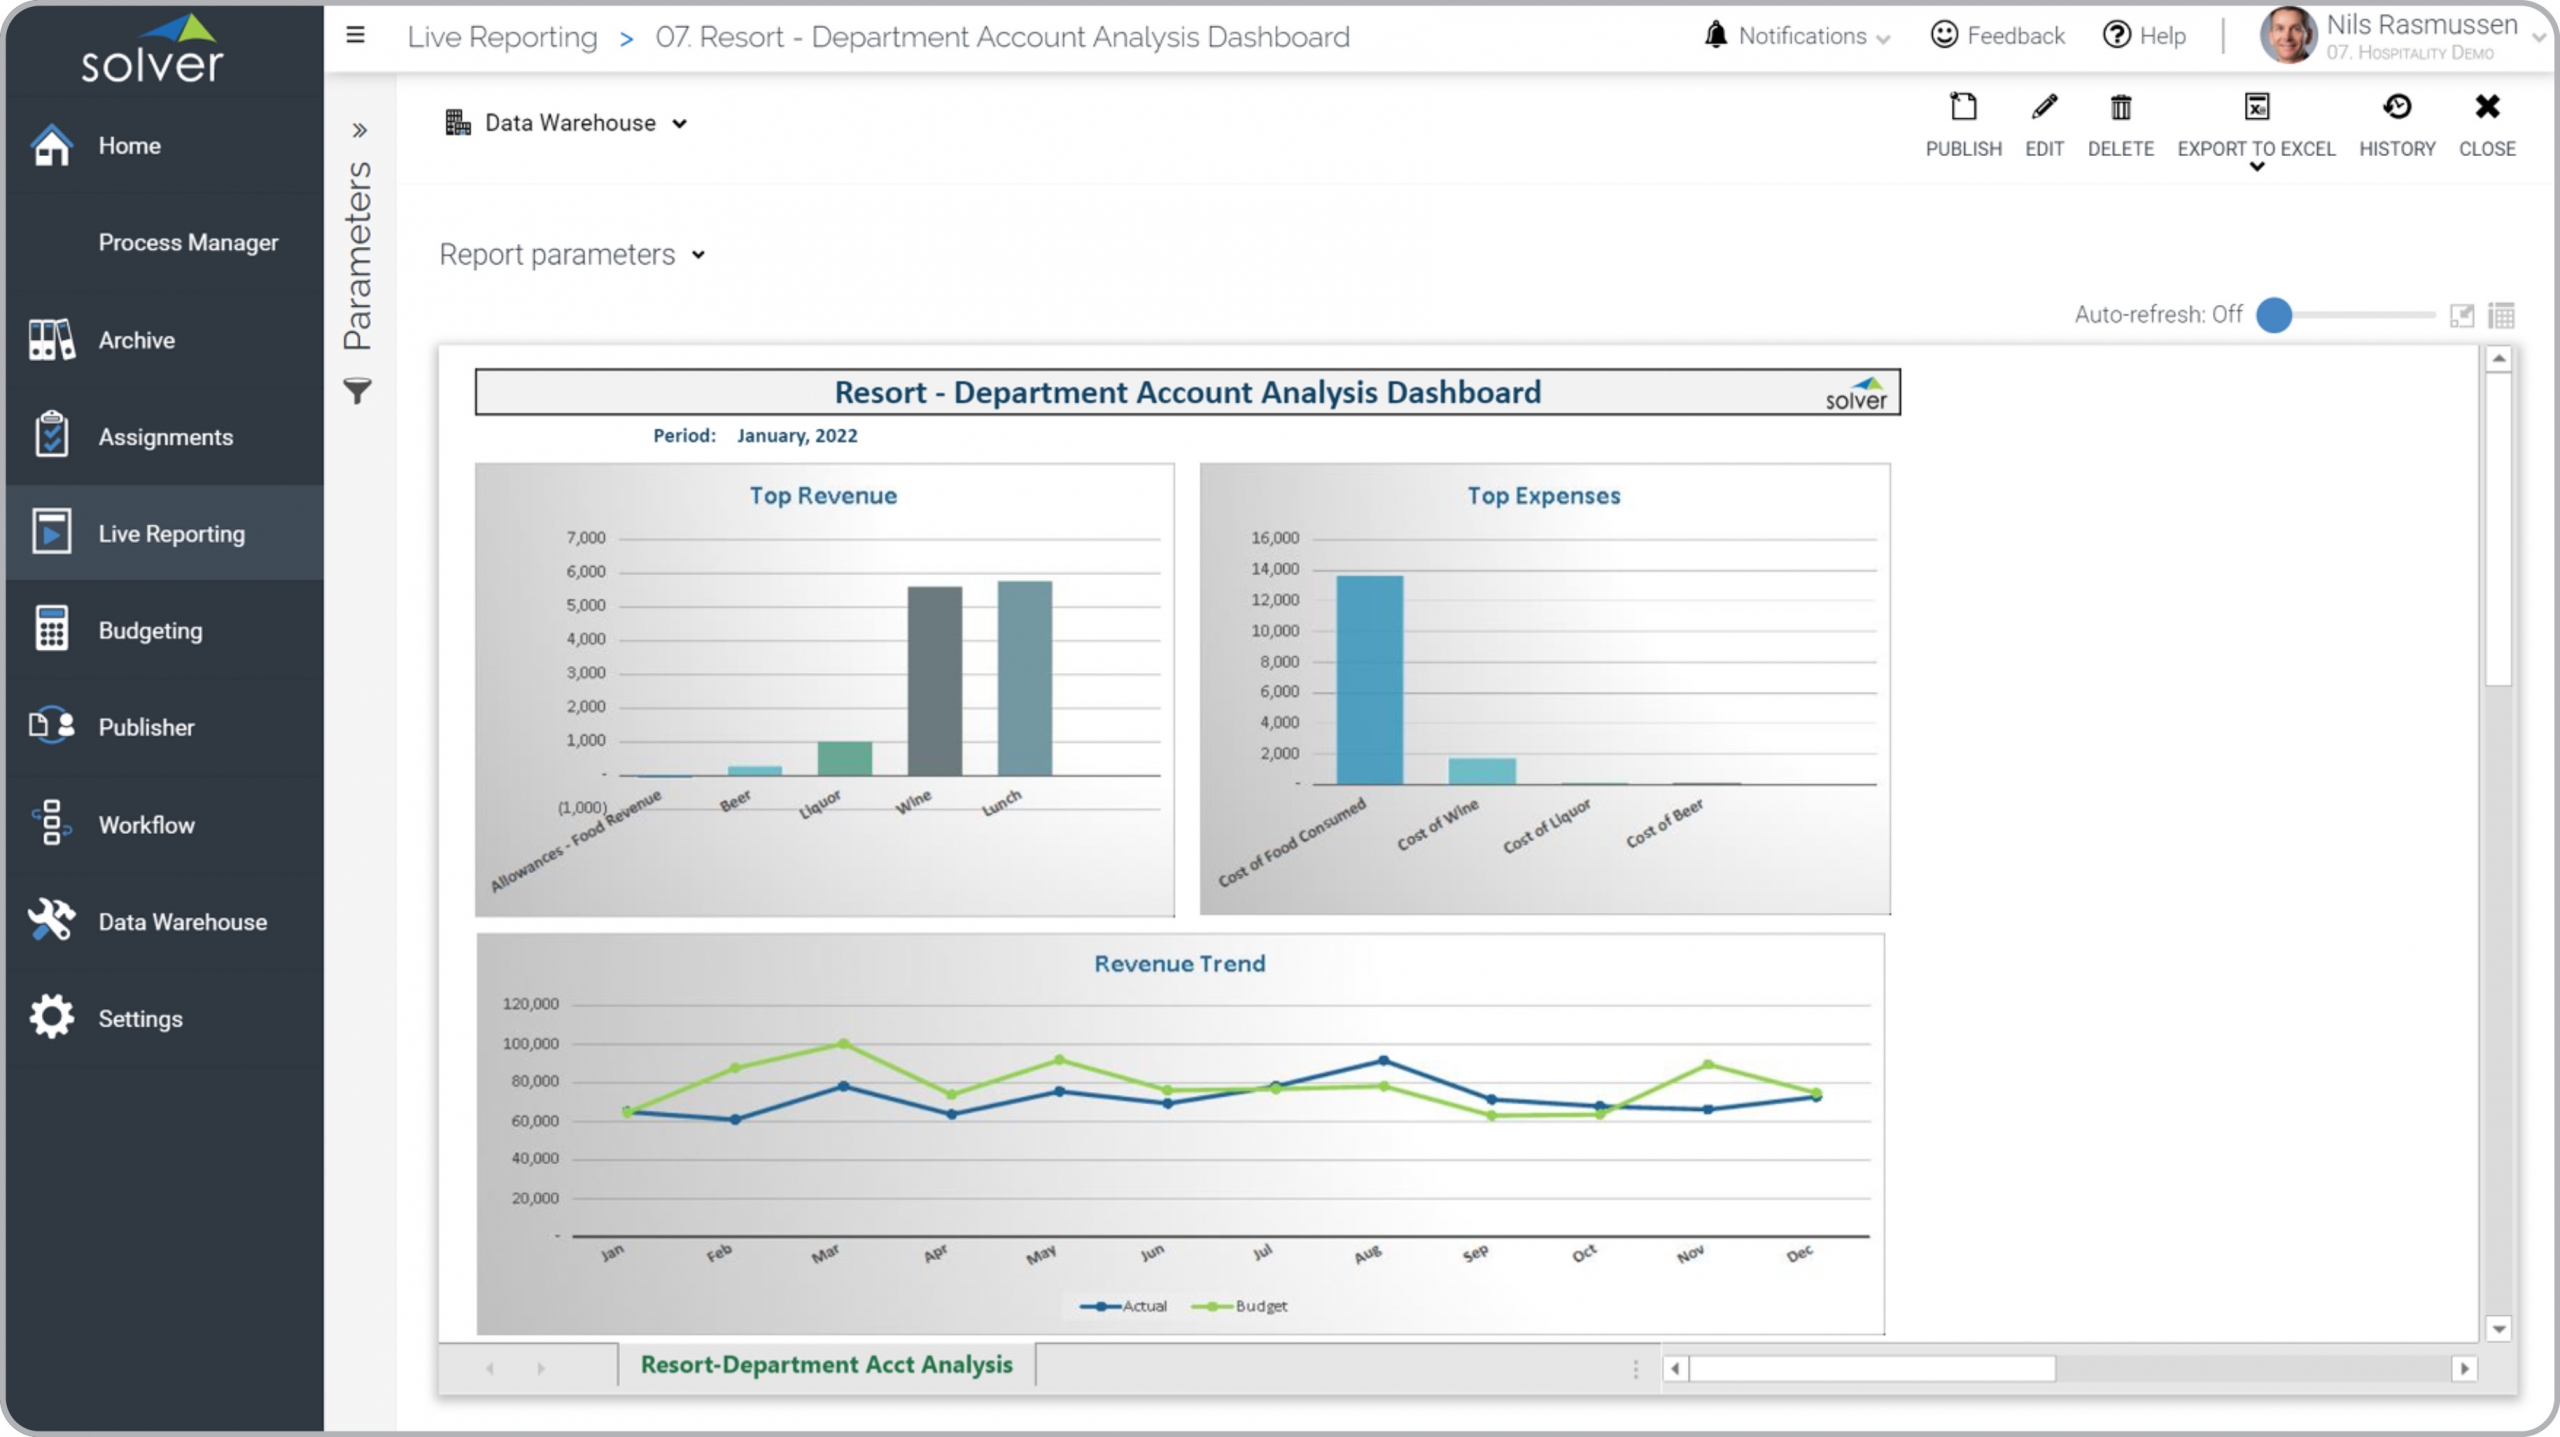
Department Dashboard for a Hospitality Company
What is a Department Dashboard for a Hospitality Company ? Departmental Dashboards are often ...
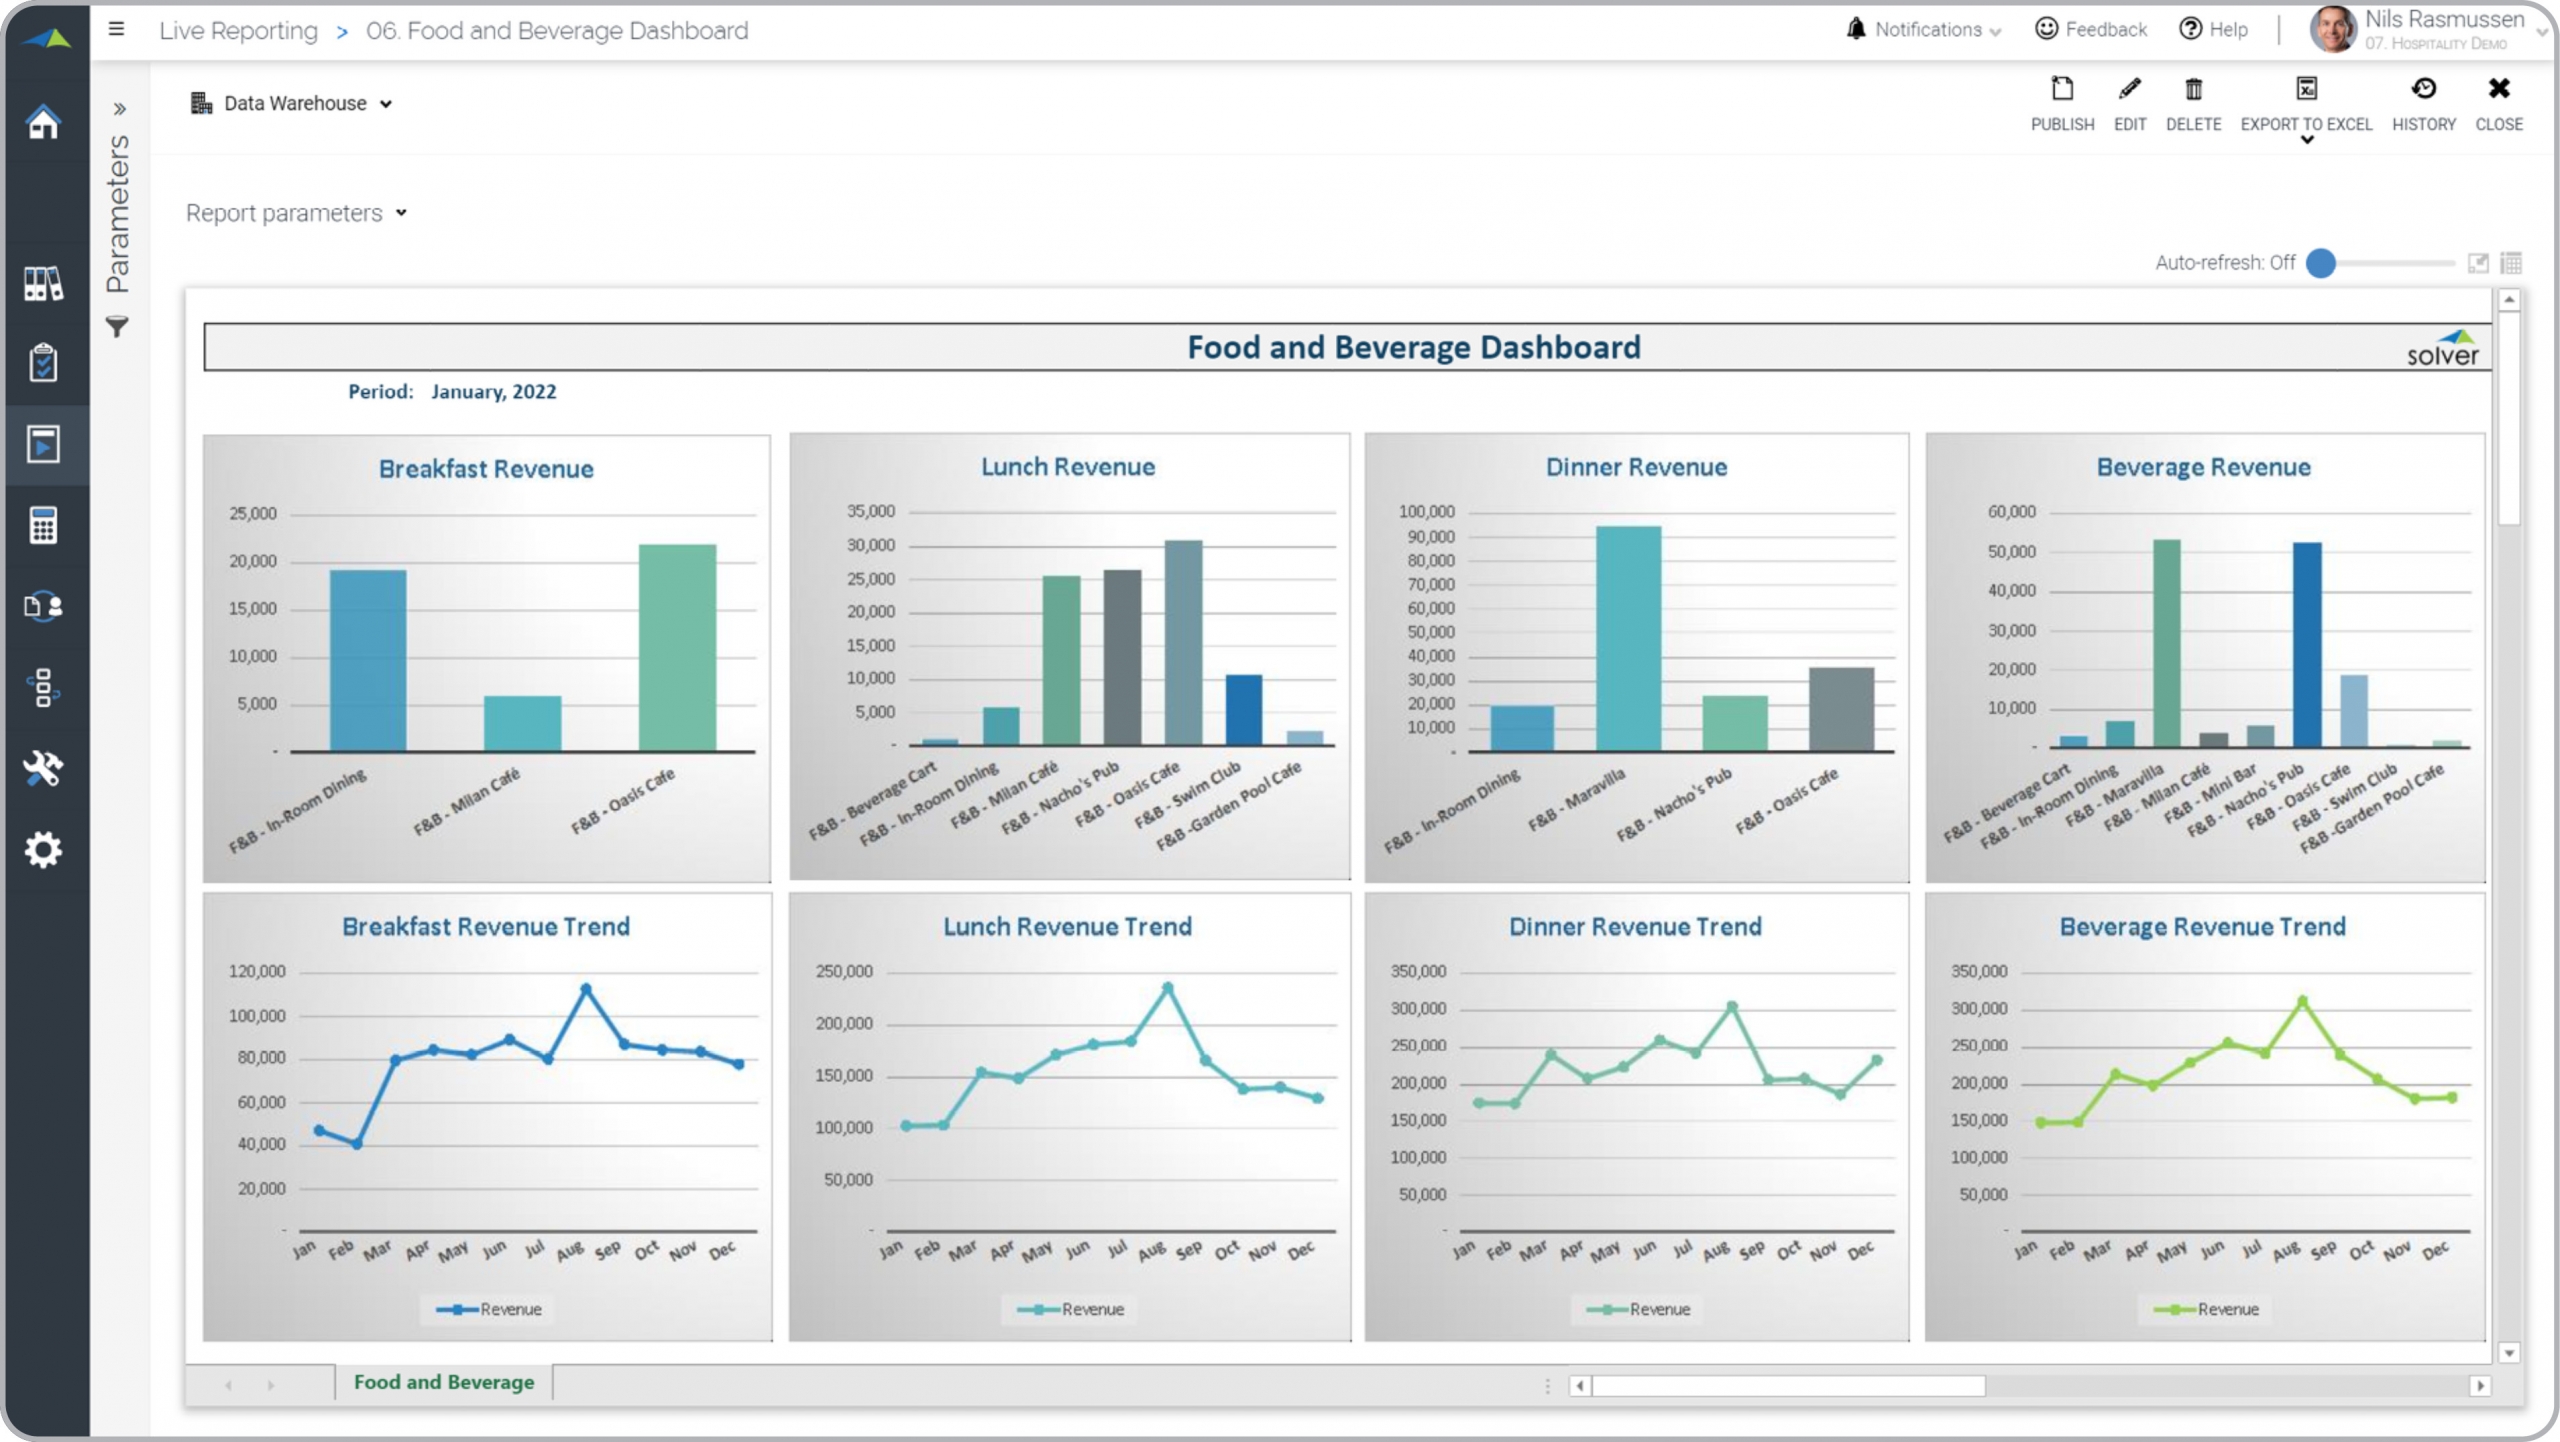
Food & Beverage Revenue Dashboard for Hospitality Companies
What is a Food & Beverage Revenue Dashboard ? Food and Beverage (F&B) Dashboards are ...
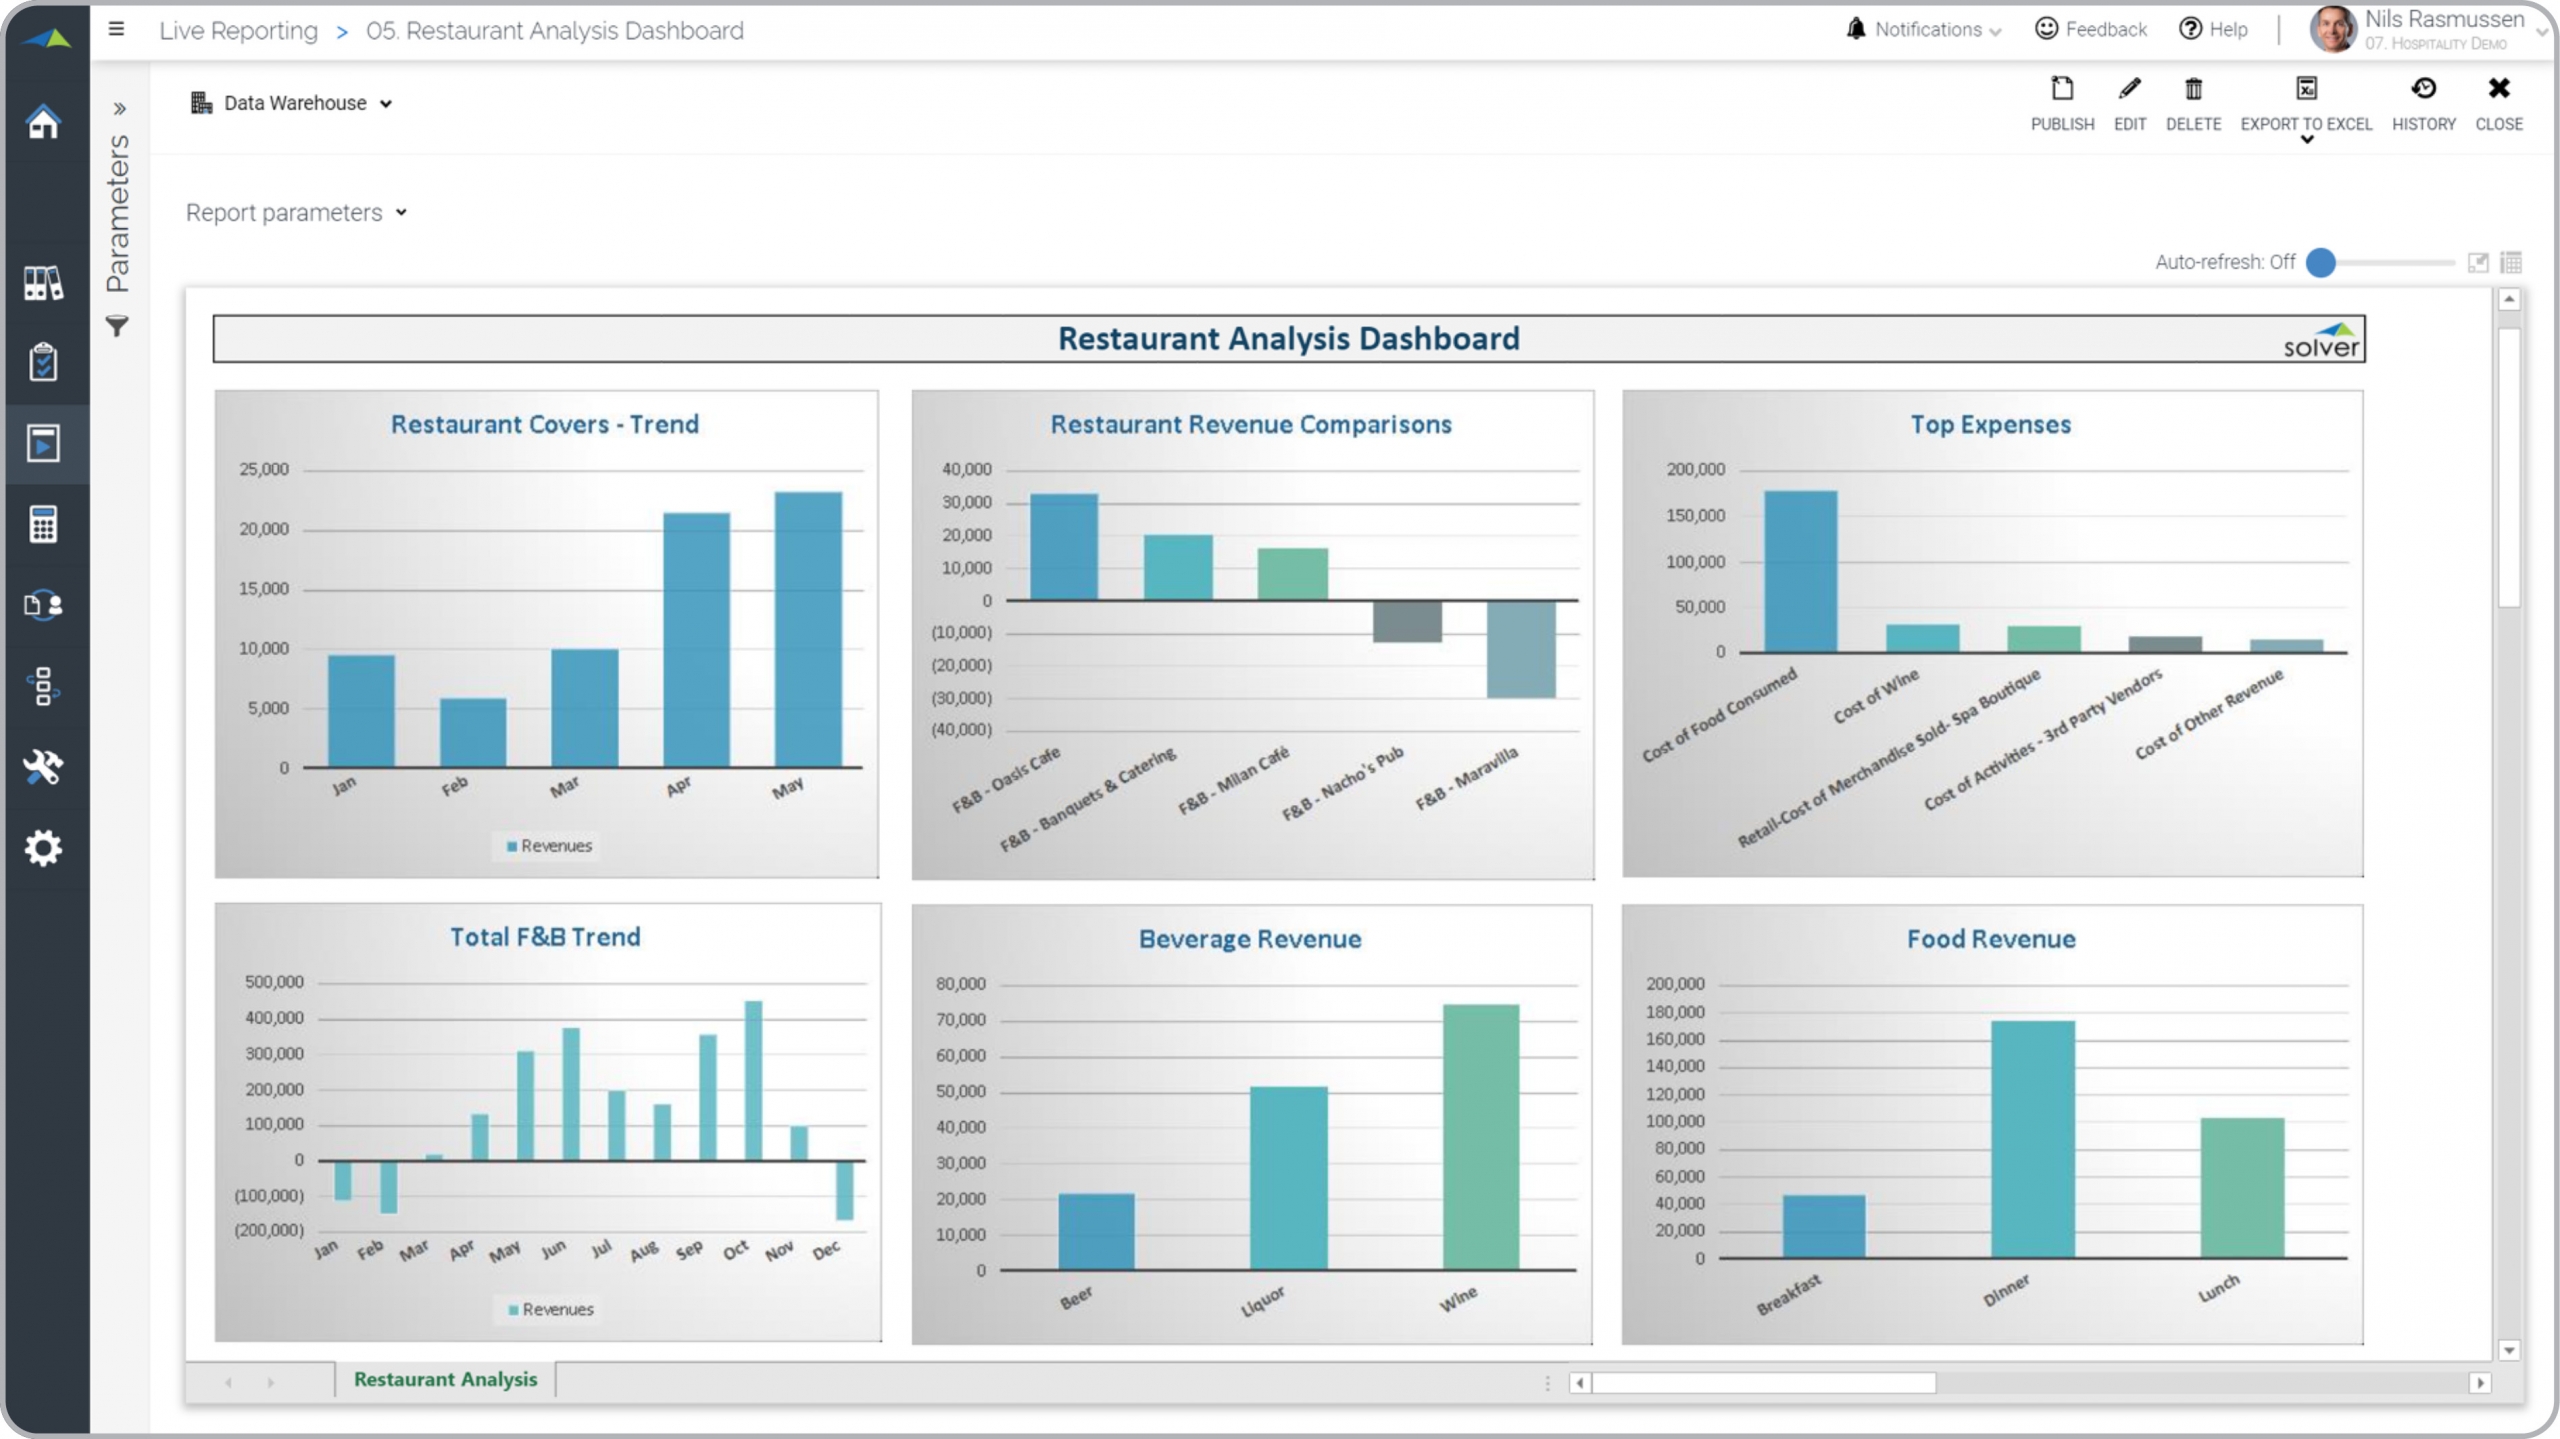
Restaurant Performance Dashboard for Hospitality Companies
What is a Restaurant Performance Dashboard ? Restaurant Dashboards are considered performance ...
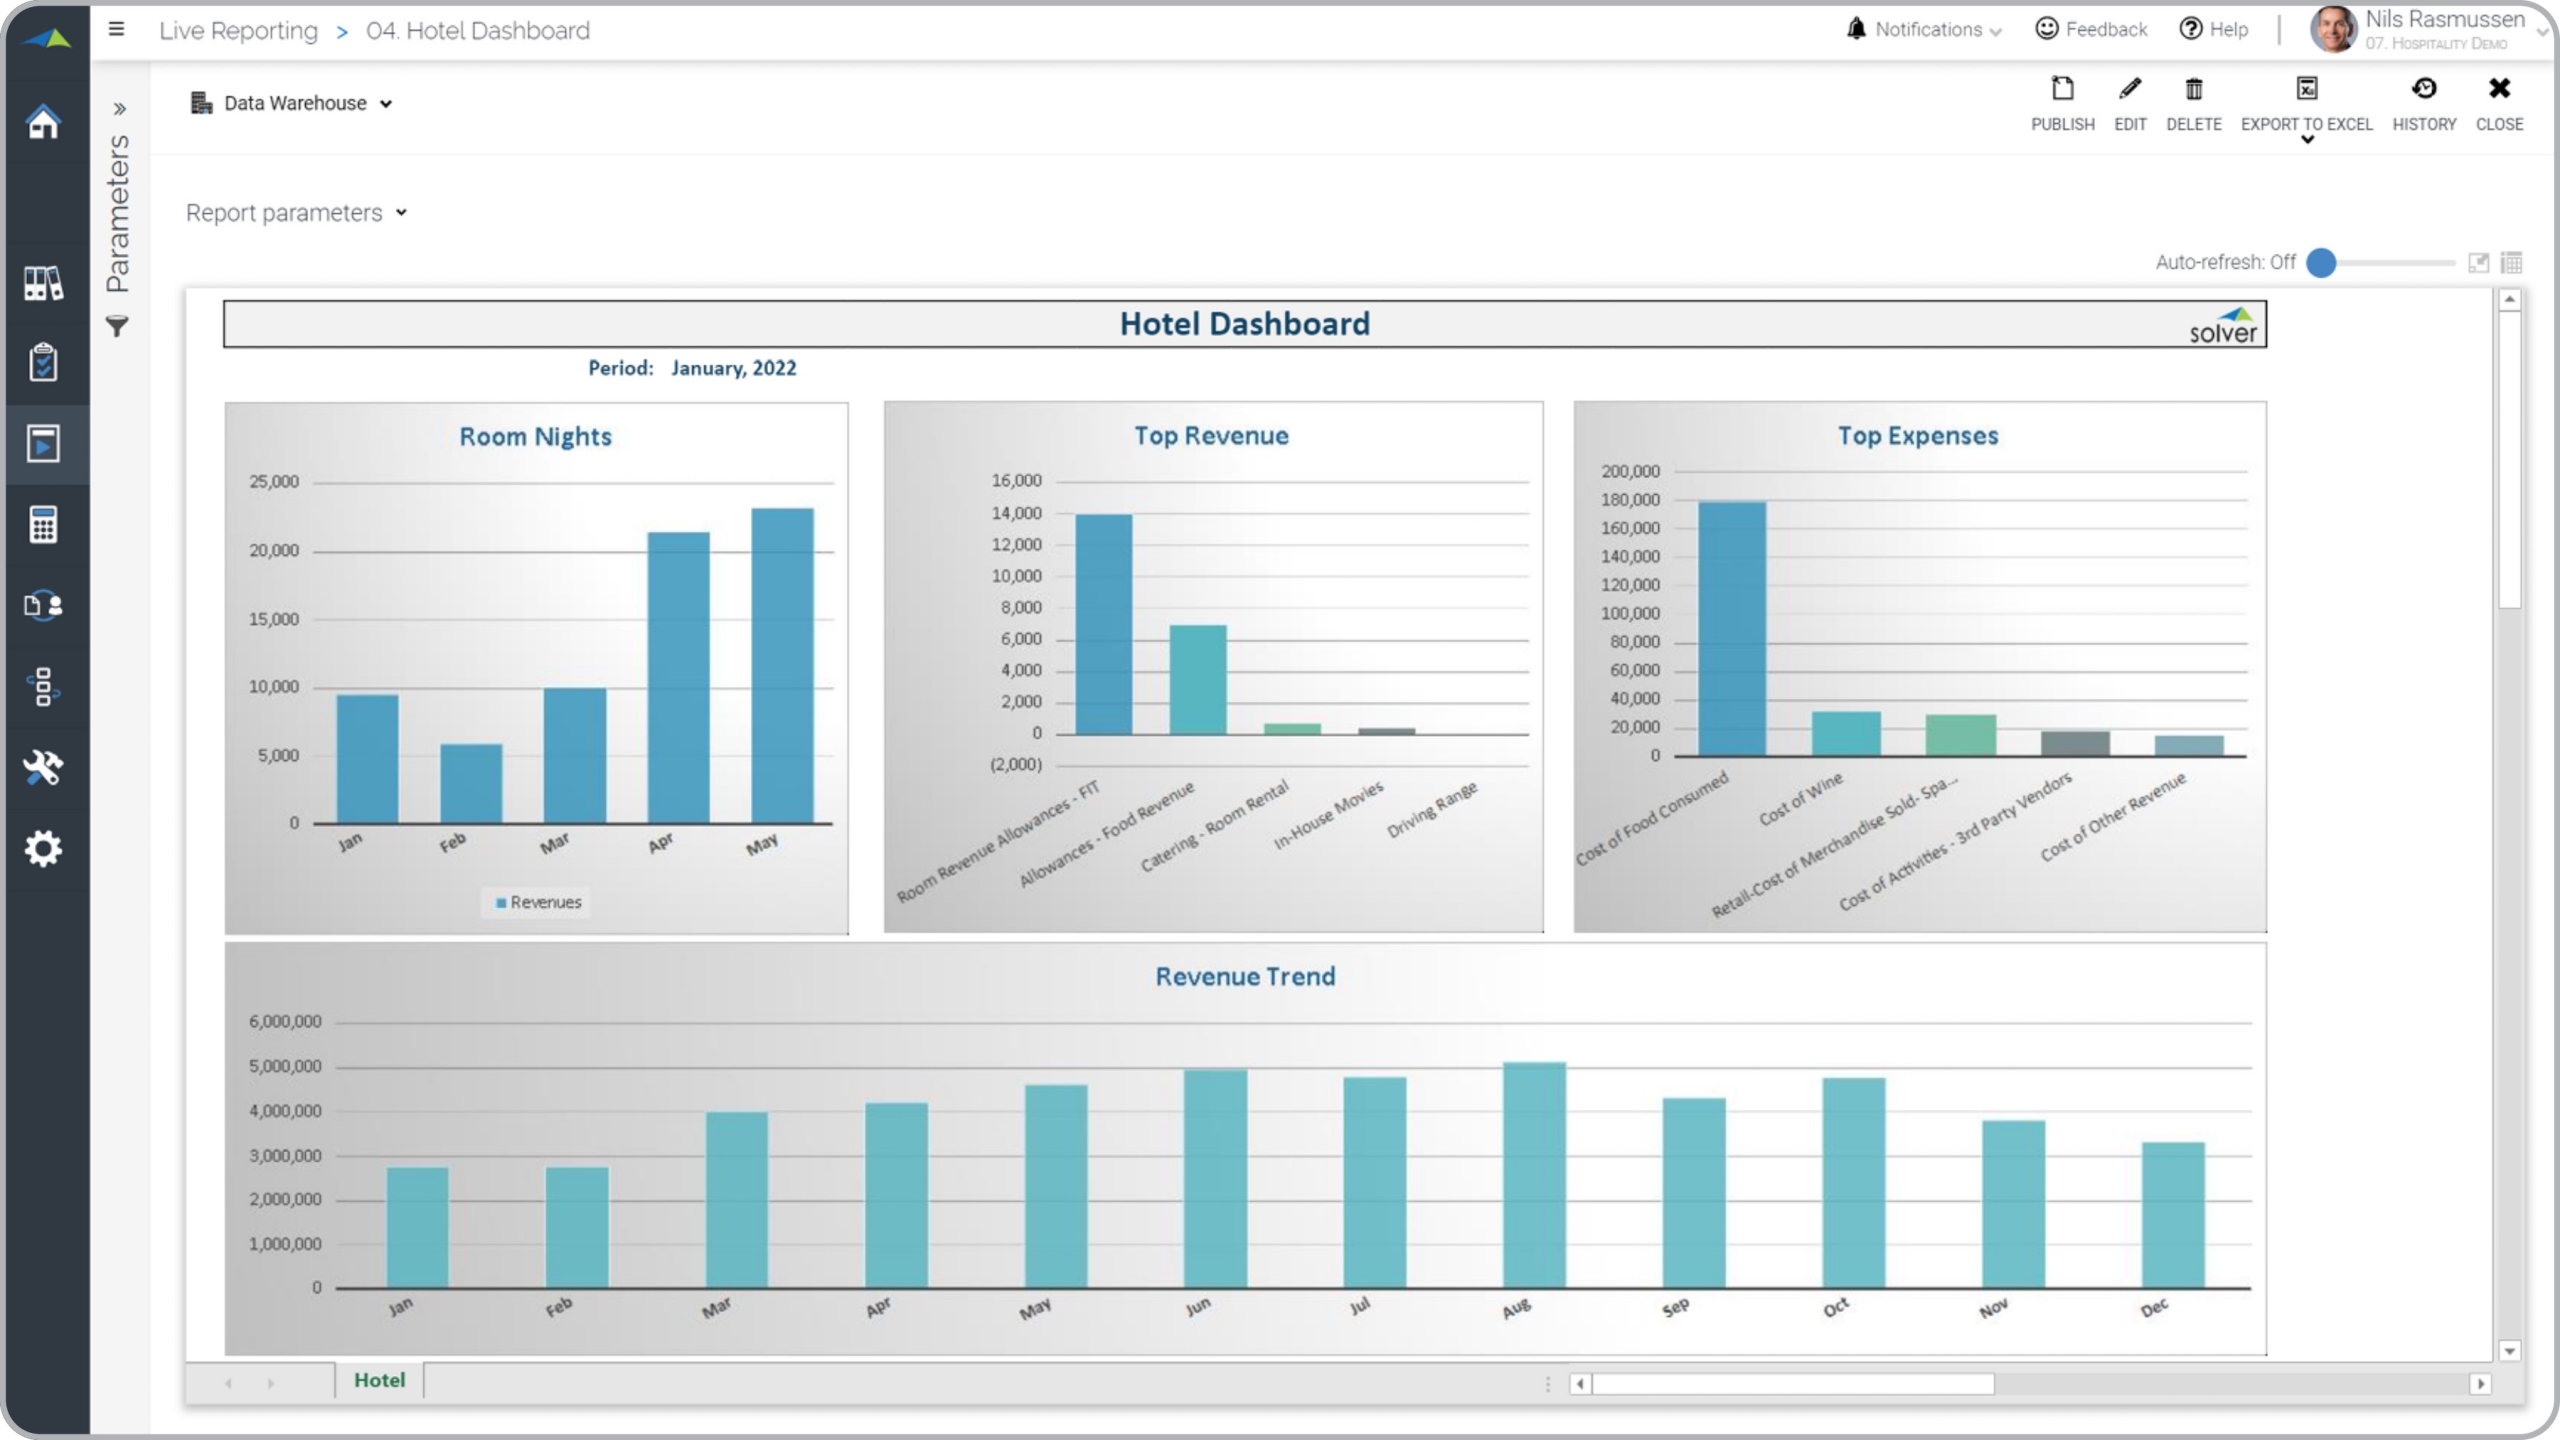
Hotel KPI Dashboard for Hospitality Companies
What is a Hotel KPI Dashboard ? Hotel KPI Dashboards are considered monitoring and analysis tools ...
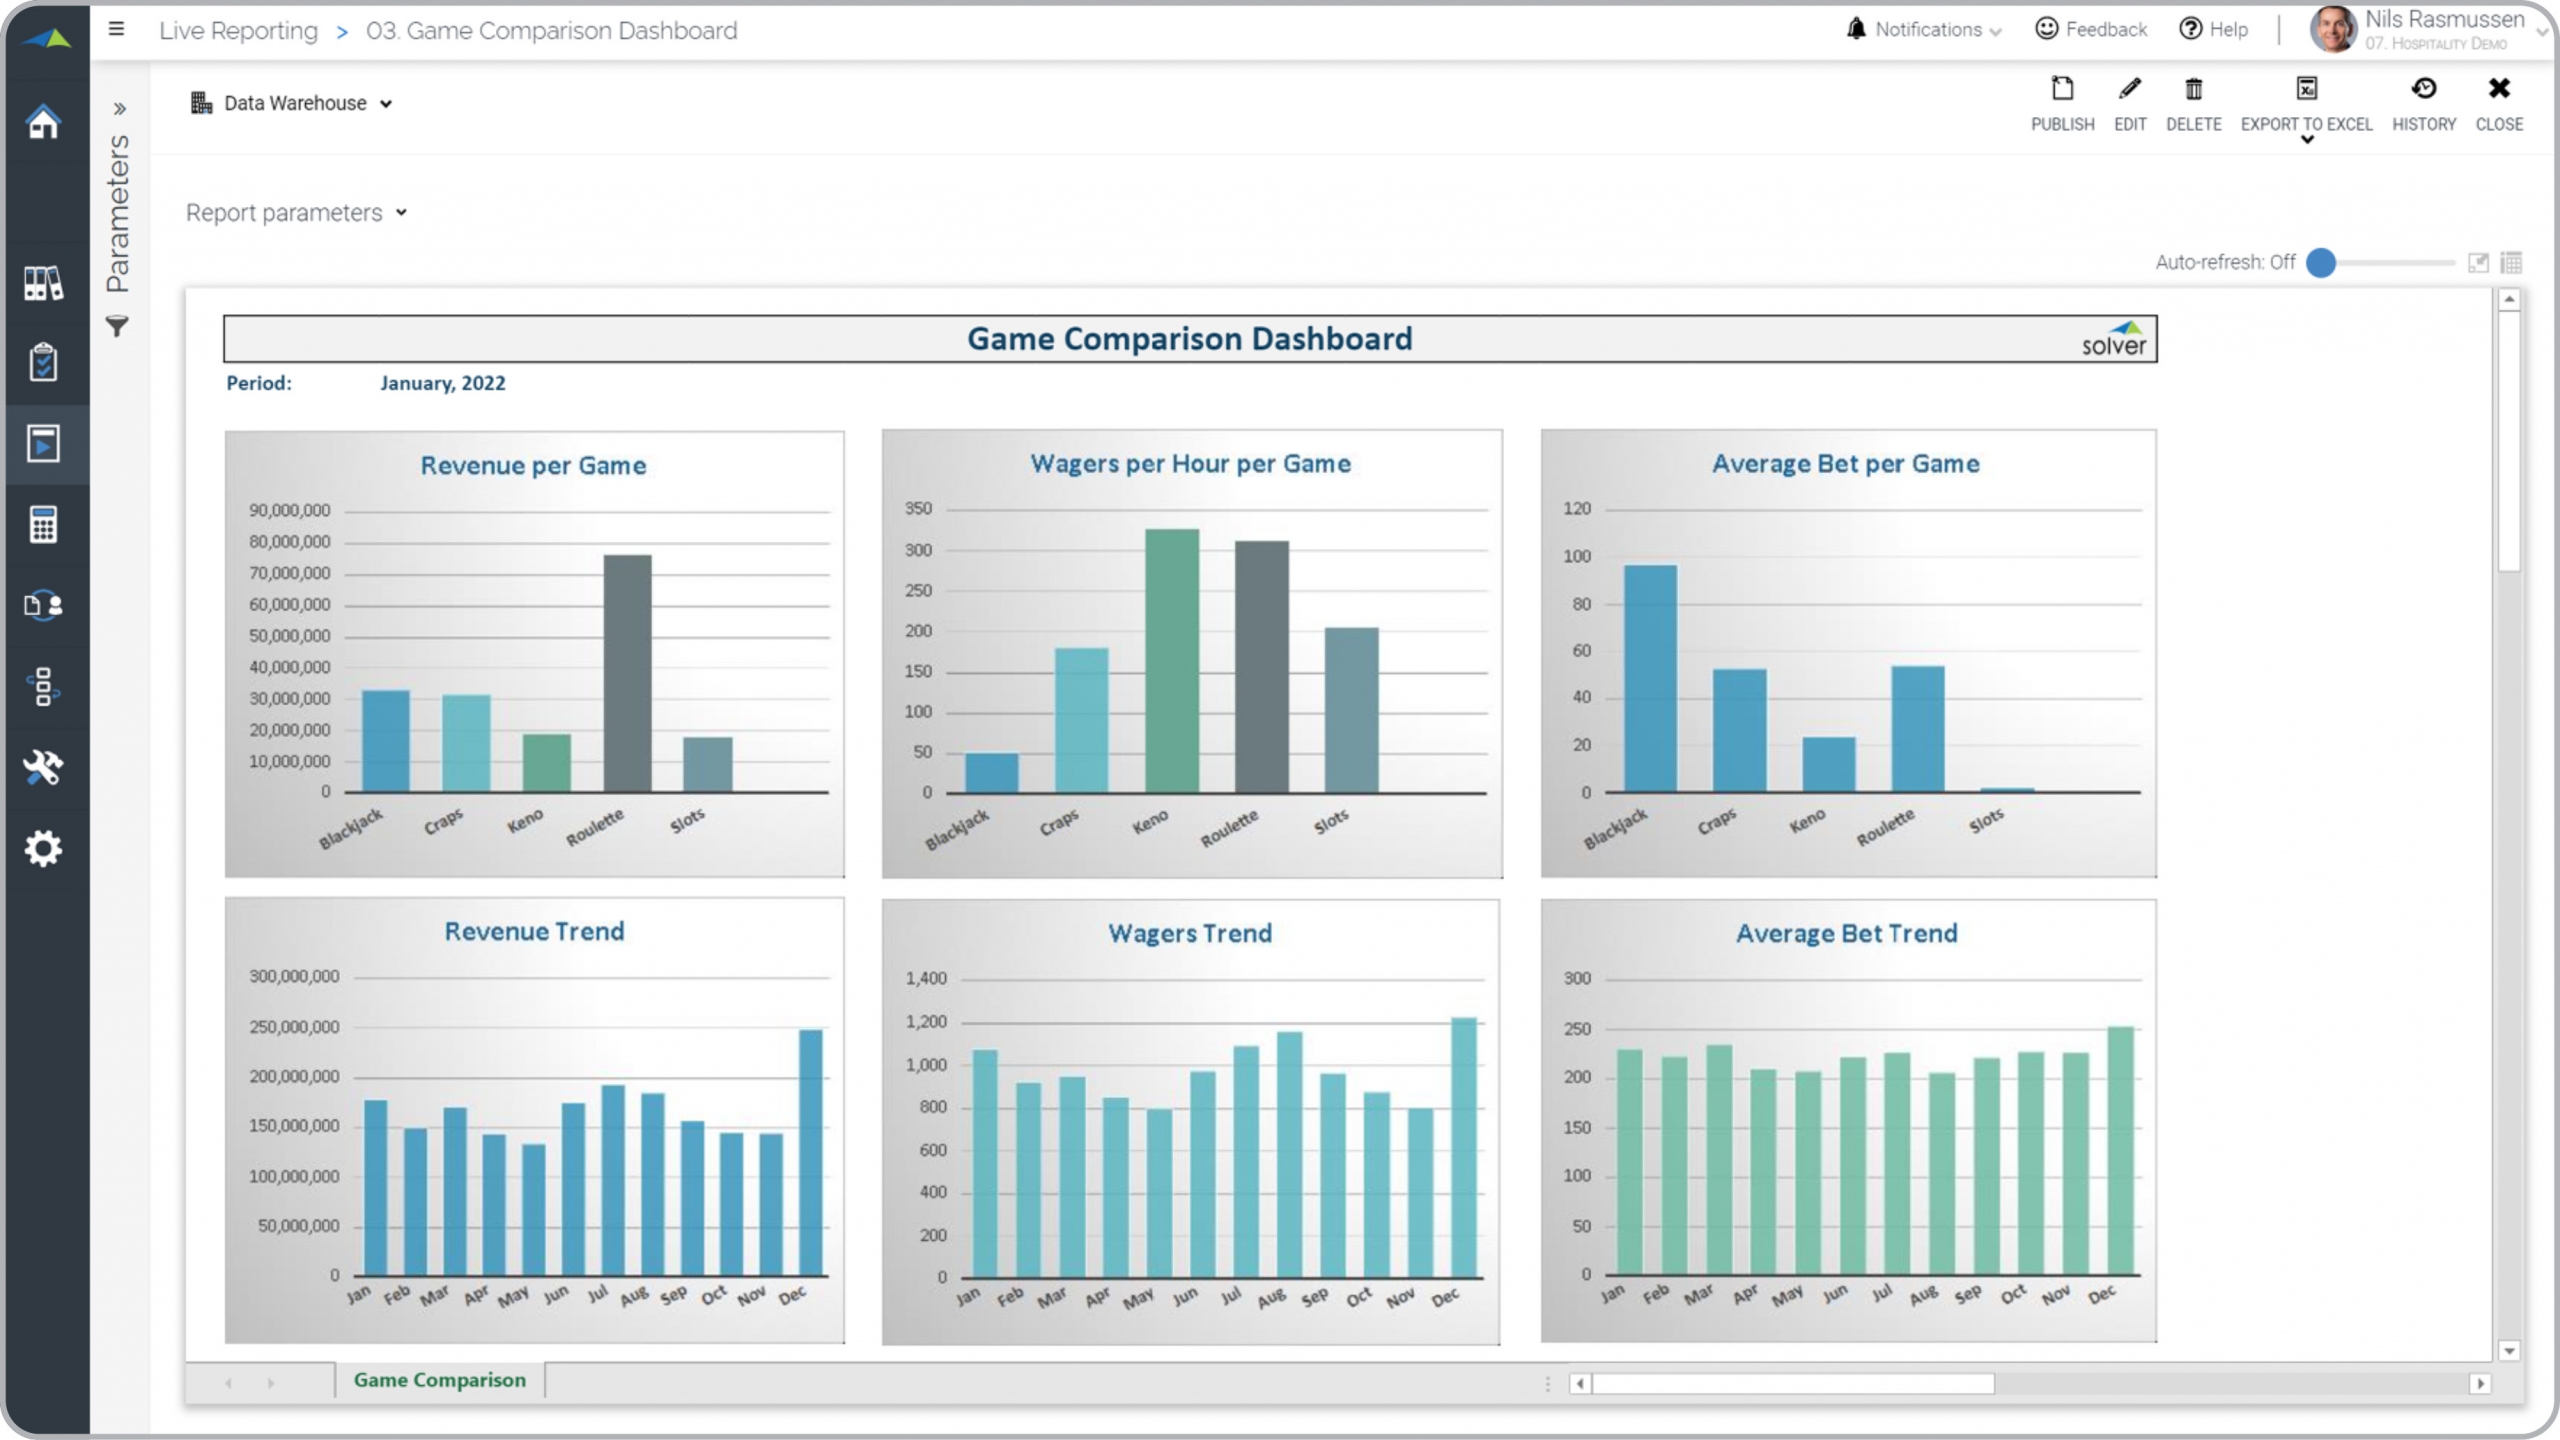
Casino Game Comparison Dashboard for Hospitality Companies
What is a Casino Game Comparison Dashboard ? Game Comparison Dashboards are considered operational ...
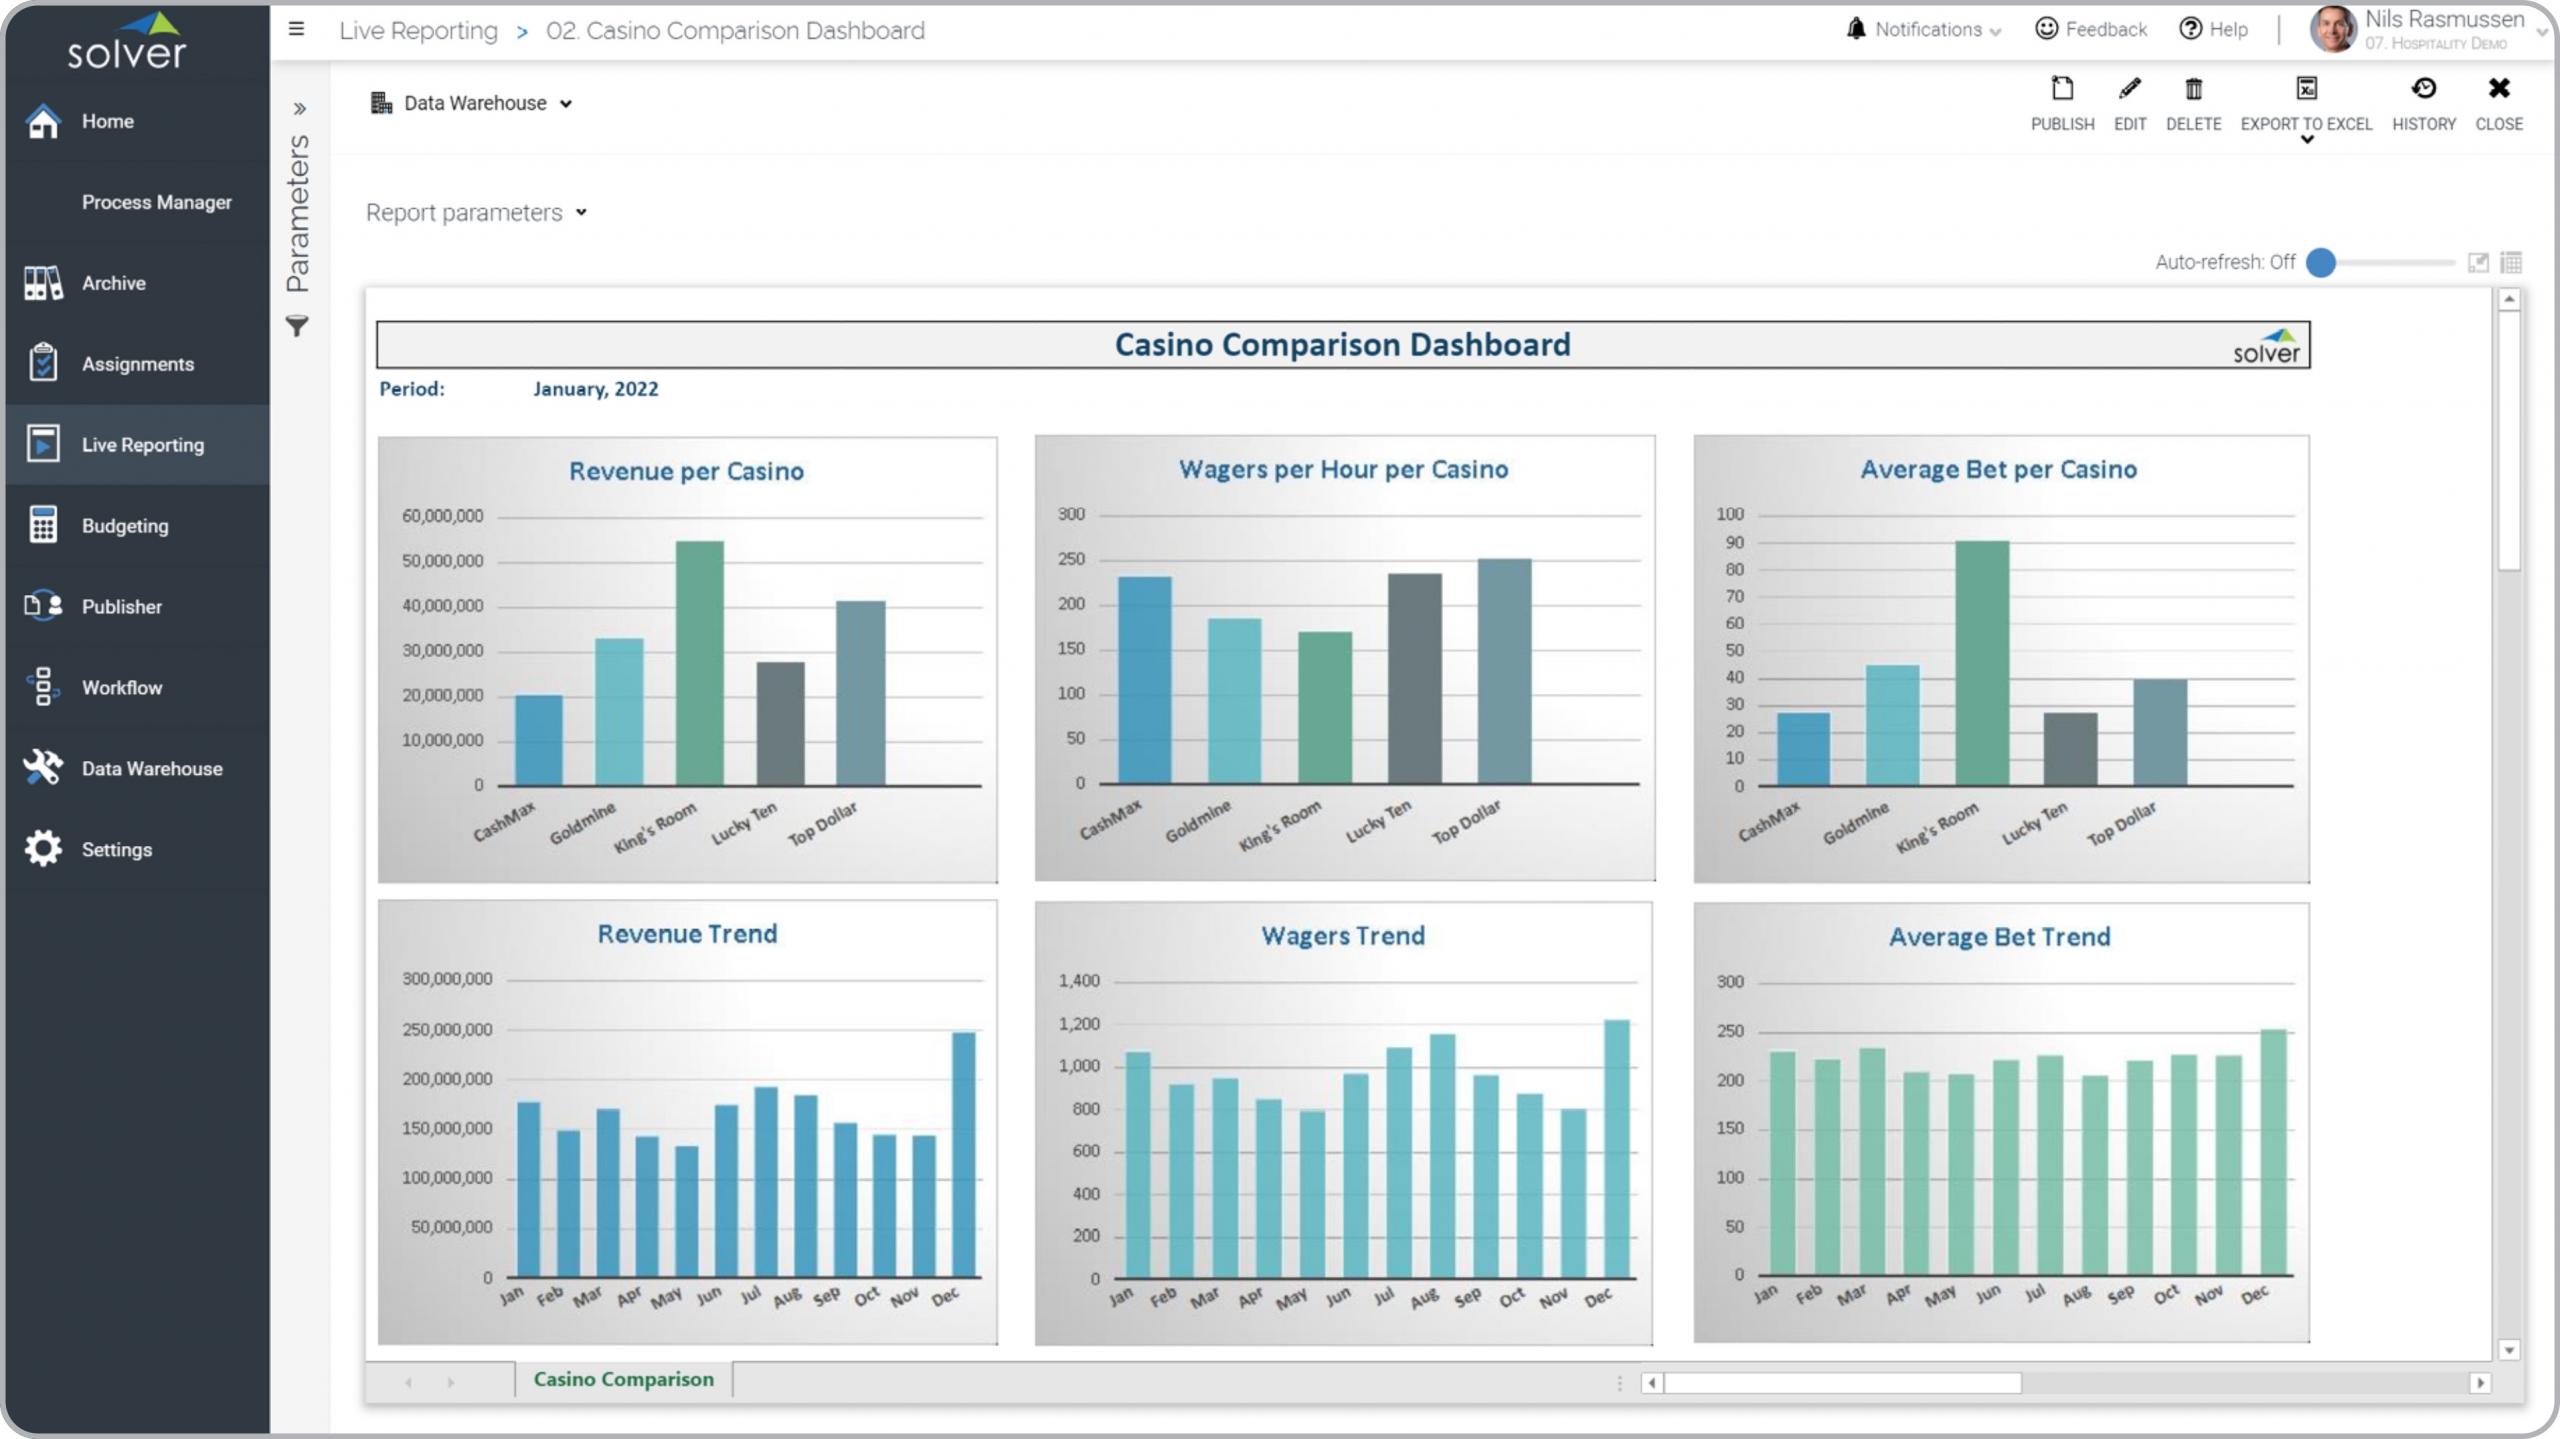
Casino Comparison Dashboard for Hospitality Companies
What is a Casino Comparison Dashboard ? Casino Comparison Dashboards are considered performance ...
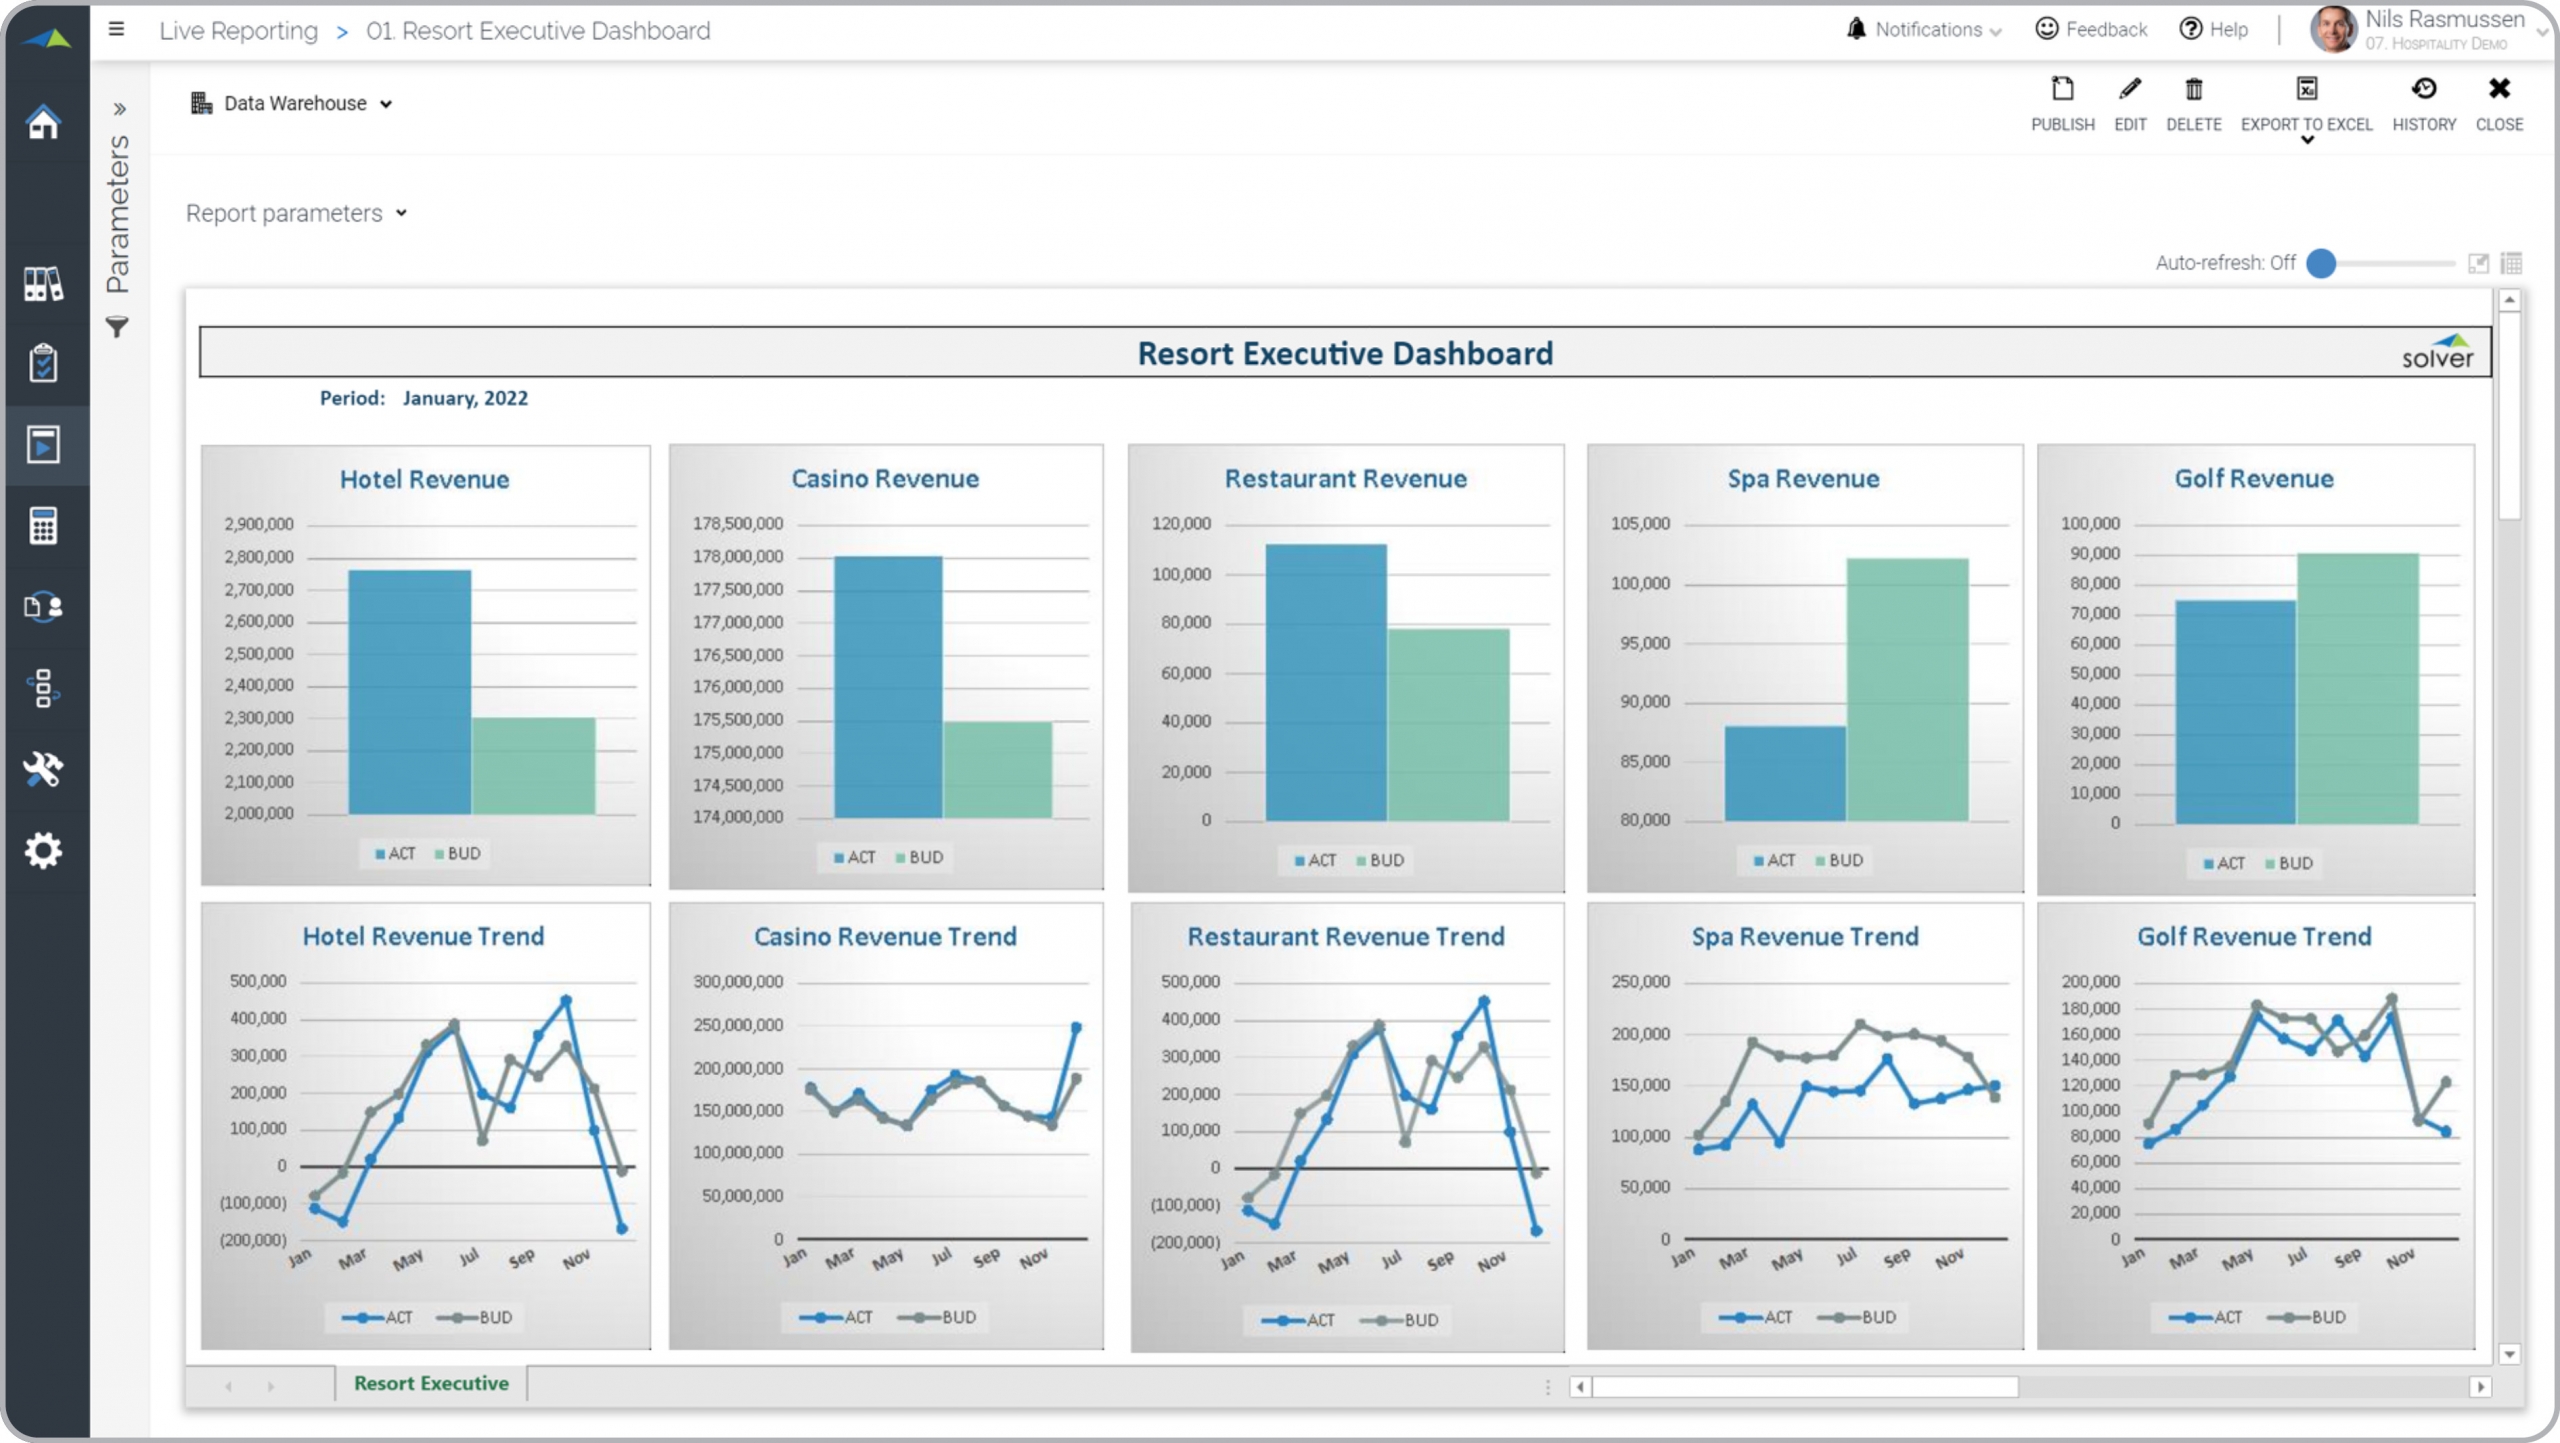
Executive Dashboards for Hospitality Companies
What is an Executive Dashboard for Hospitality Companies ? Executive Dashboards are considered ...
Clinical Trials Analysis Report for Pharmaceutical Companies
What is a Clinical Trials Analysis Report ? Clinical Trials Reports are considered operational ...
Reimbursement Analysis for Pharma Companies
What is a Reimbursement Analysis Dashboard ? Reimbursement Dashboards are considered operational ...
Sales Dashboard for Pharmaceutical Companies
What is a Sales Dashboard for Pharmaceutical Companies ? Sales Dashboards are considered revenue ...
Executive Dashboard for Pharma Companies
What is an Executive Dashboard ? Executive Dashboards are considered decision support tools and are ...
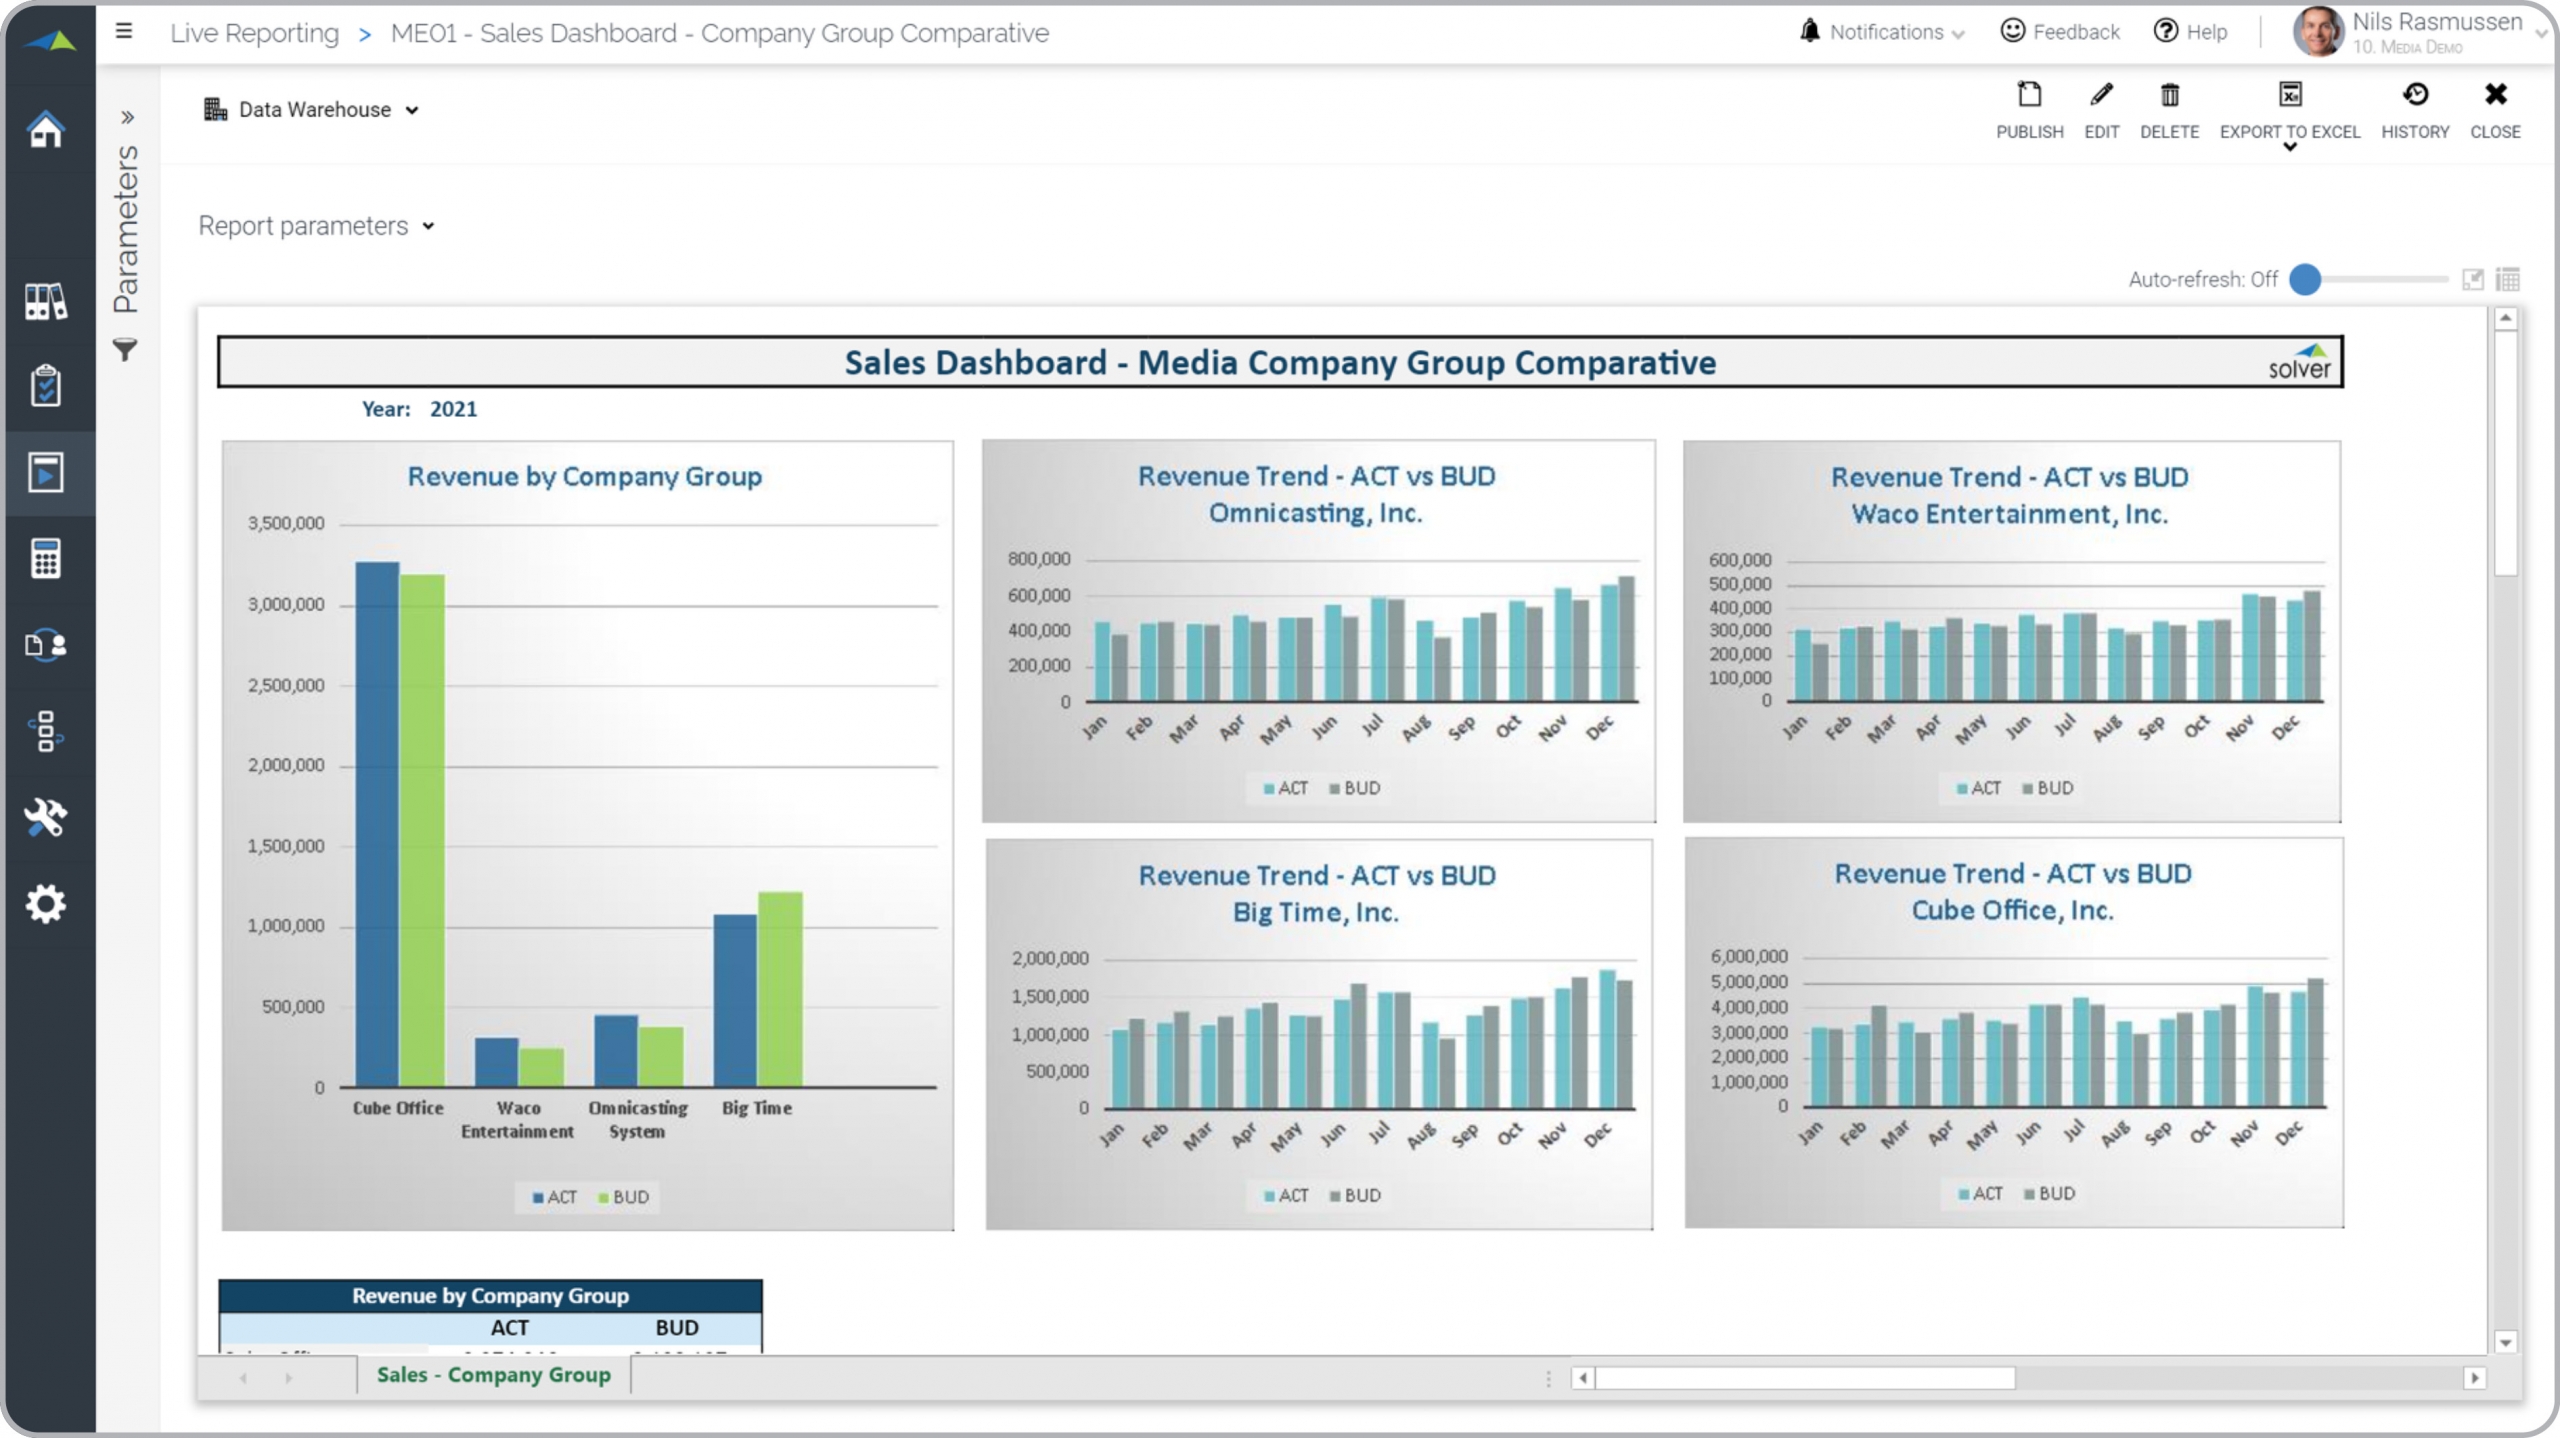
Revenue Comparison Dashboard for Media Companies
What is a Revenue Comparison Dashboard ? Revenue Comparison Dashboards are considered benchmarking ...
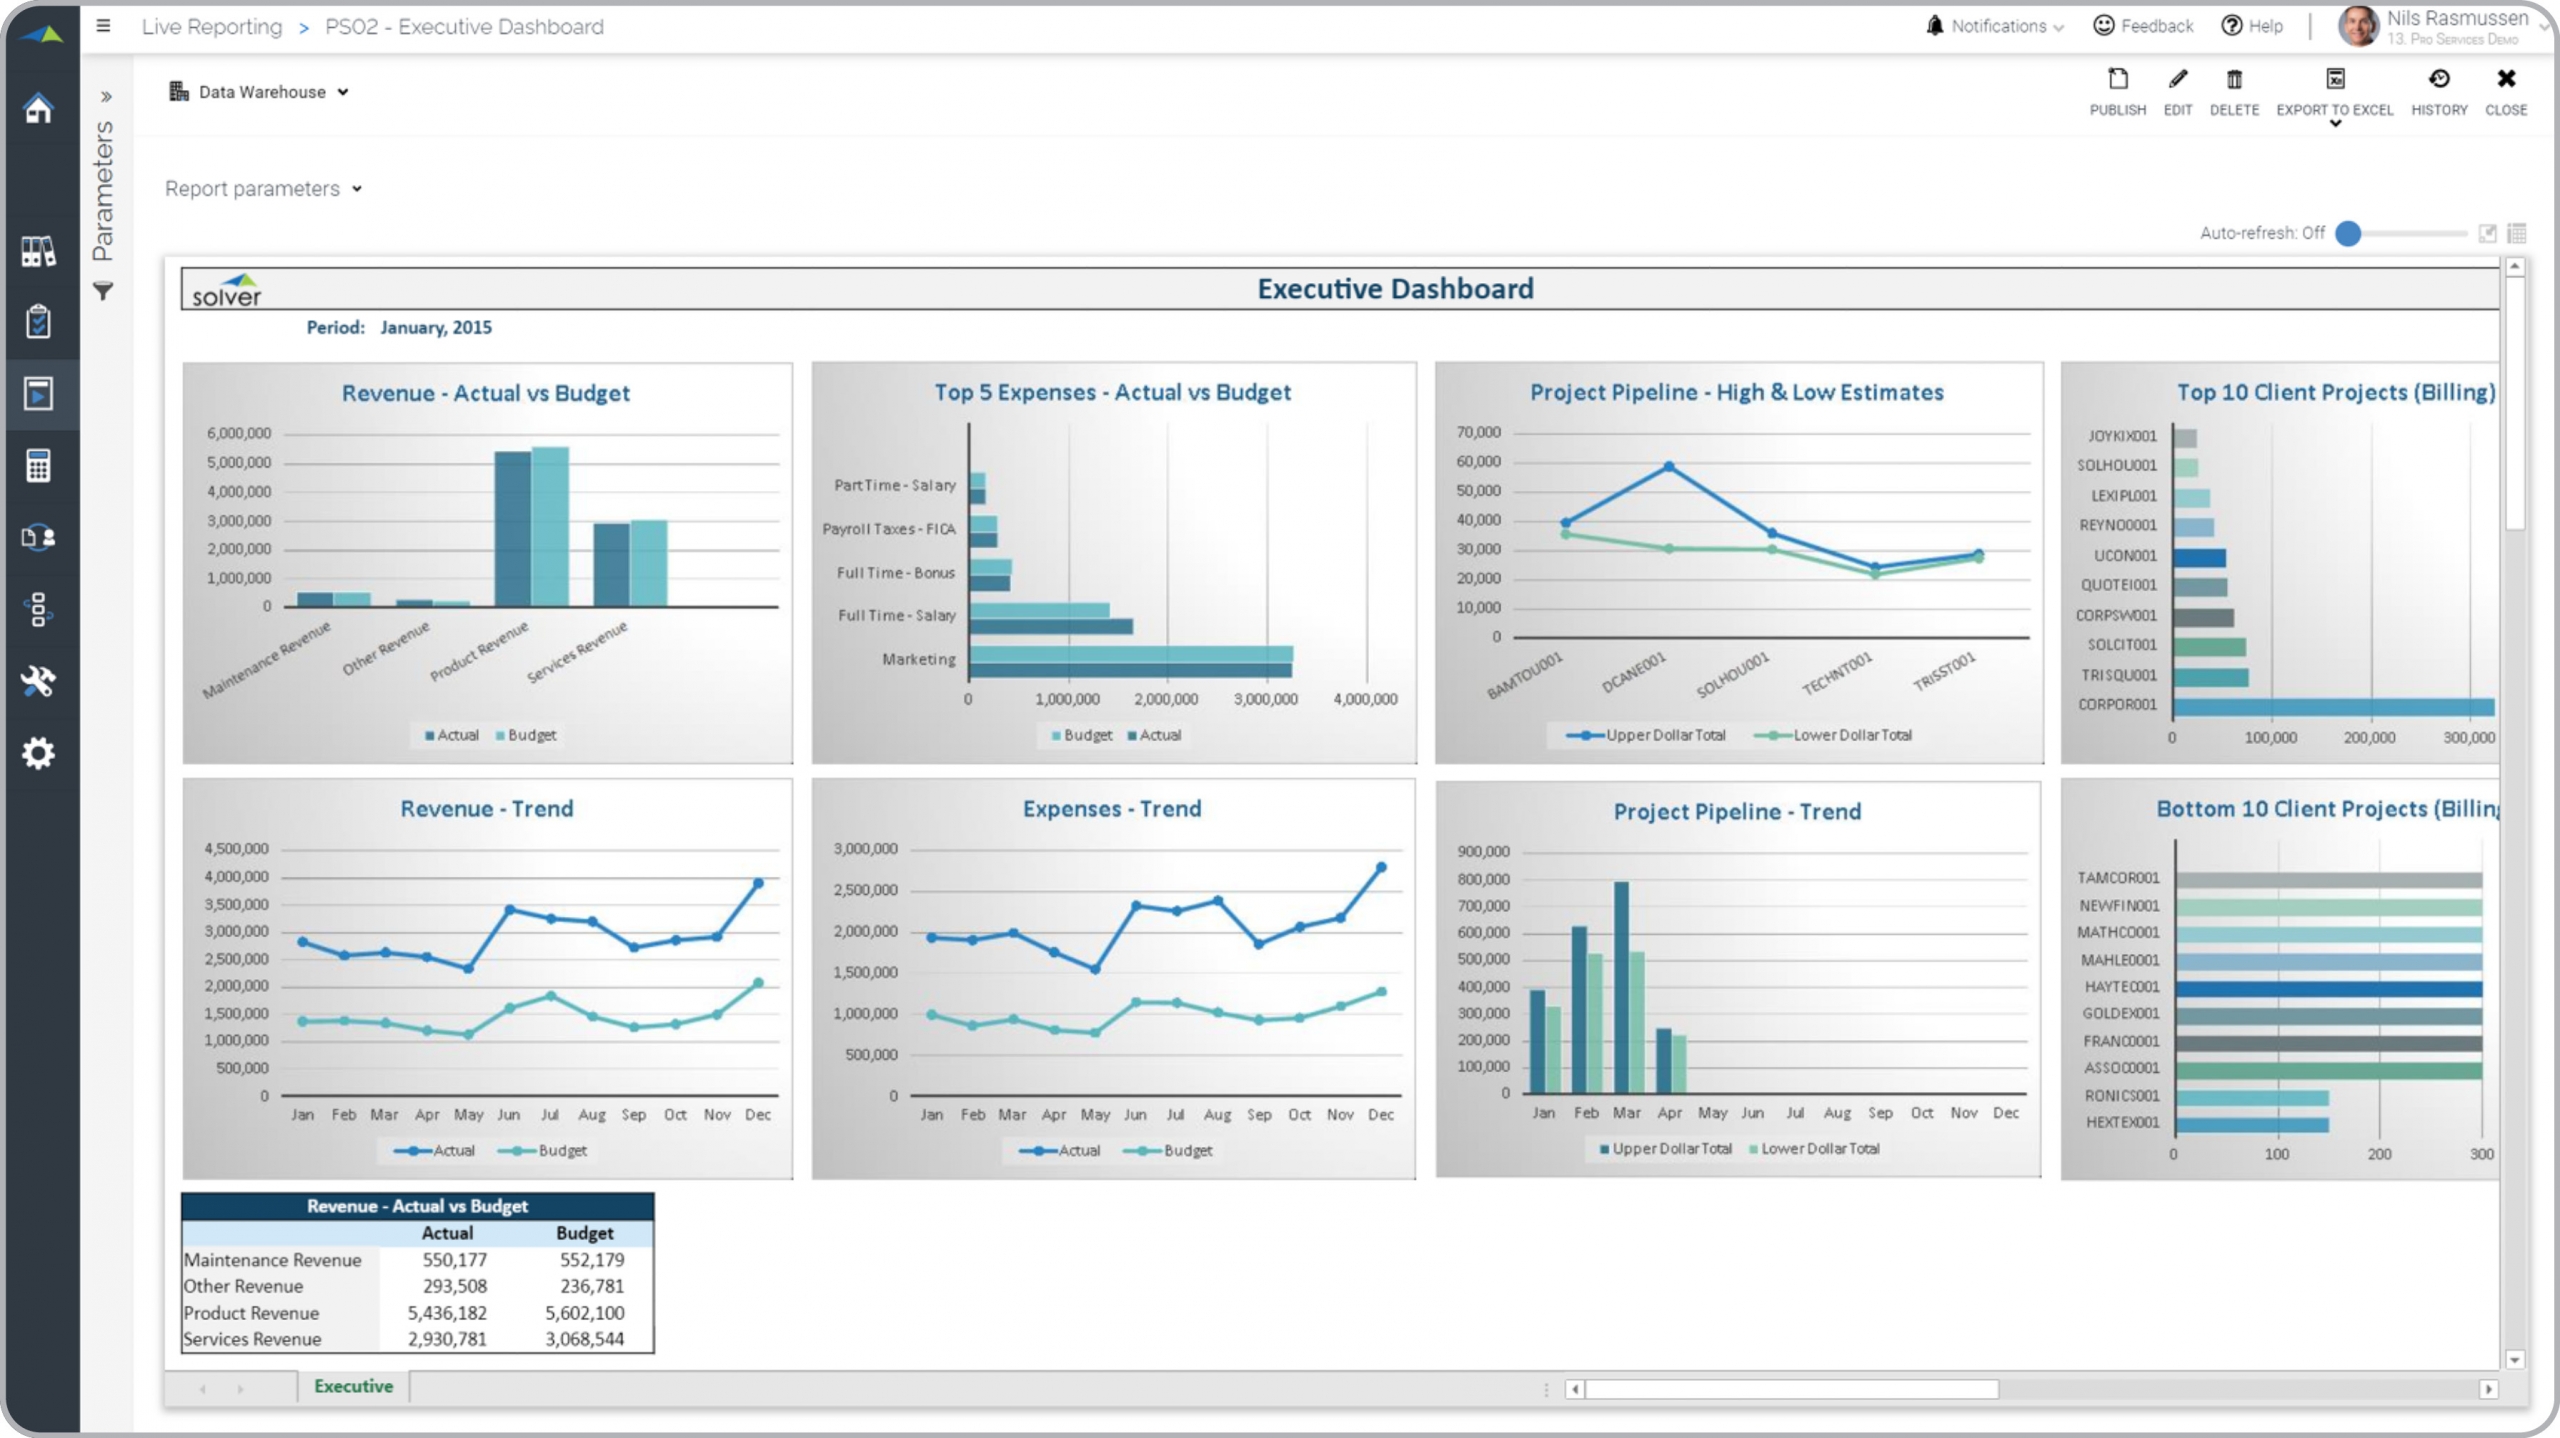
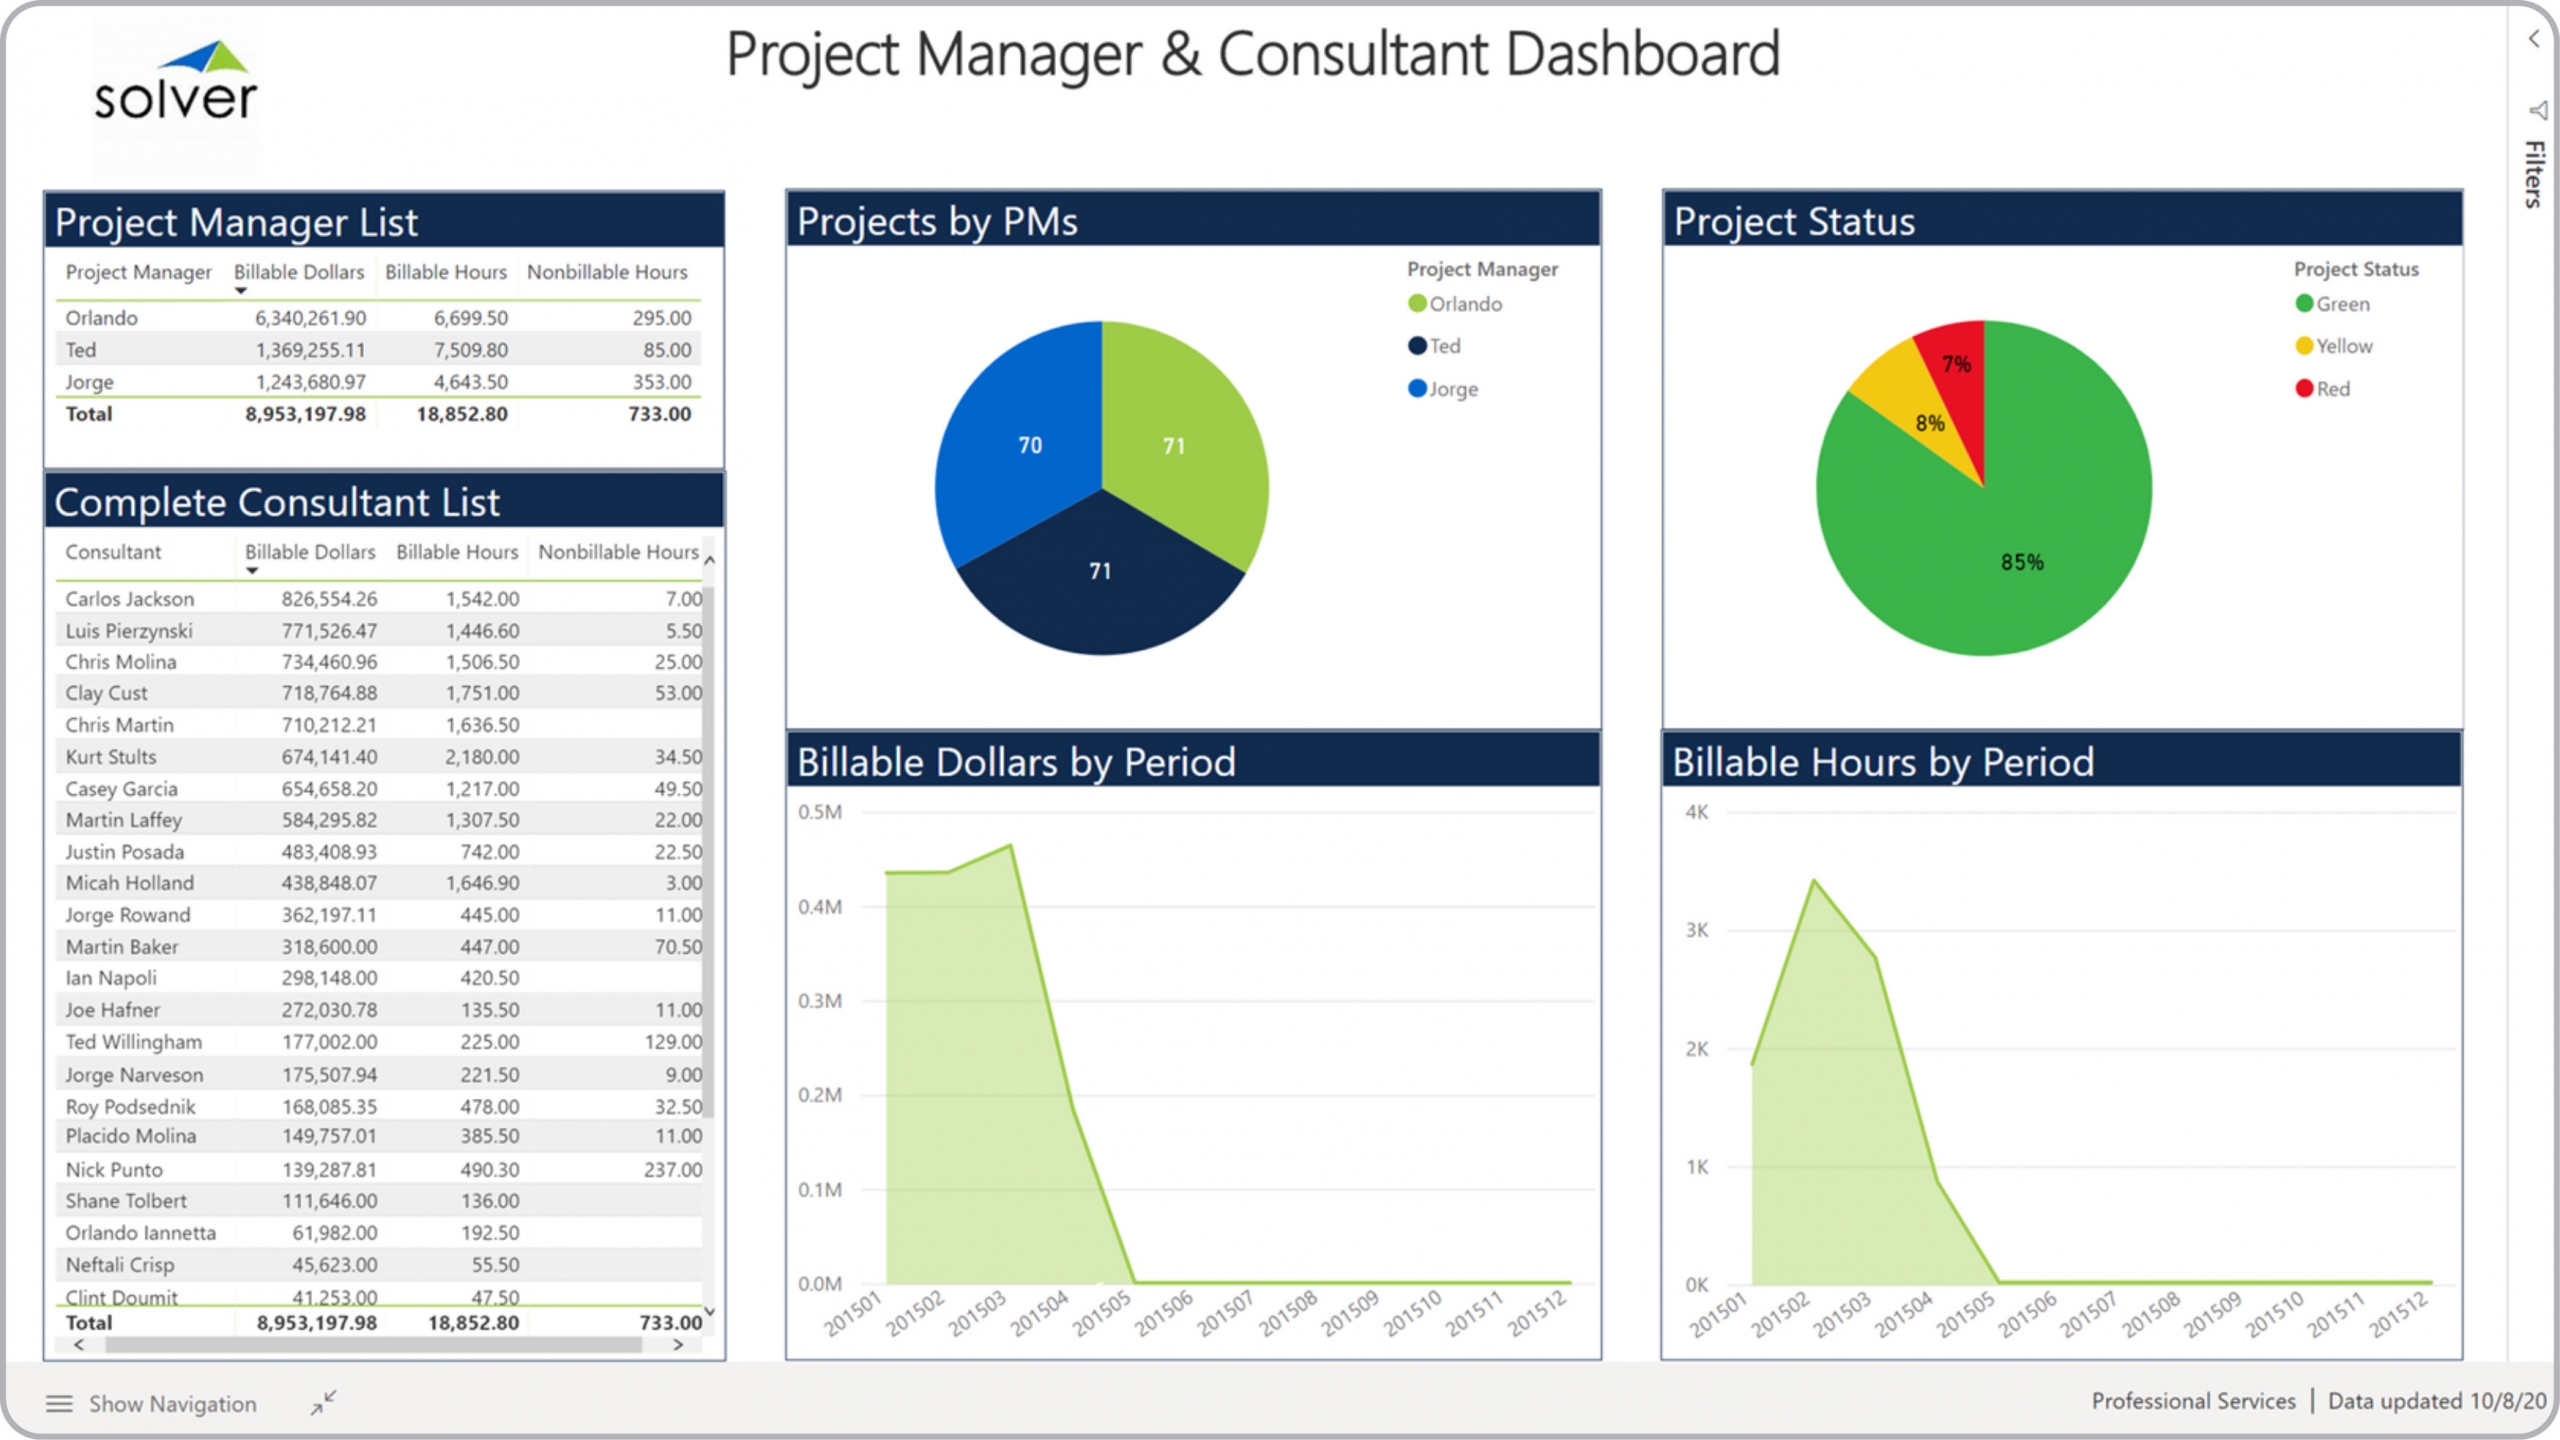
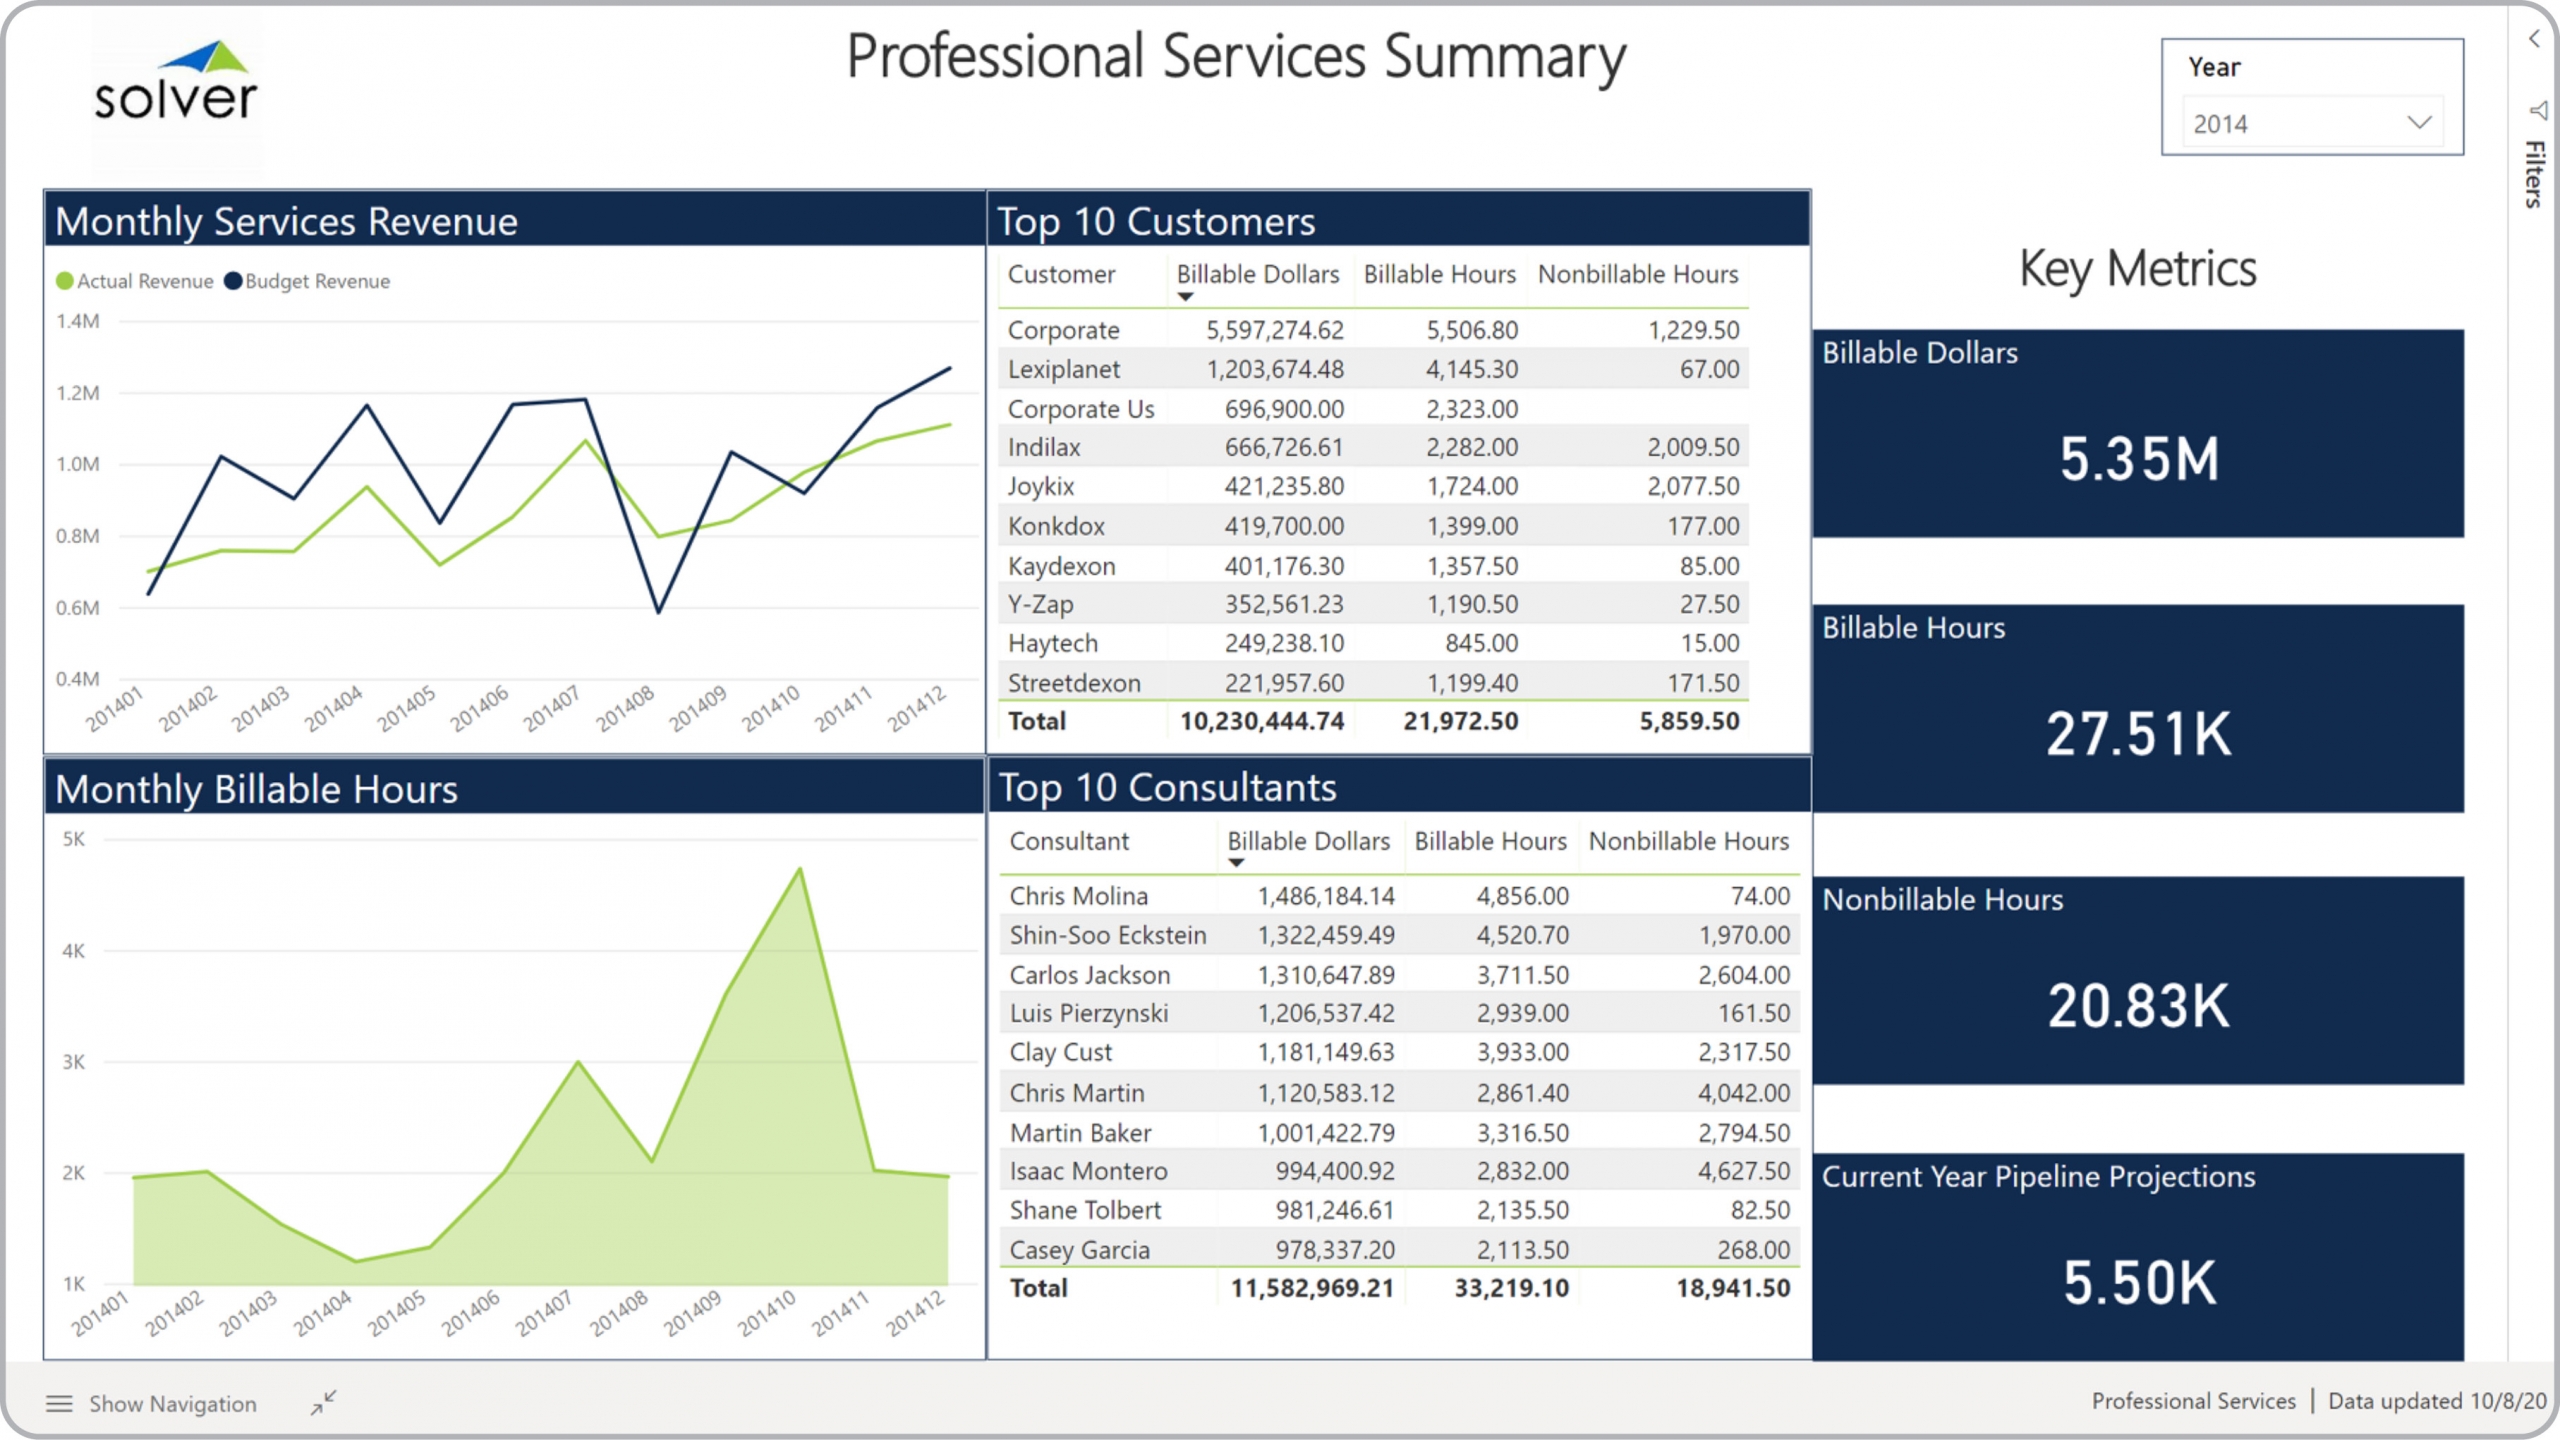
Executive Dashboard for Professional Services Companies
What is an Executive Dashboard for Professional Services Companies ? Executive Dashboards are ...
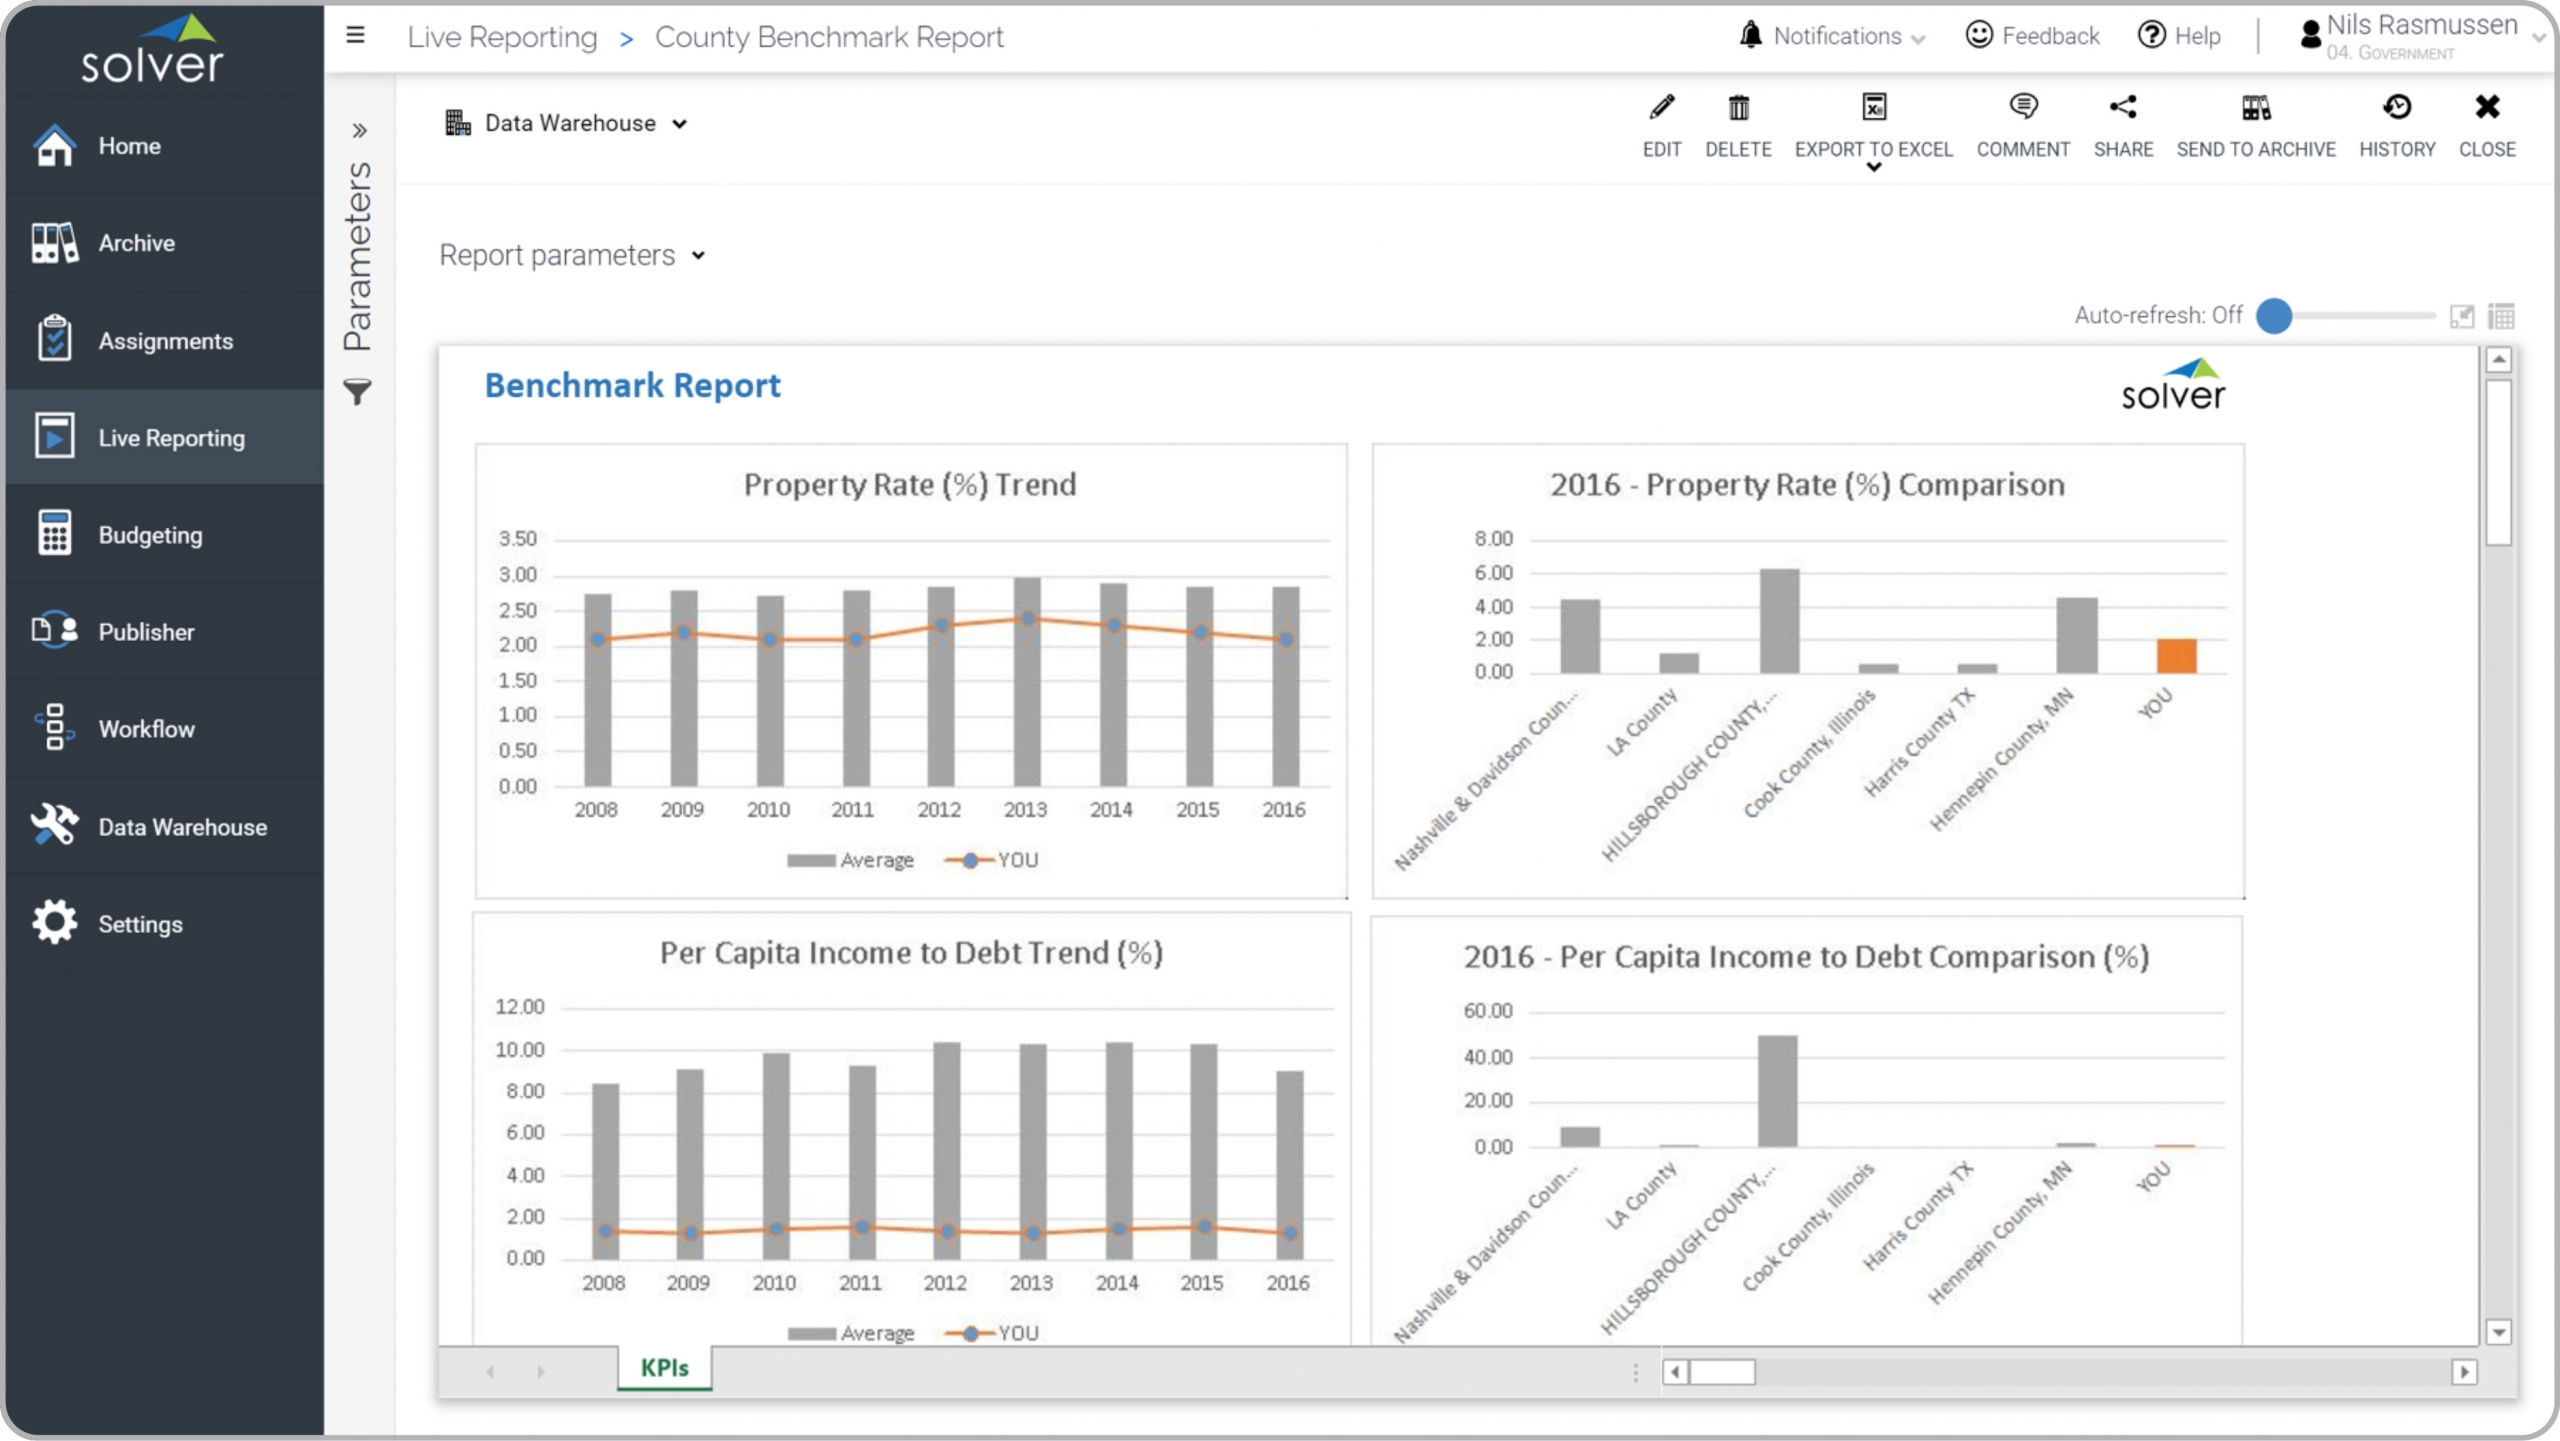
KPI Benchmark Report for Public Sector Organizations
What is a KPI Benchmark Report ? KPI Benchmark Reports and Dashboards are considered strategic ...
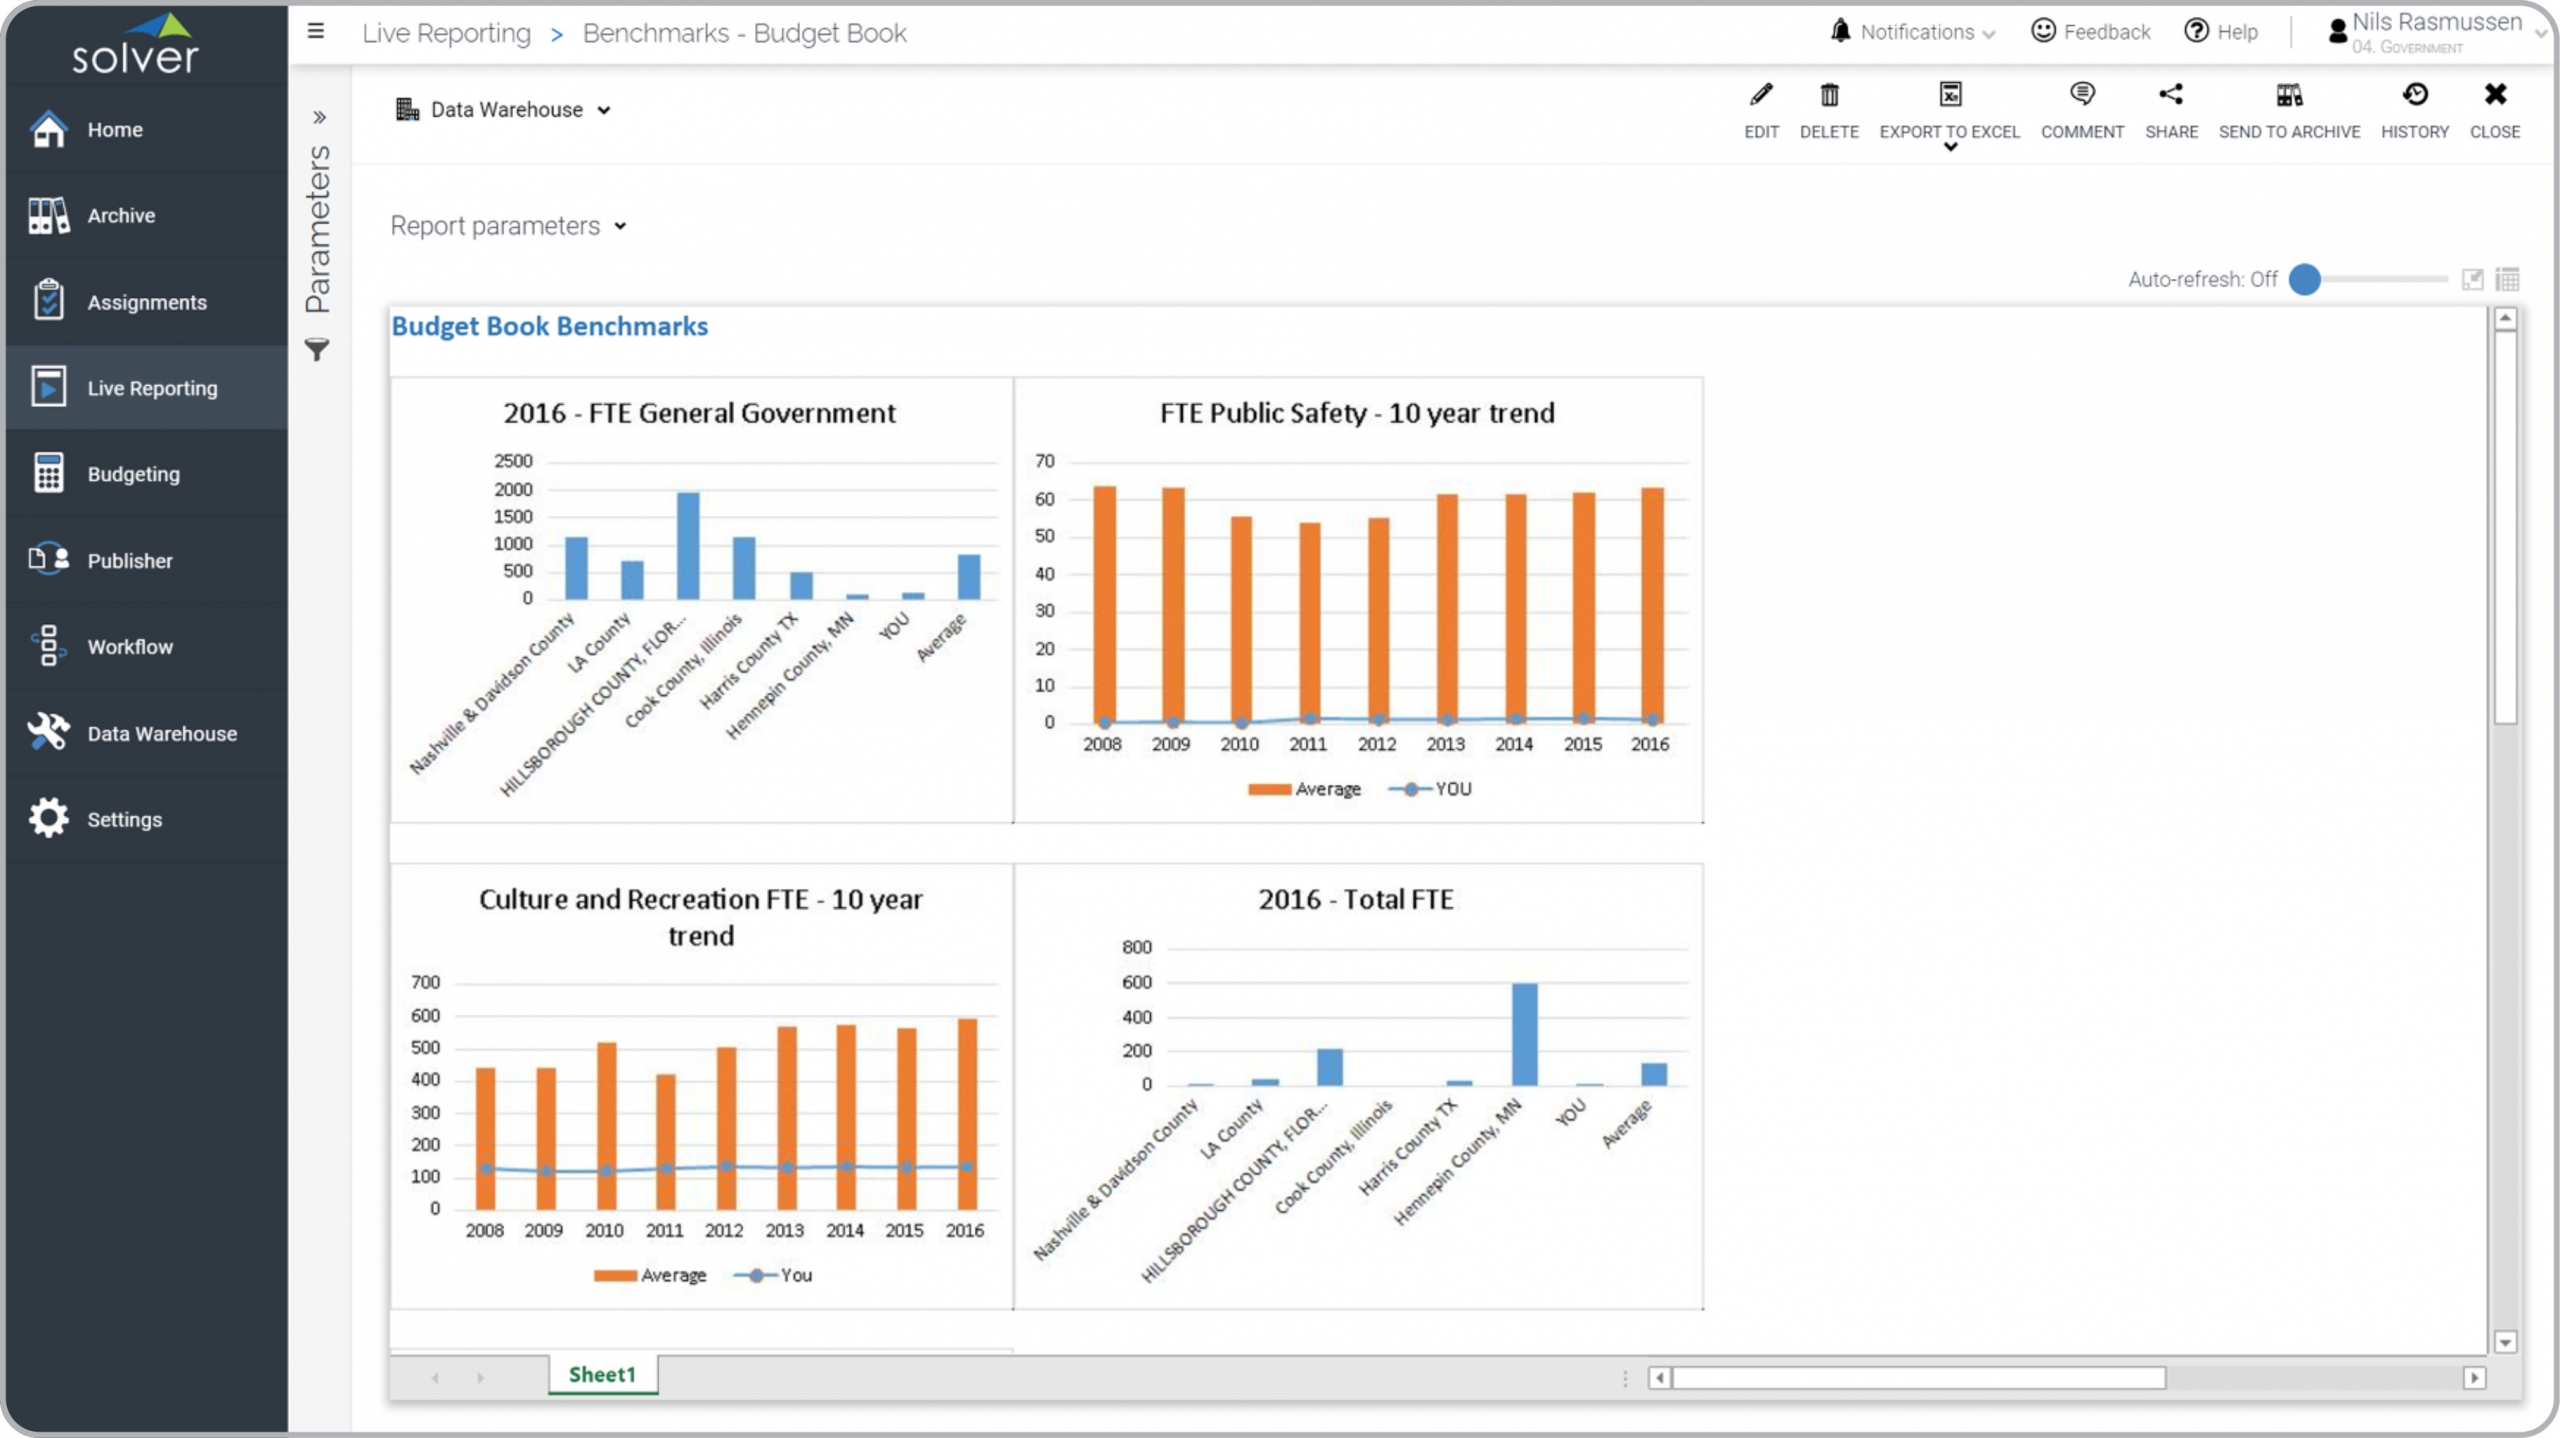
Budgeting Benchmark Dashboard for Public Sector Organizations
What is a Budgeting Benchmark Dashboard ? Budgeting Benchmark Dashboards and Reports are considered ...
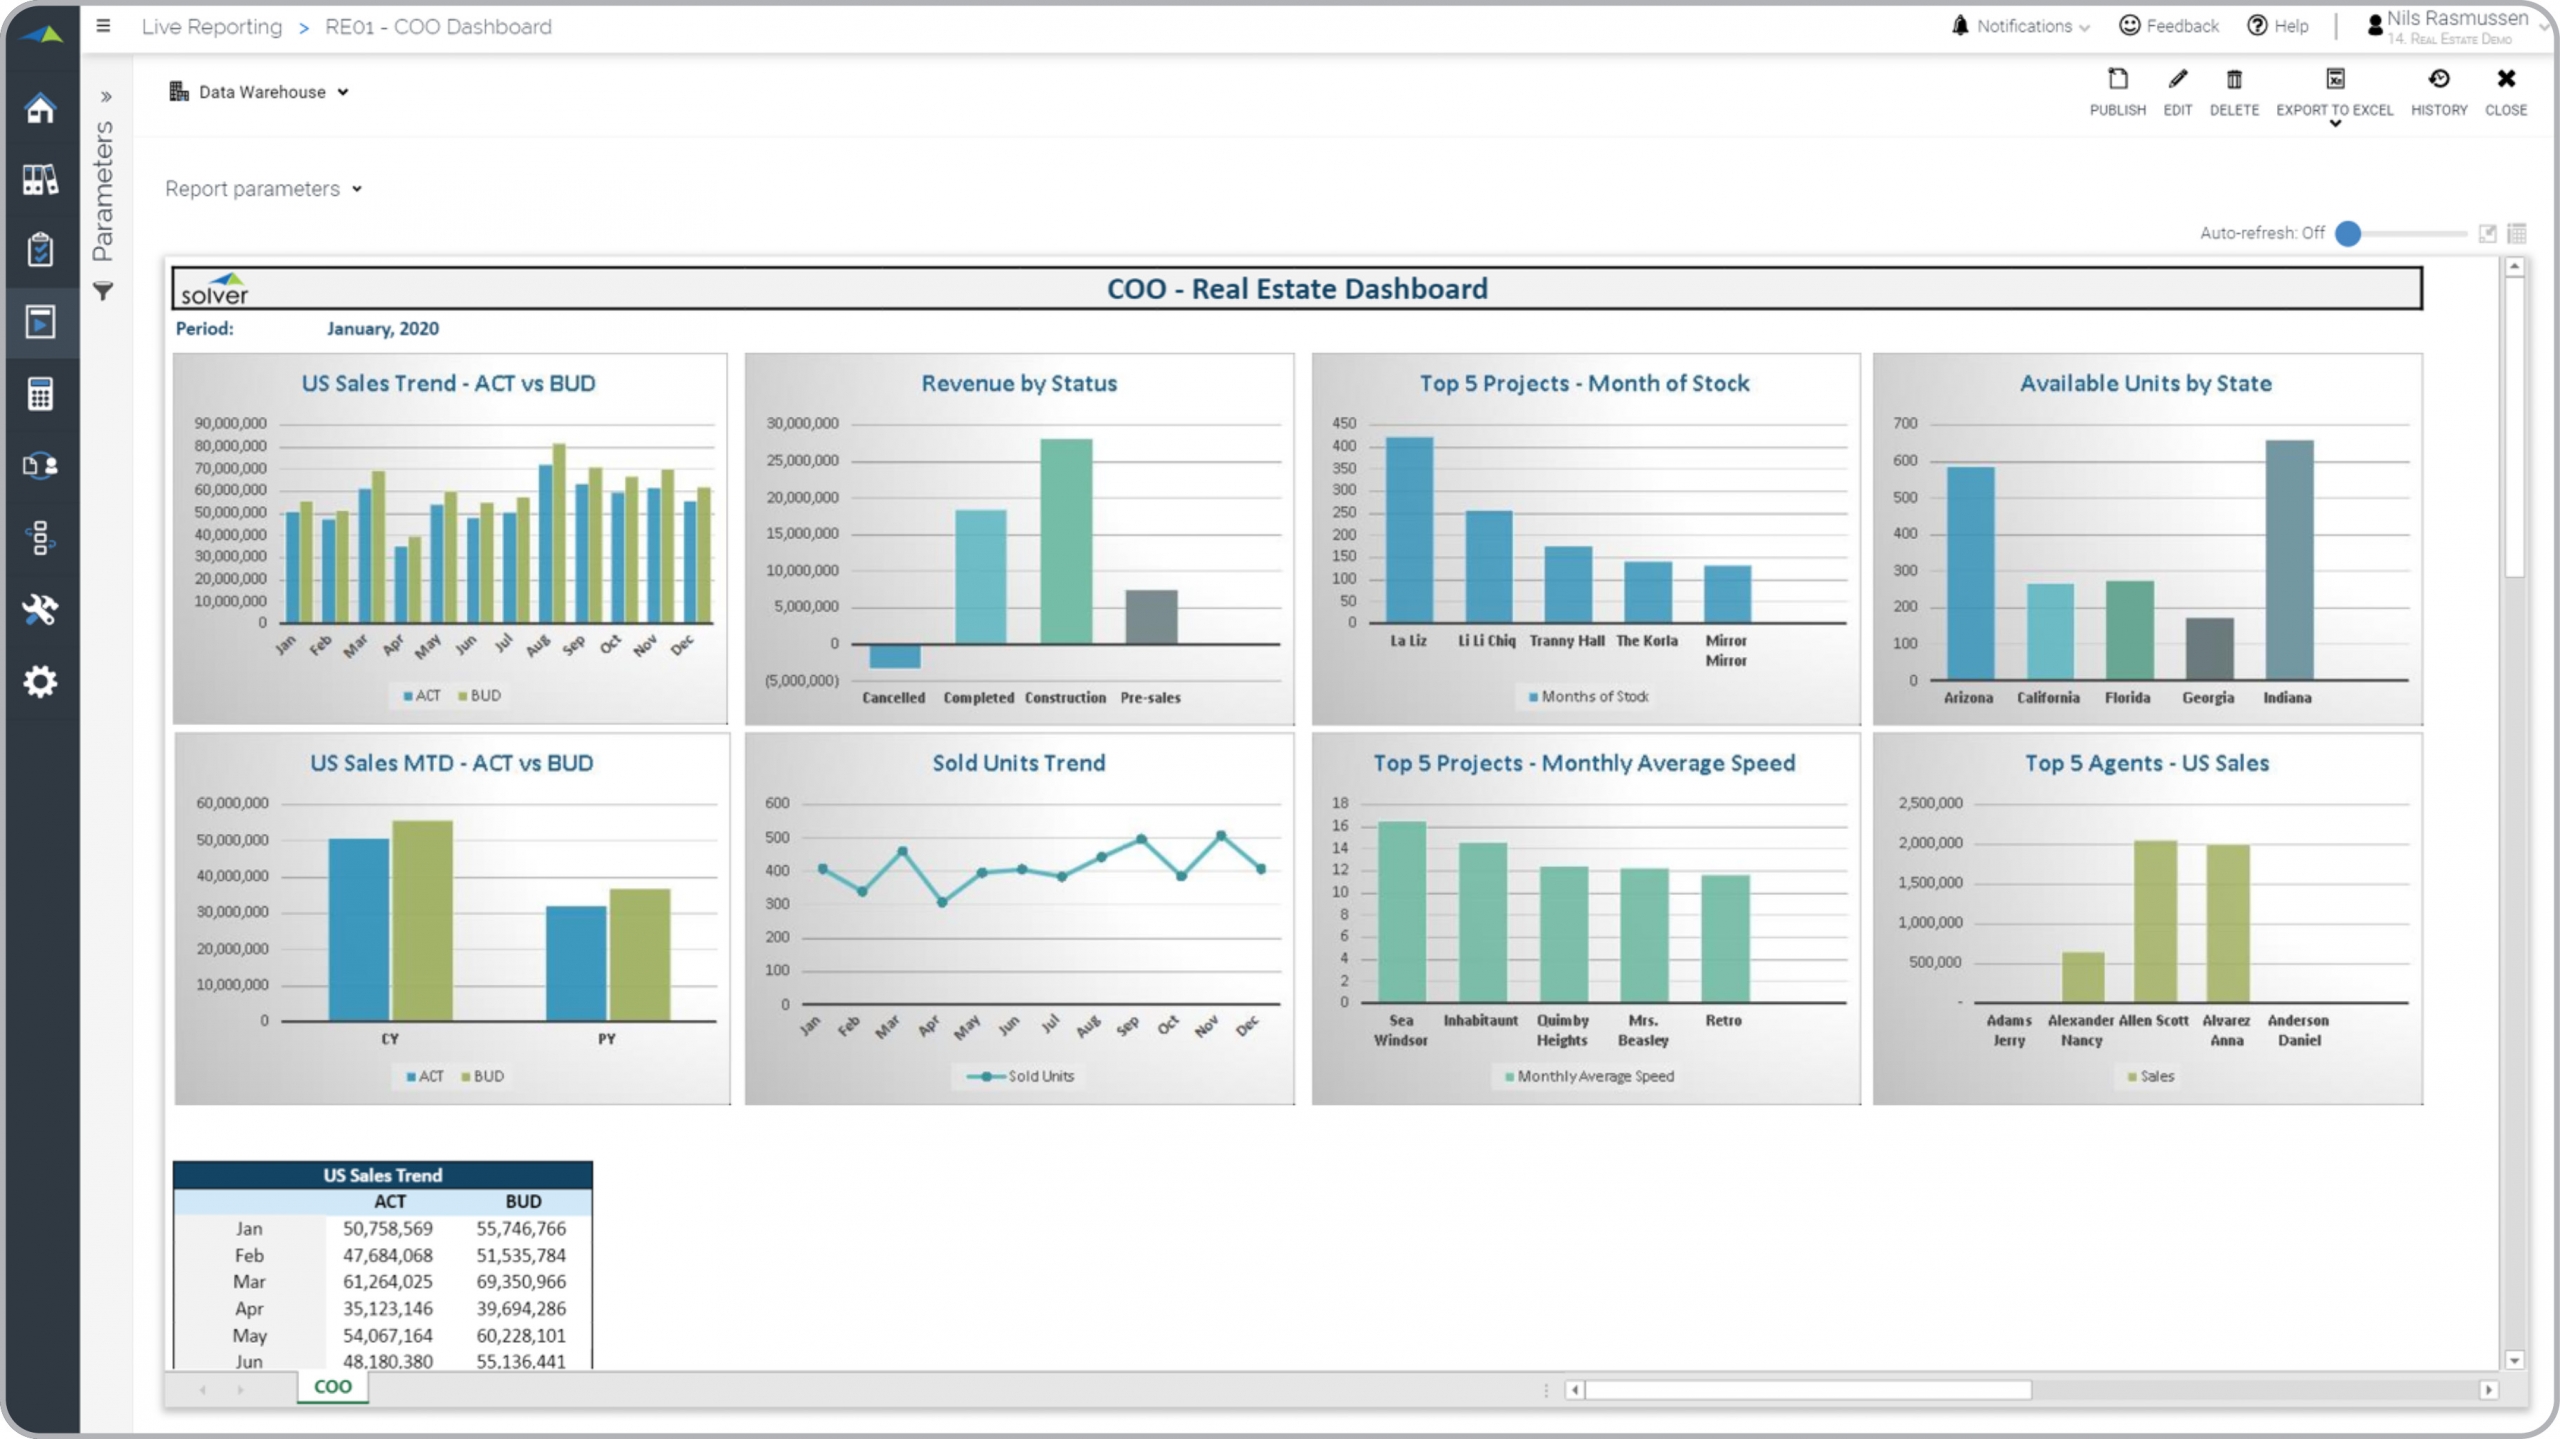
Executive Dashboard for Real Estate Companies
What is an Executive Dashboard for Real Estate Companies ? Executive dashboards are considered ...
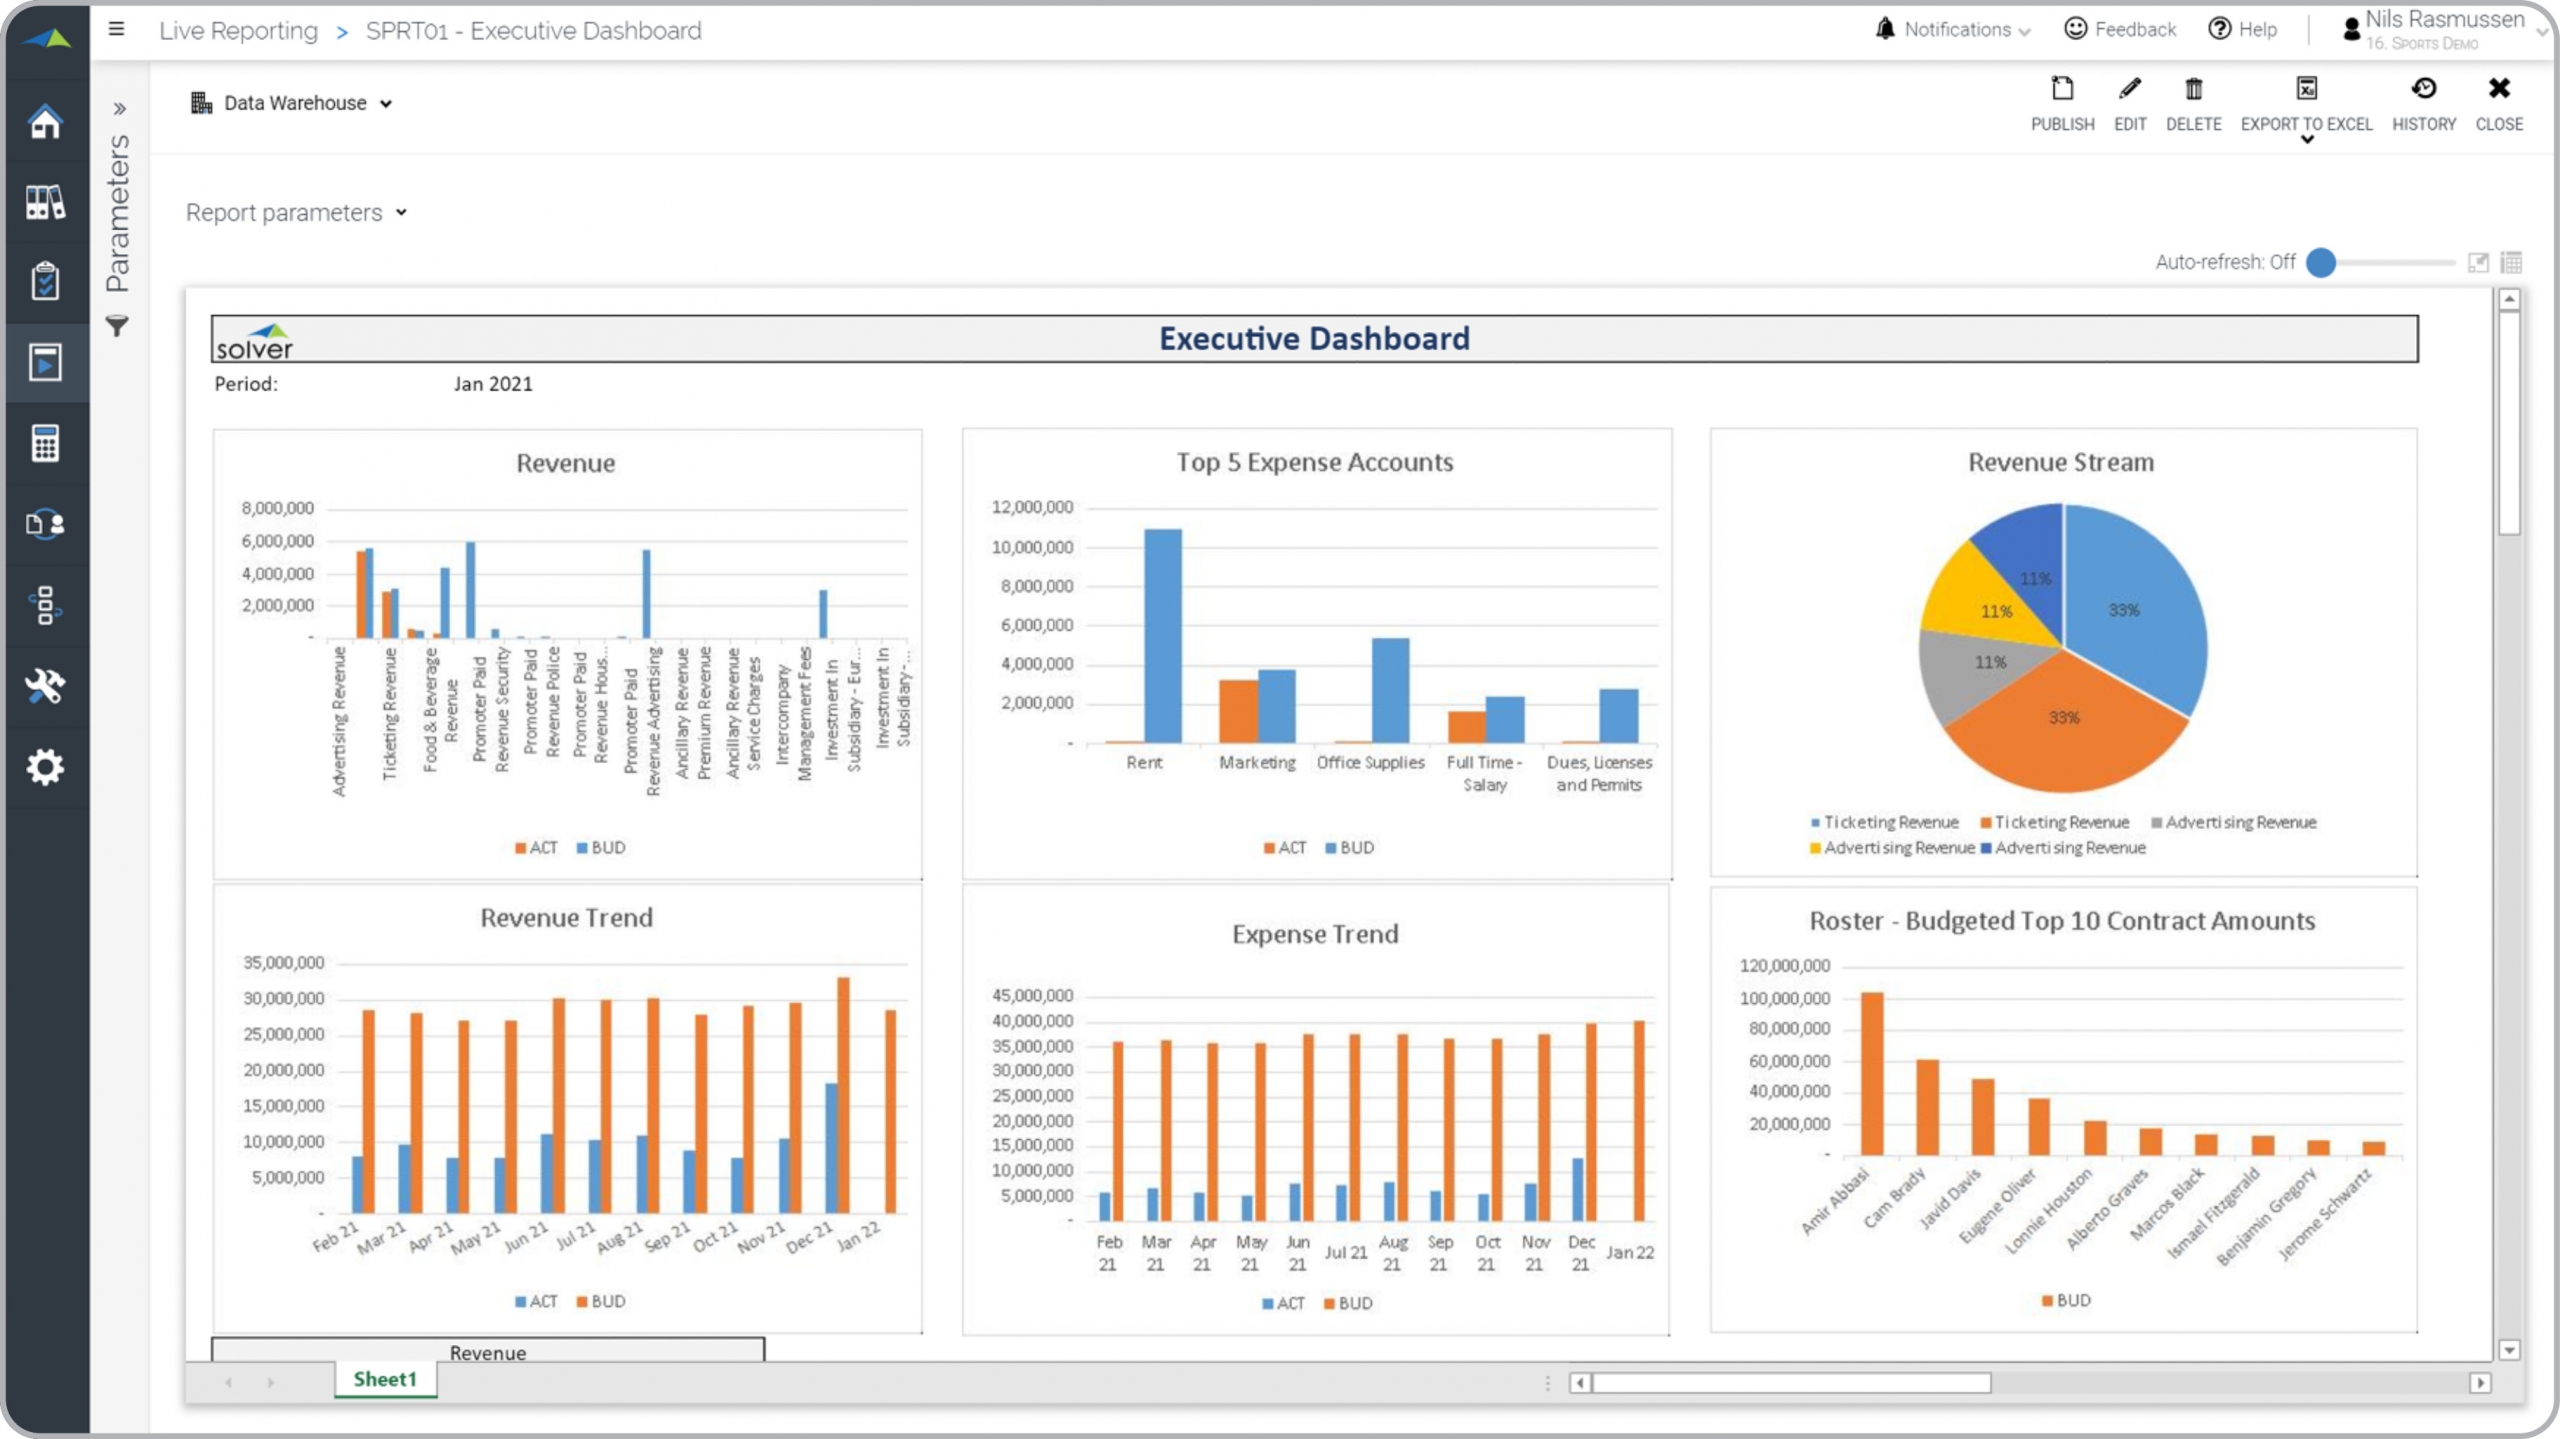
Executive Dashboard for Professional Sports Organizations
What is an Executive Dashboard ? Executive financial dashboards are considered decision-support ...
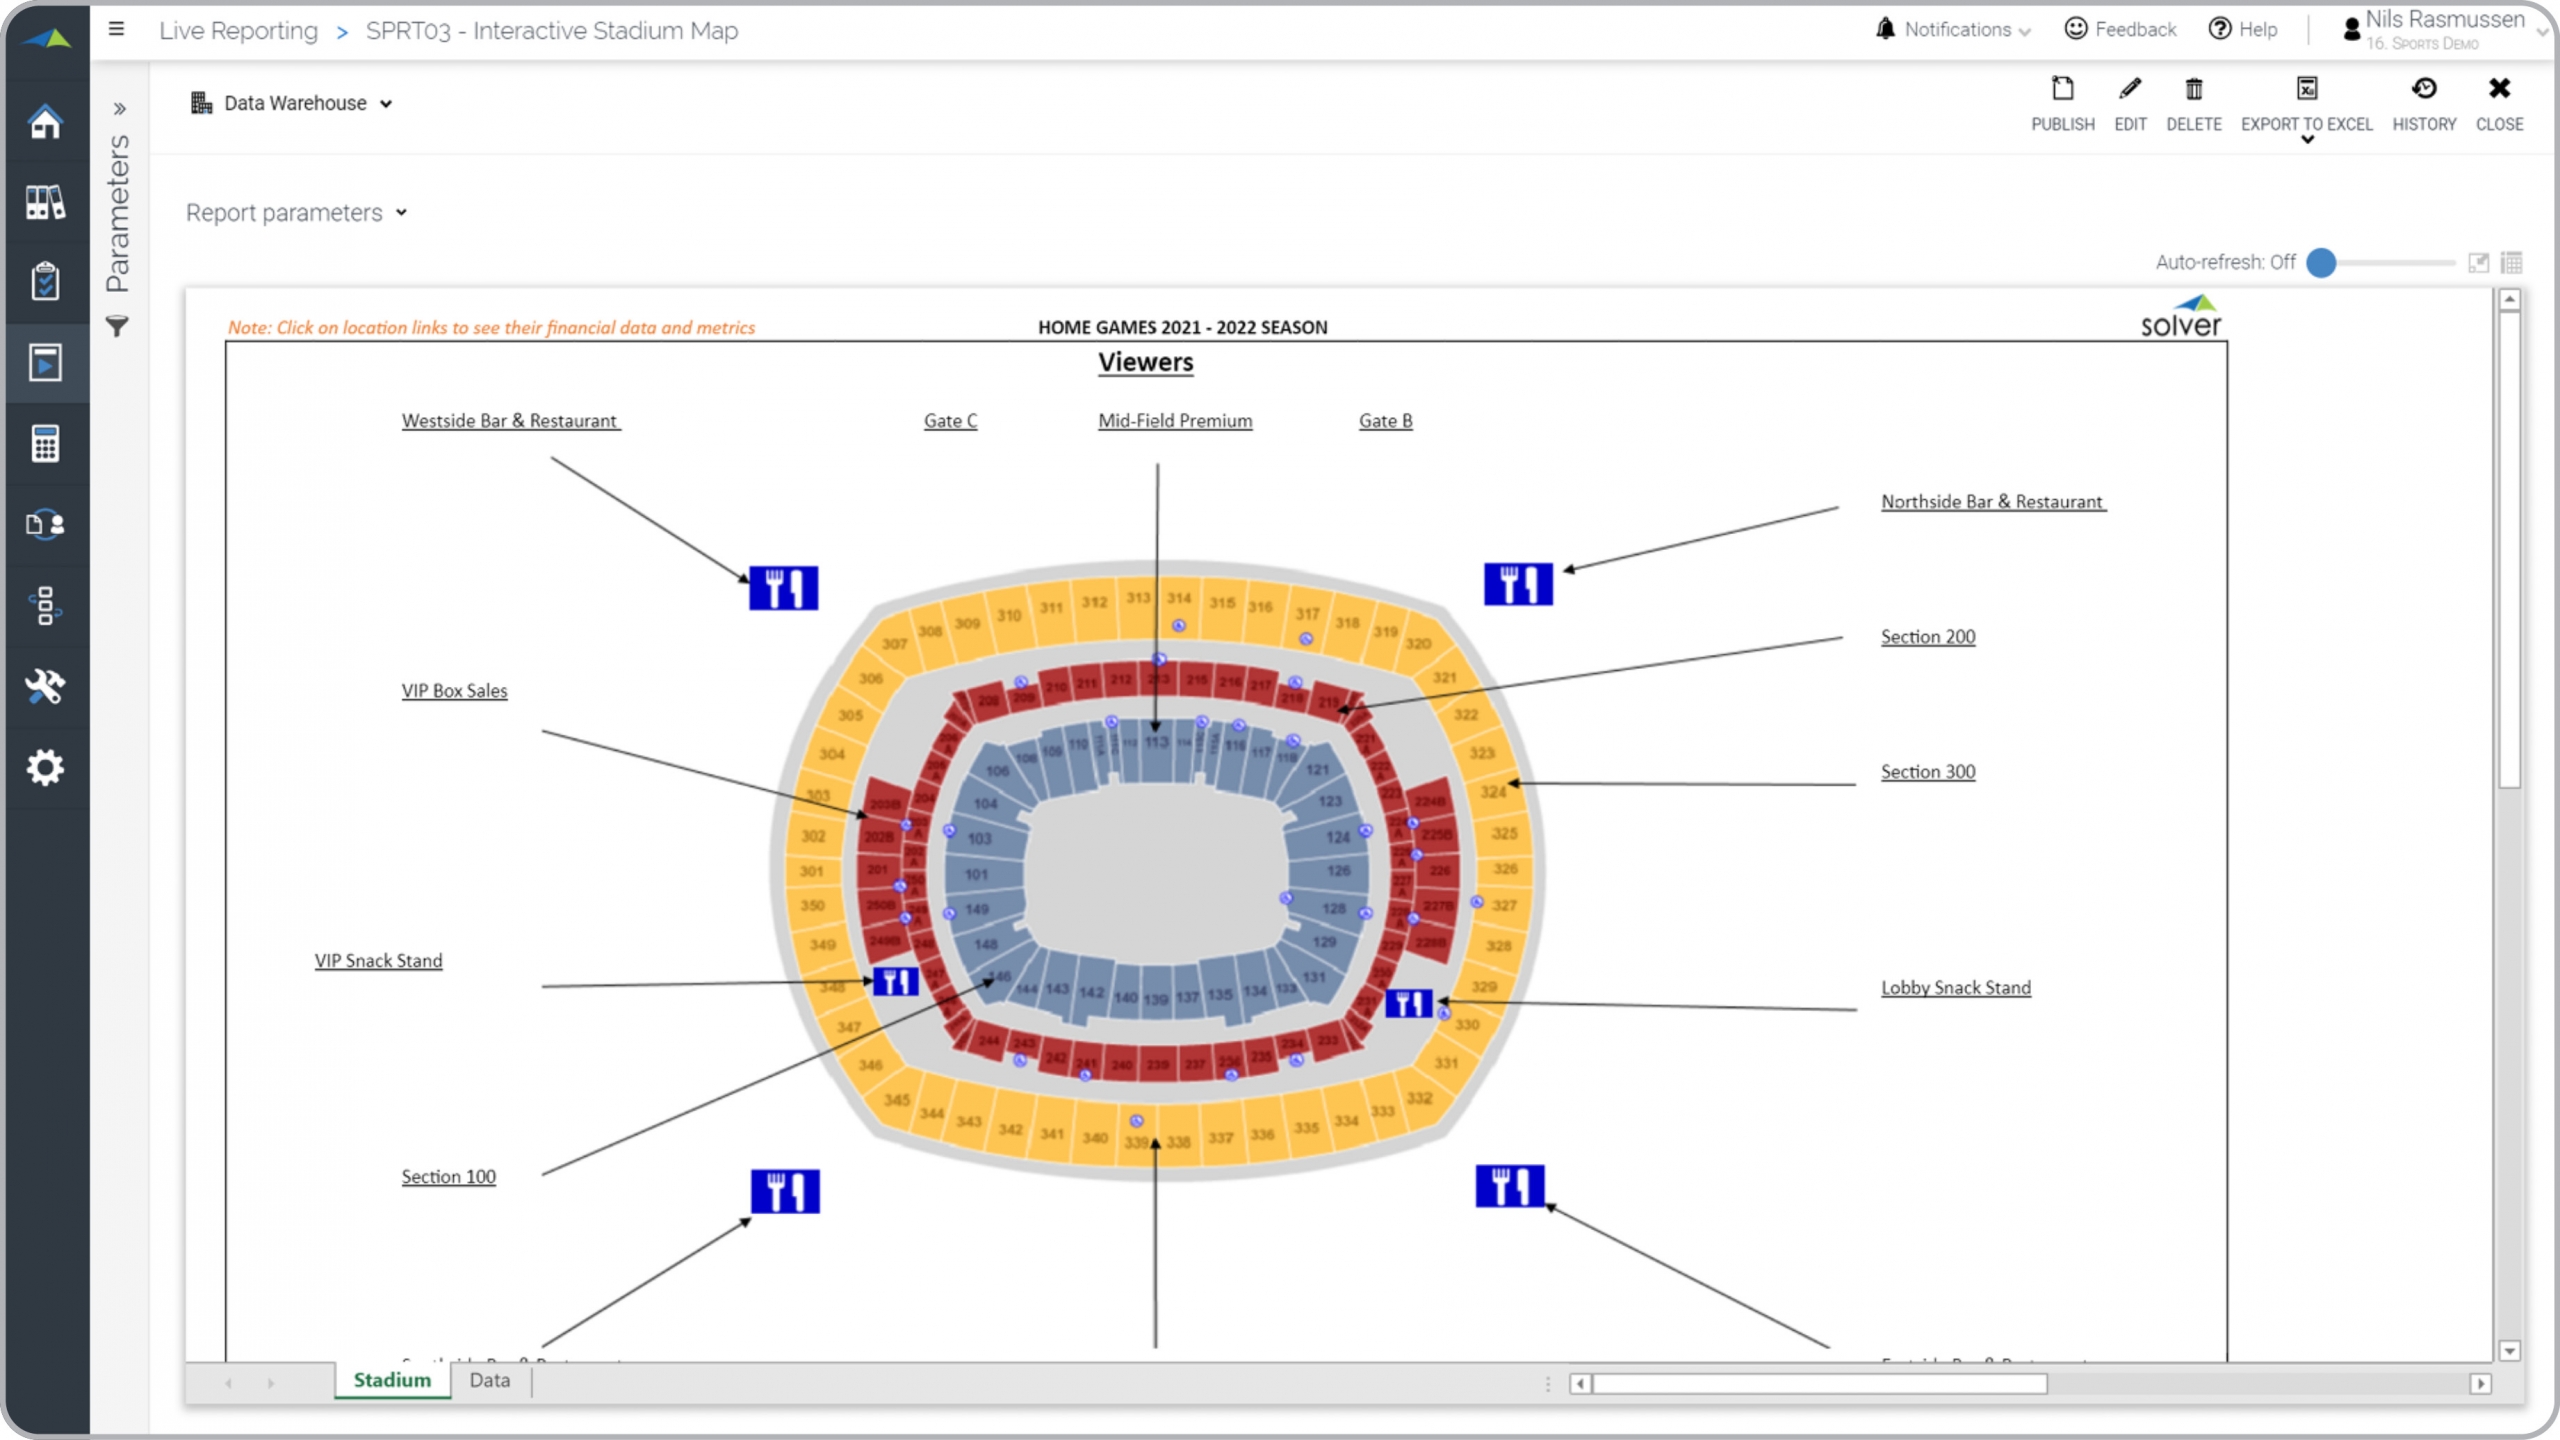
Stadium Revenue Report for Sports Venues
What is a Stadium Revenue Report ? Stadium Revenue Reports are considered sales analysis tools and ...
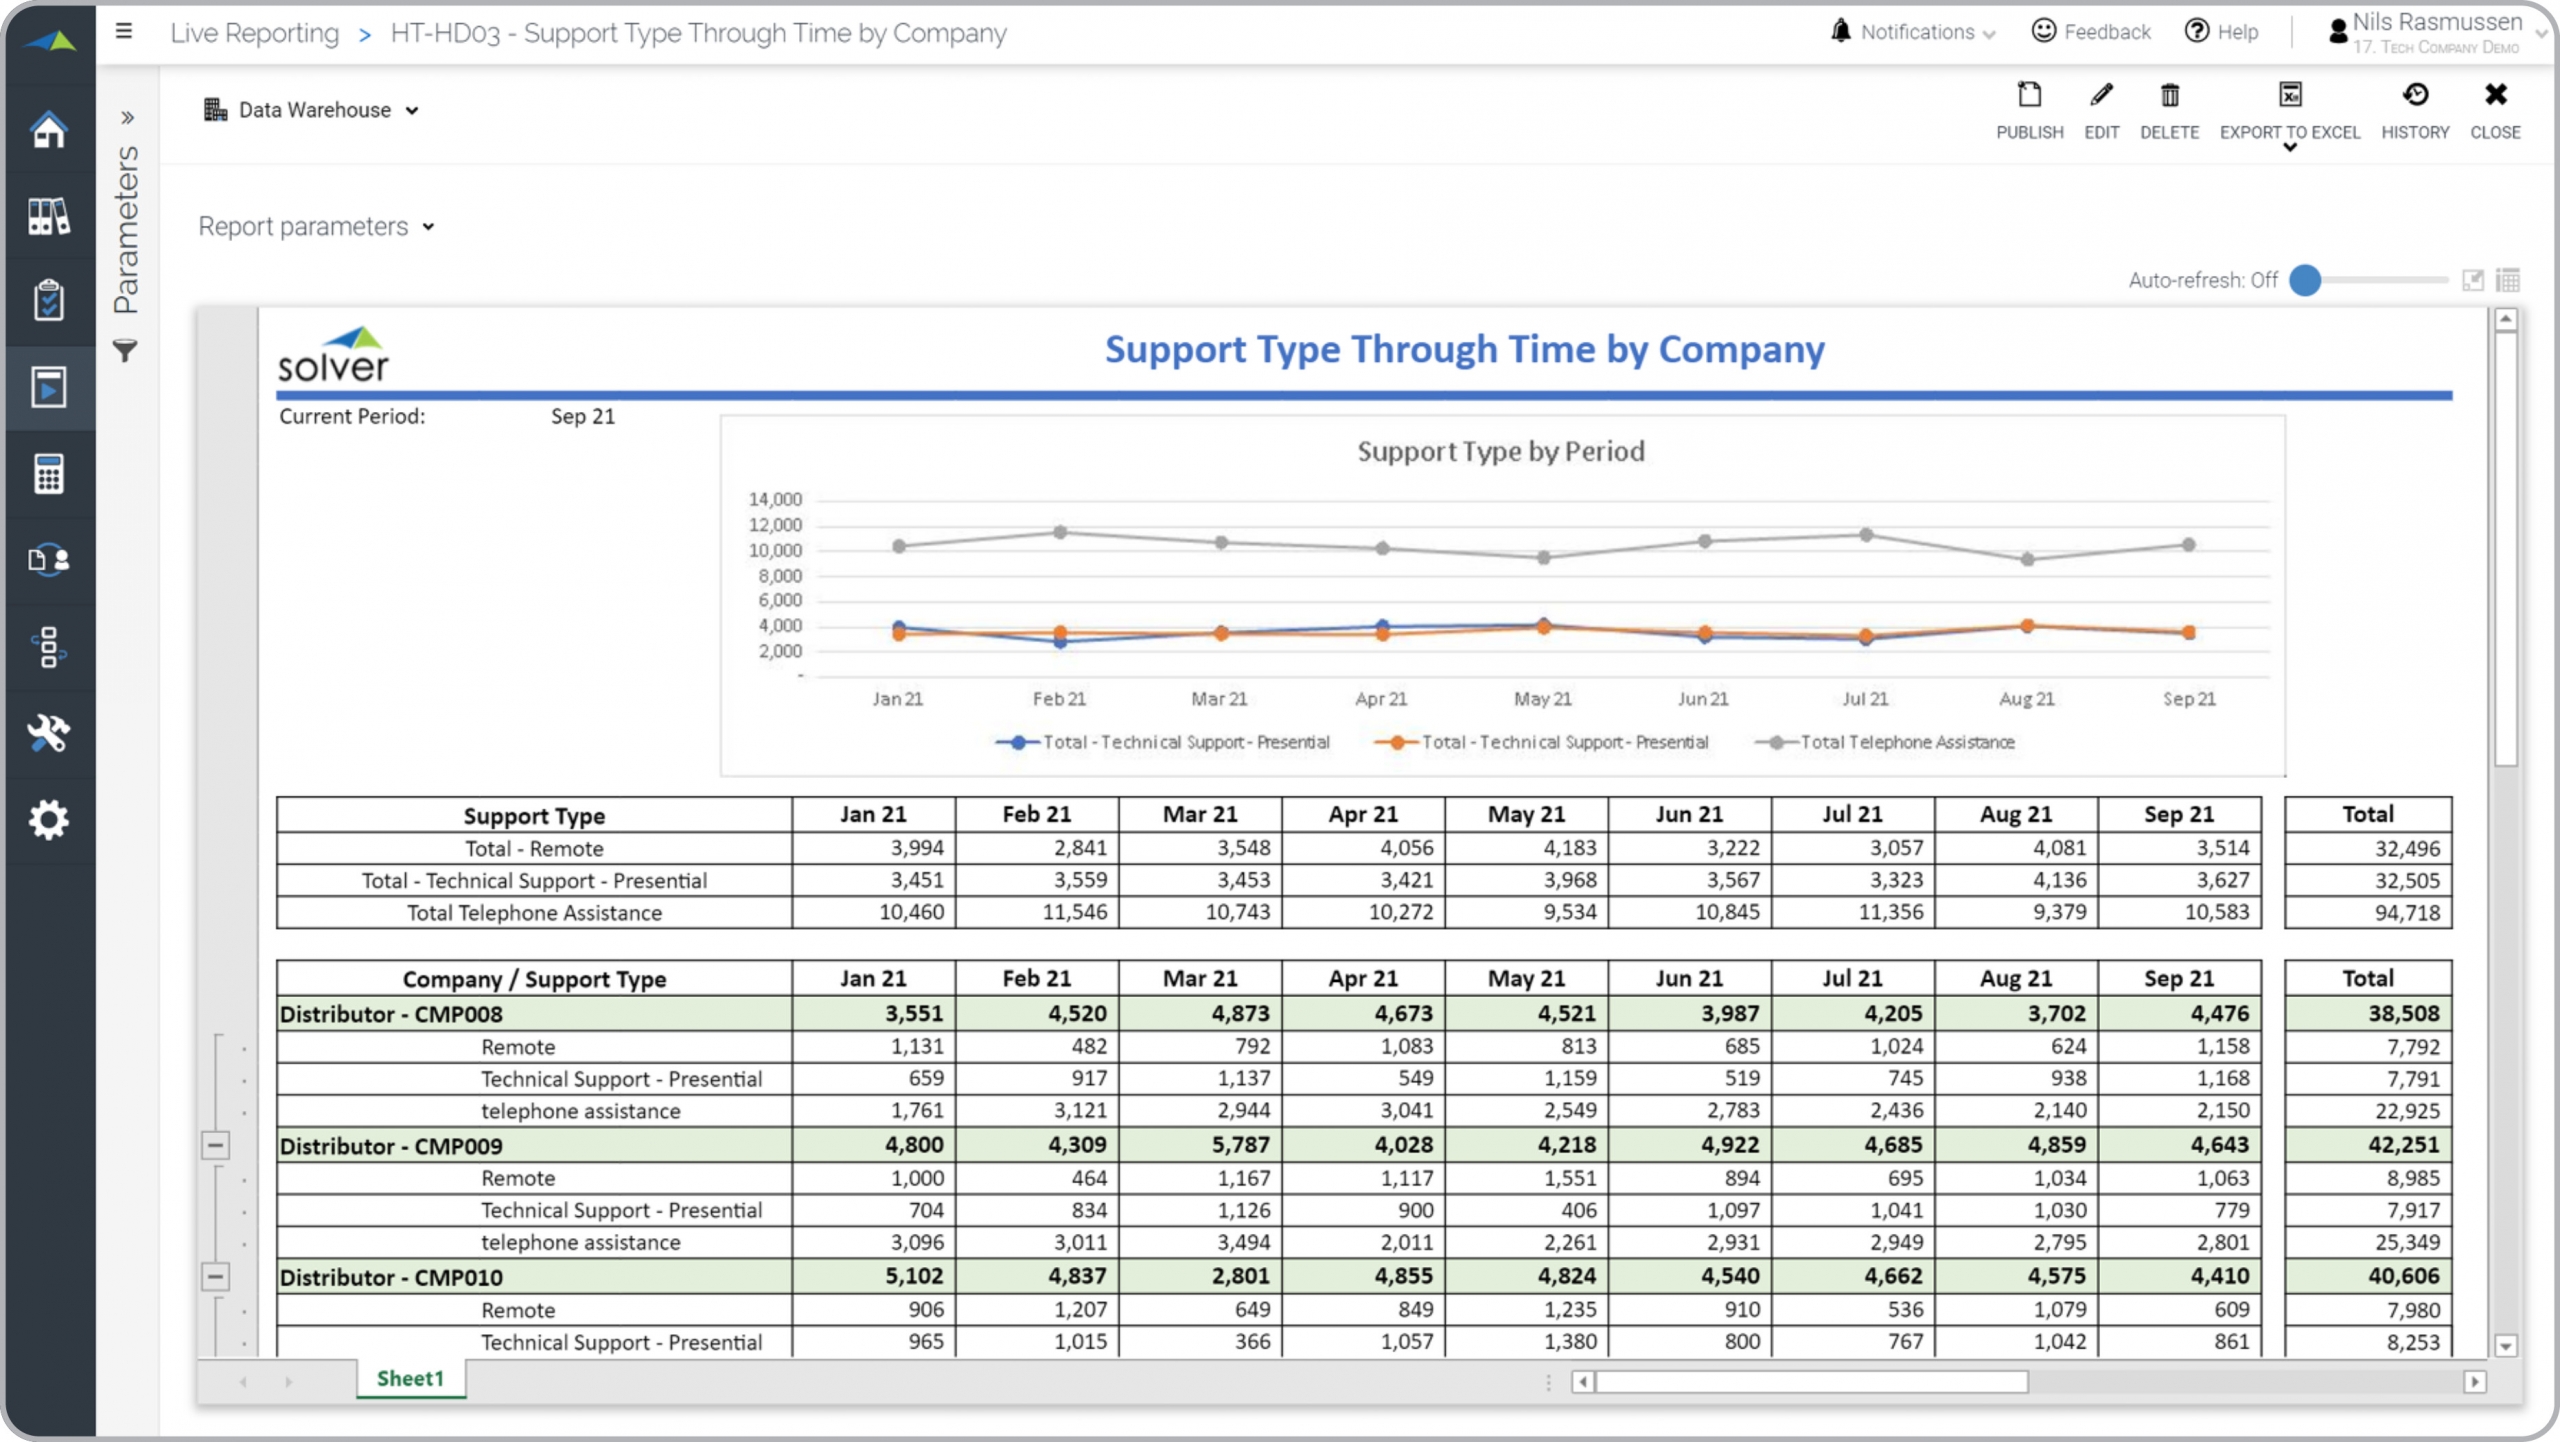
Helpdesk Support Case Trend Report for a Technology Company
What is a Helpdesk Support Trend Report ? Support type trend reports are considered helpdesk ...
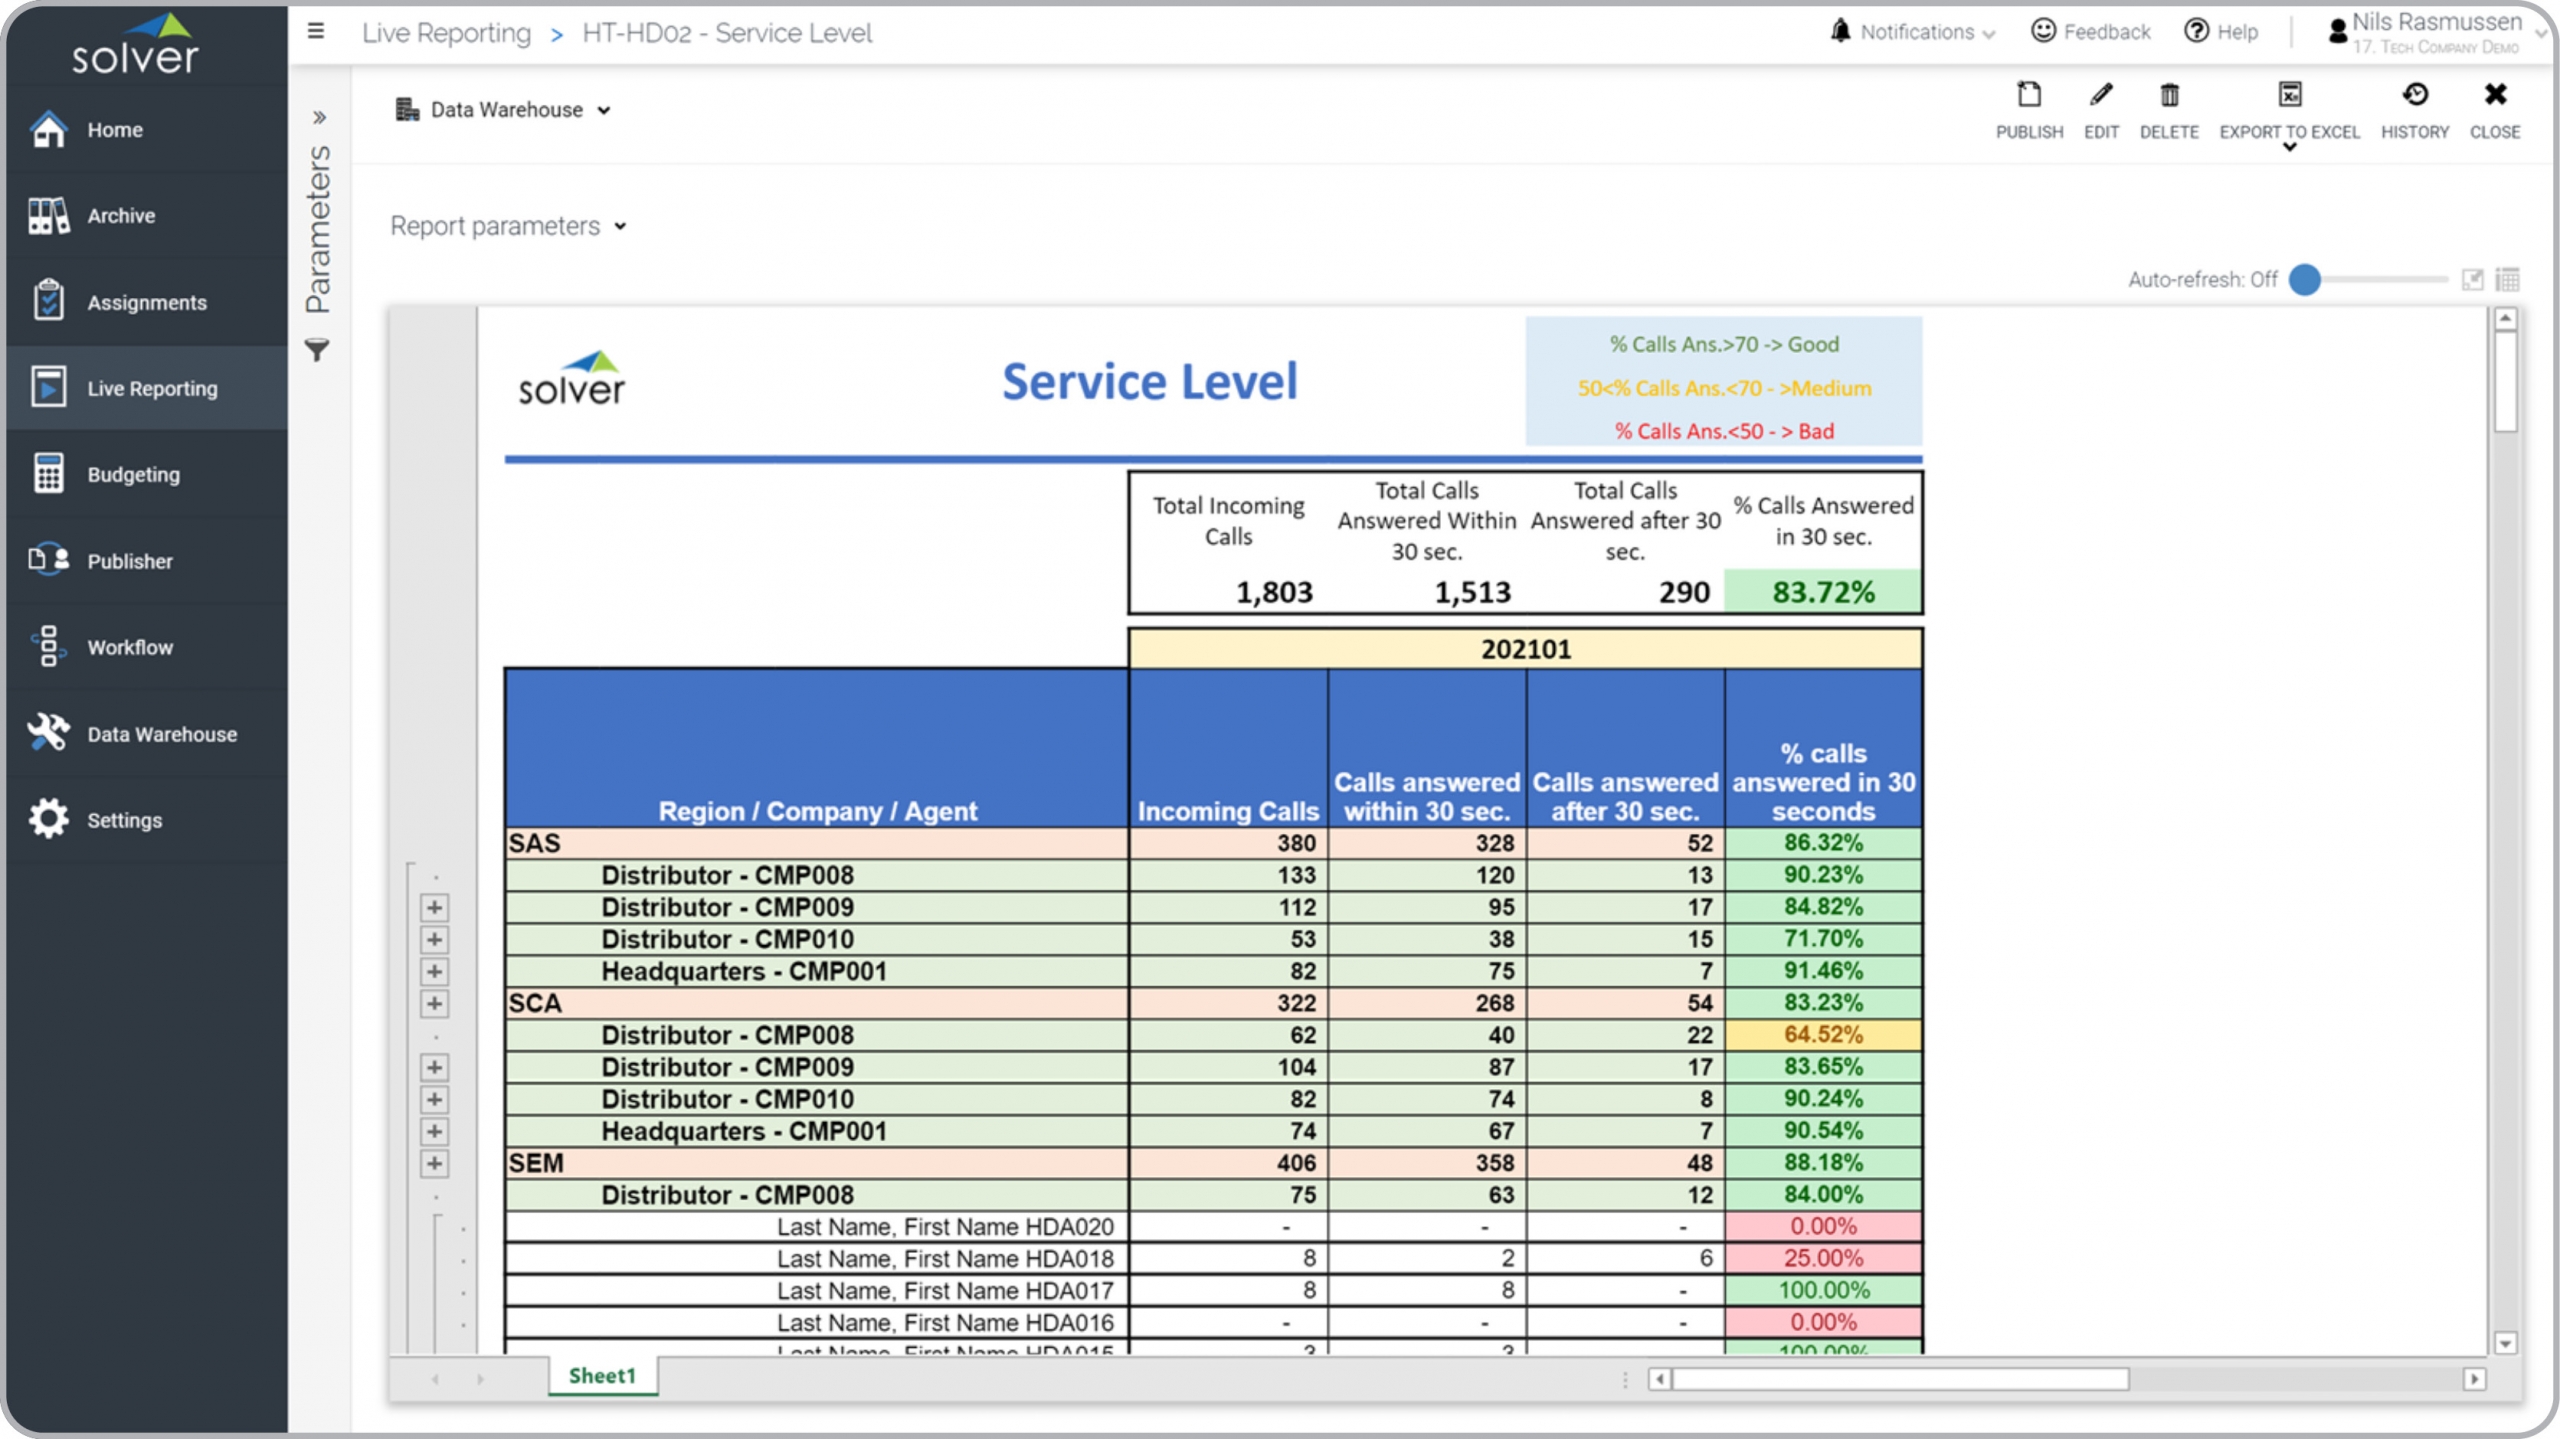
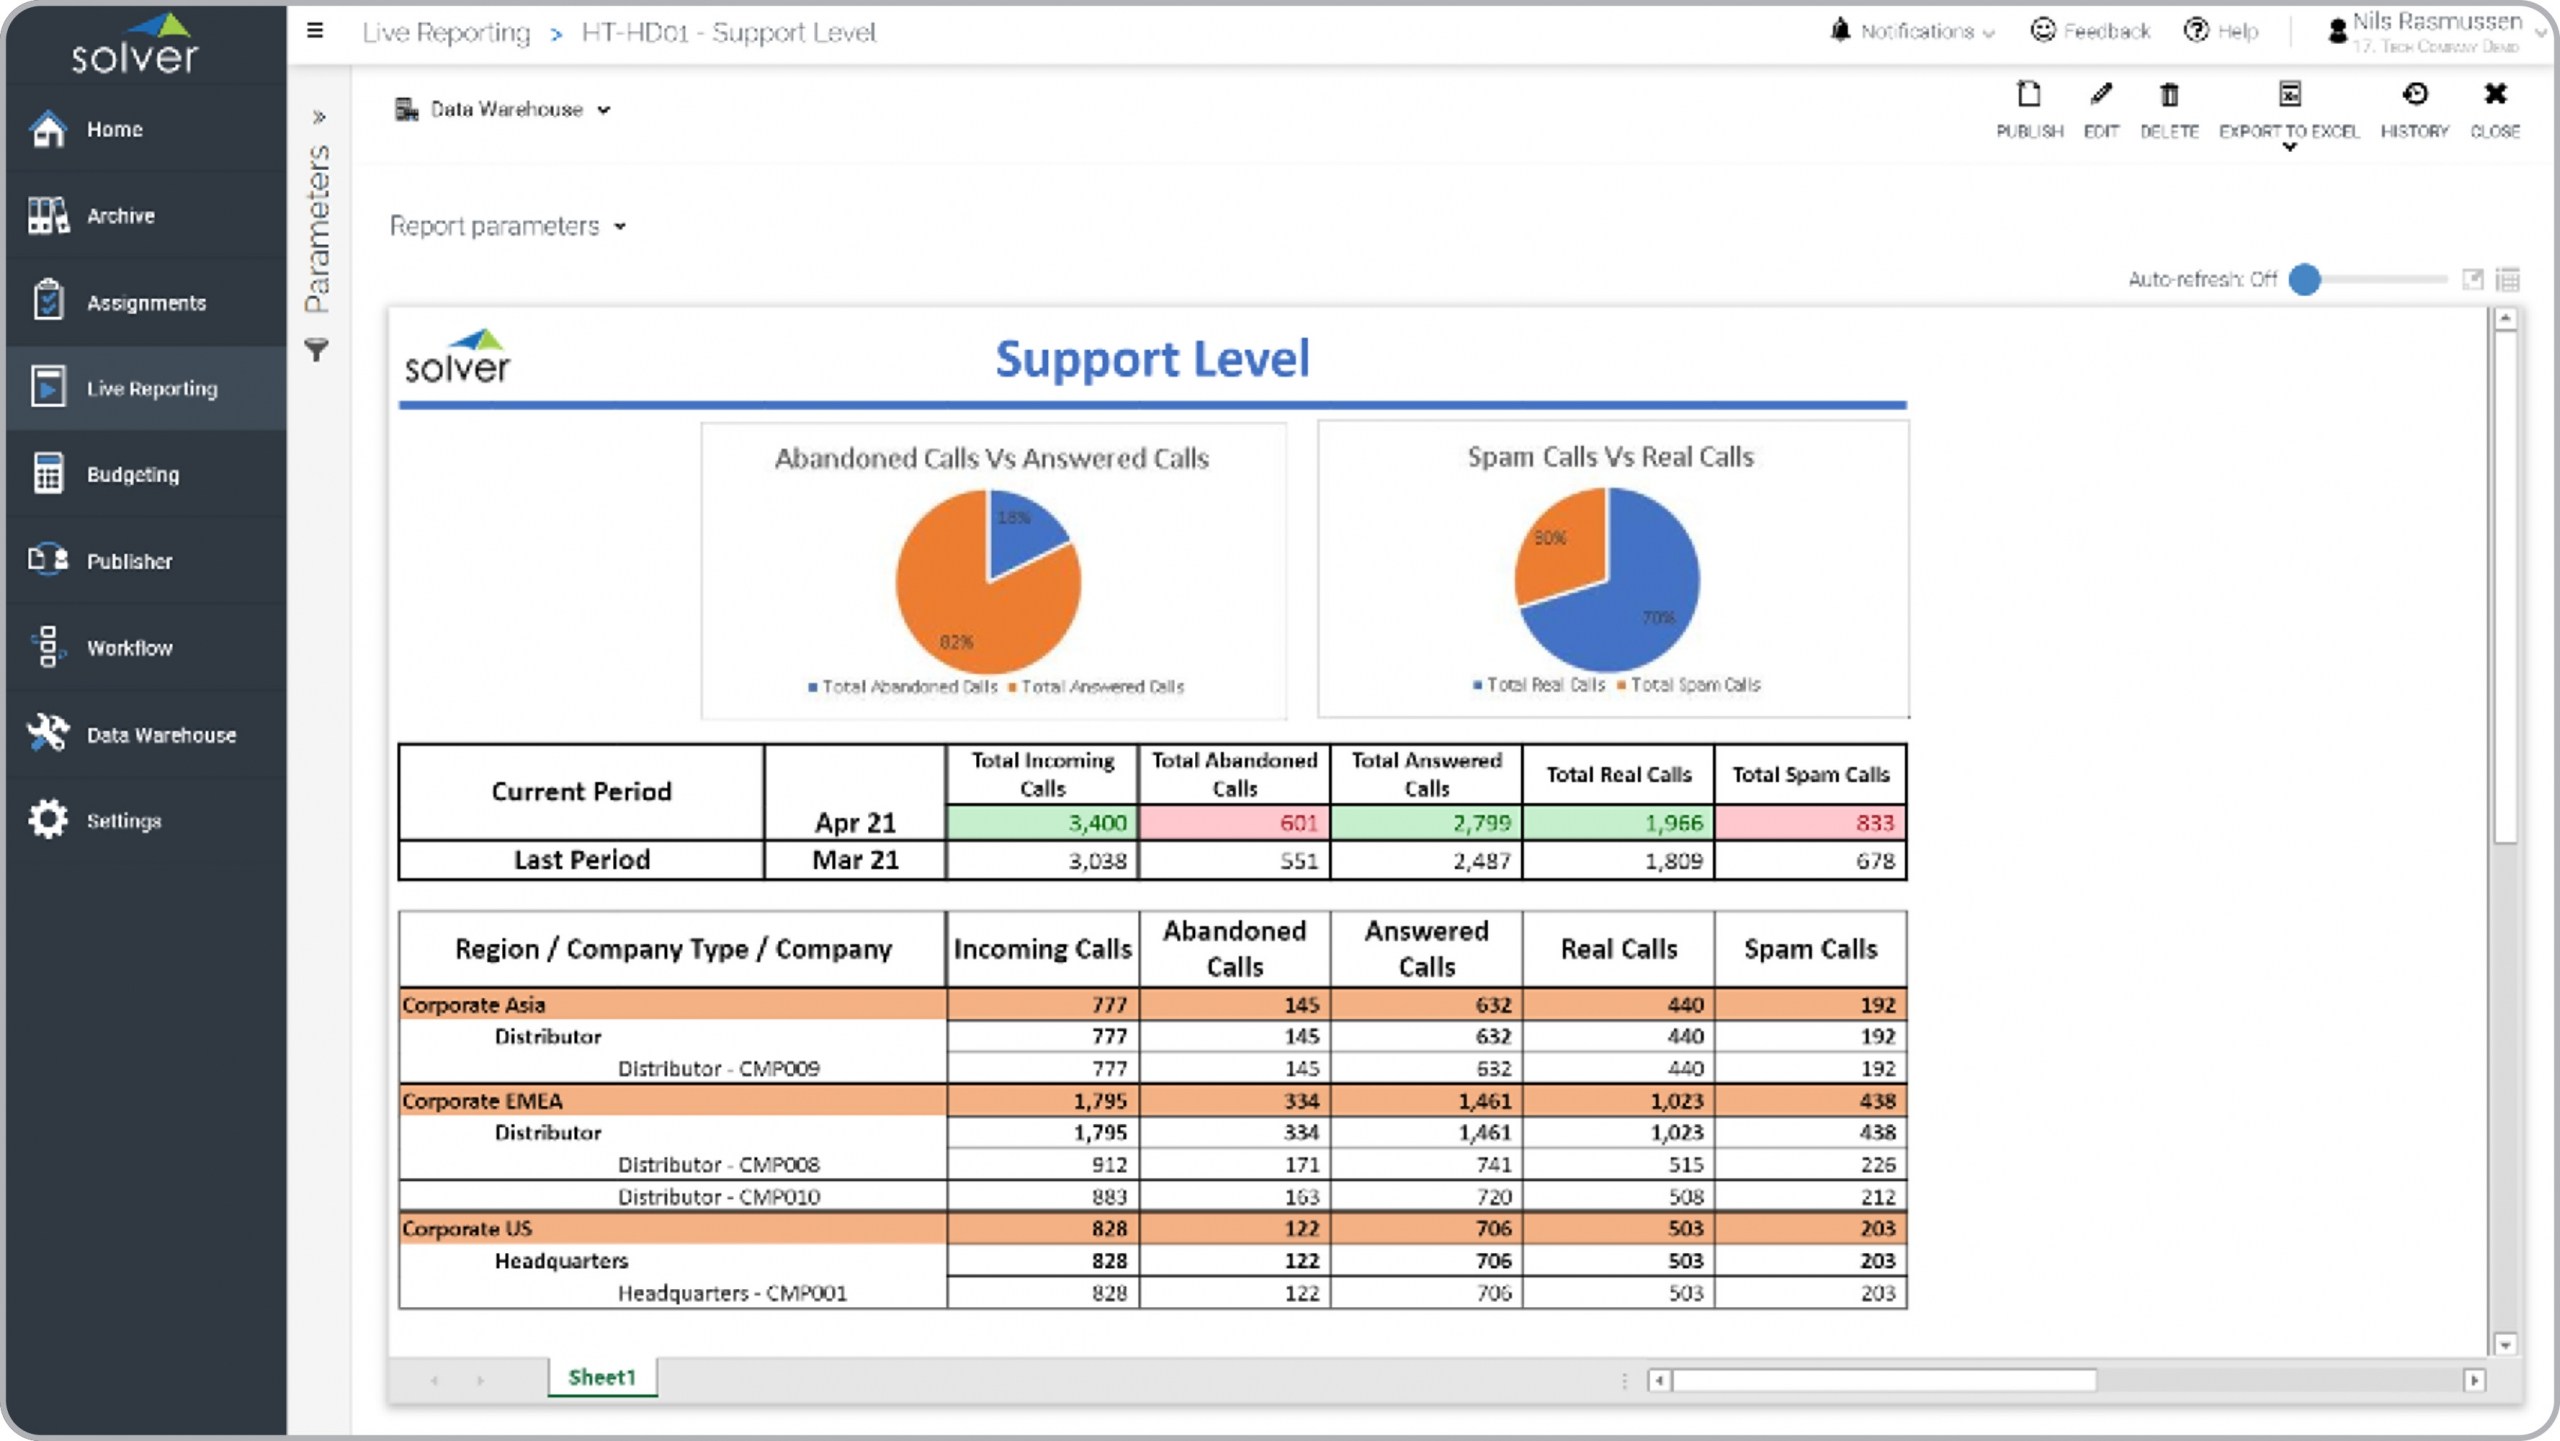
Helpdesk Service Level Report for a Technology Company
What is a Helpdesk Service Level Report ? Service level reports are considered operational analysis ...
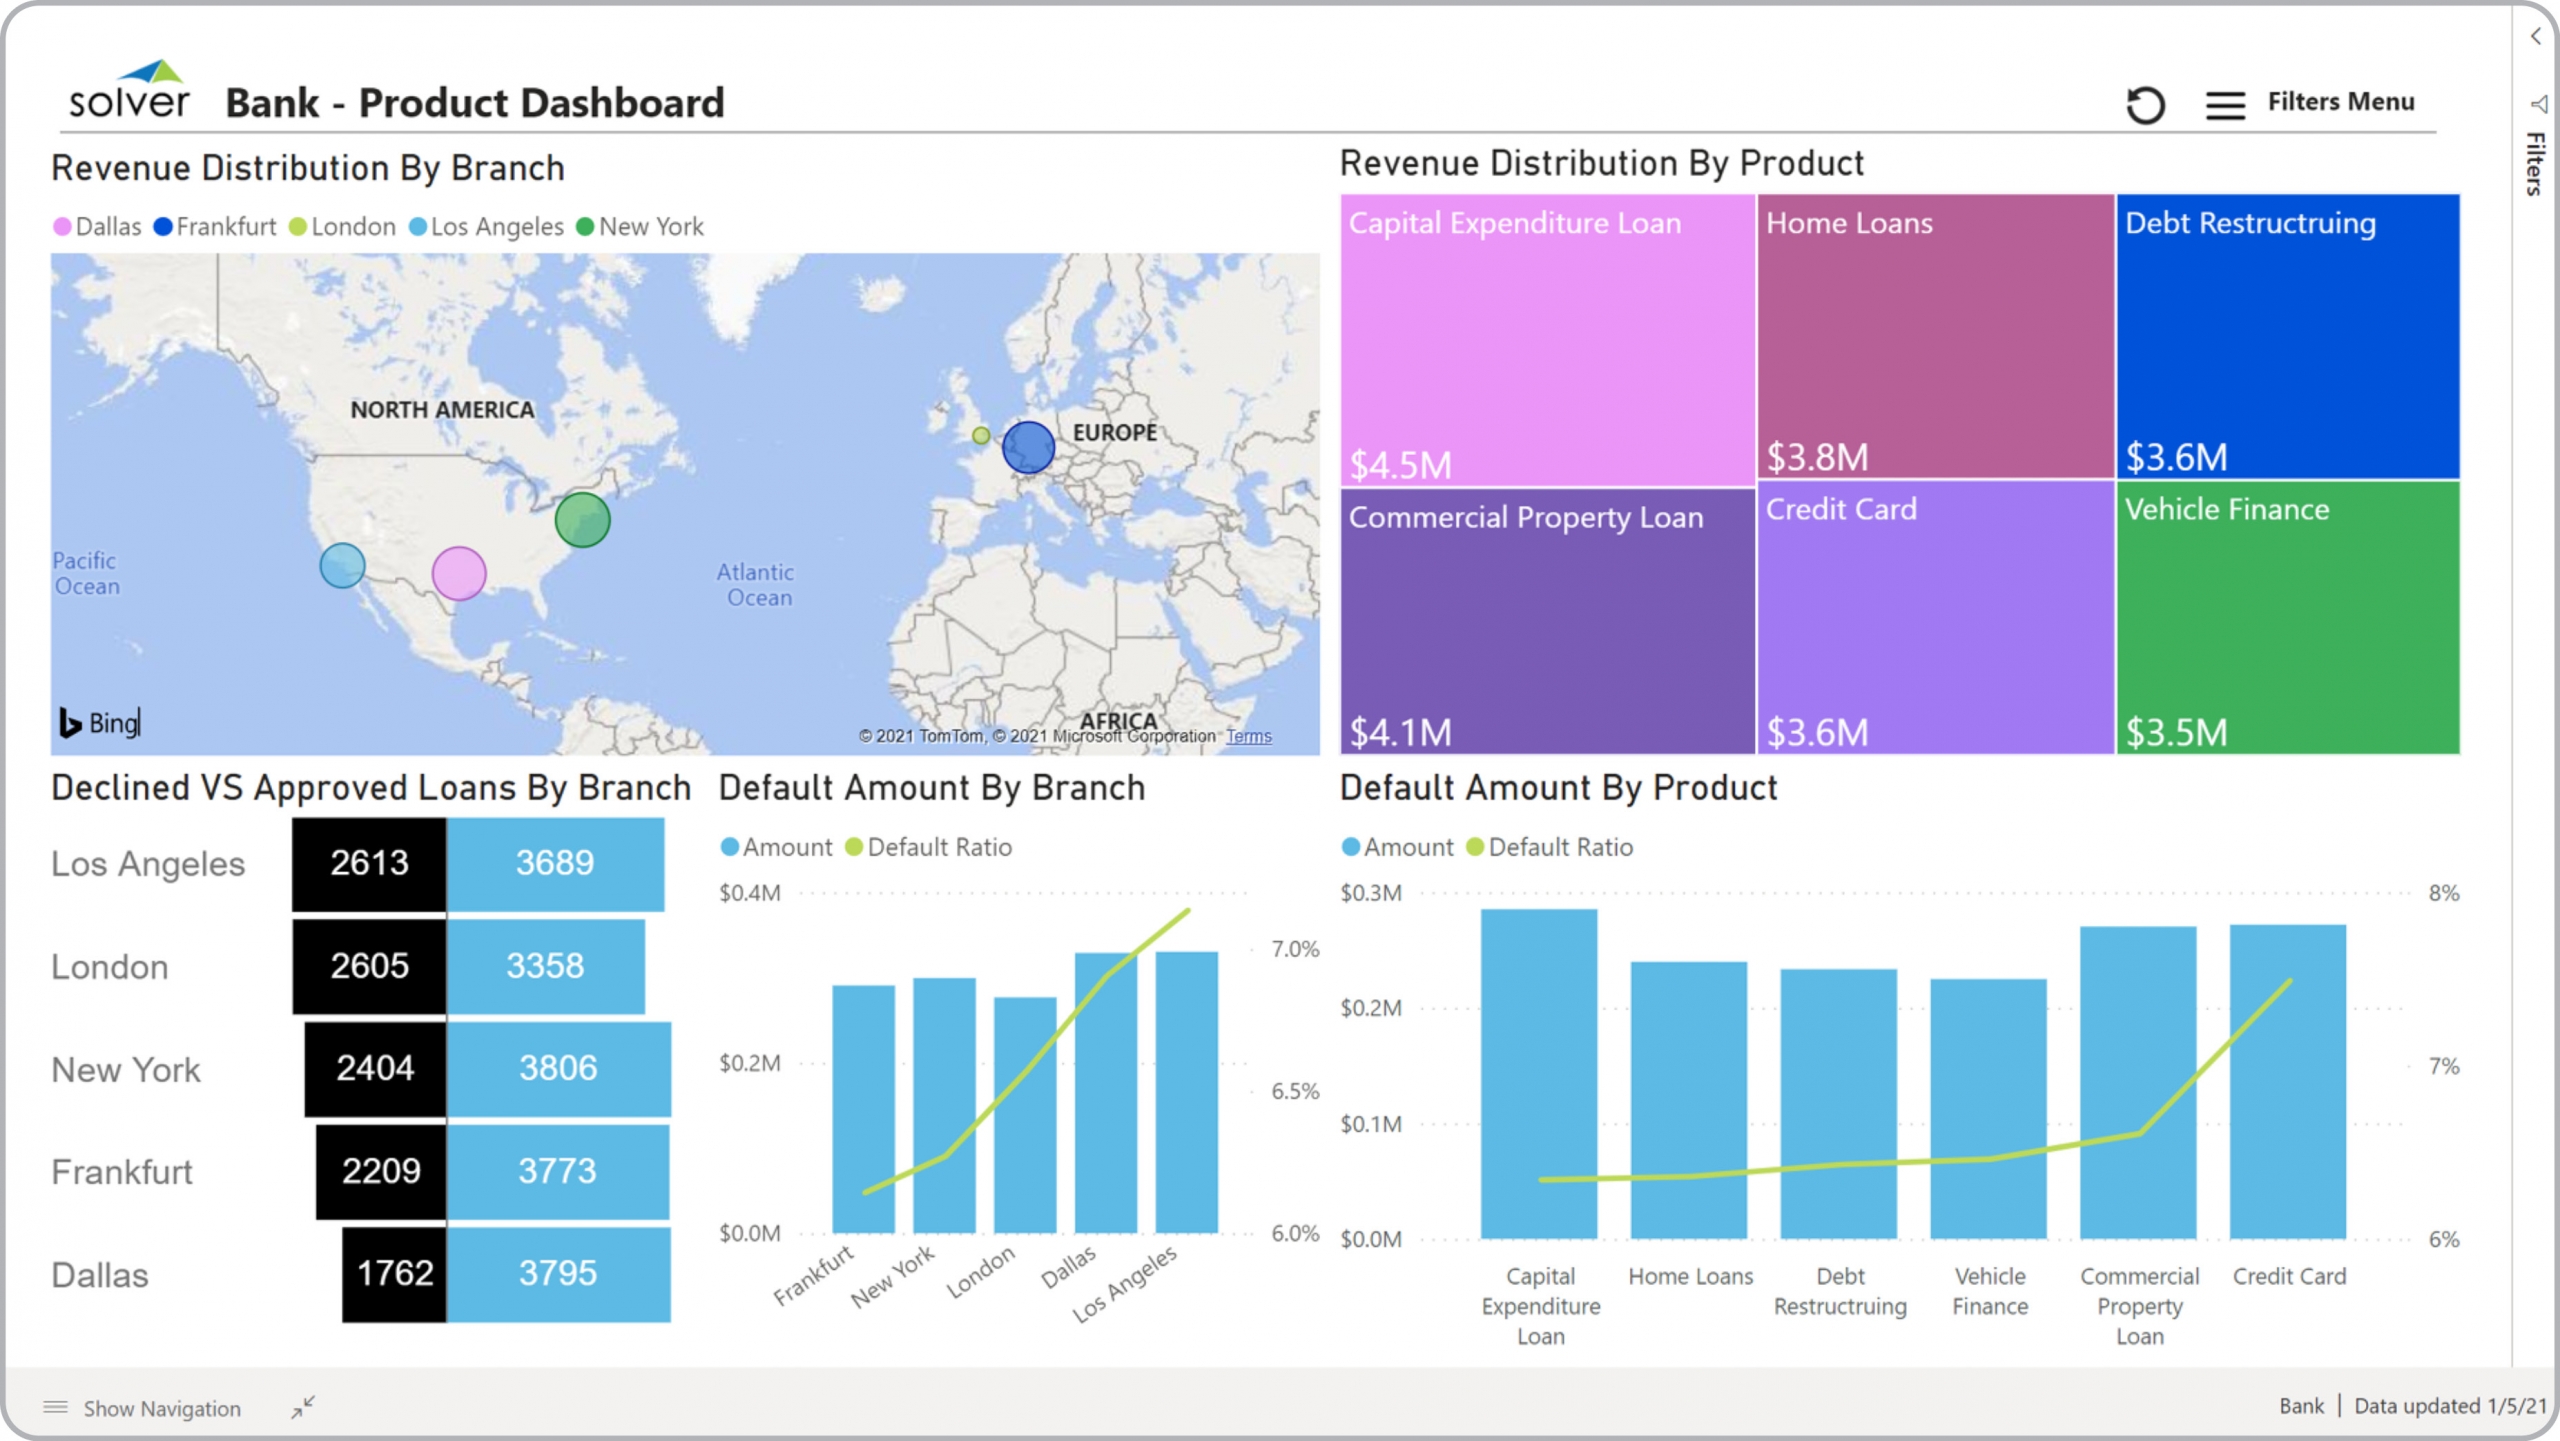
Product Dashboard for Banks
What is a Product Dashboard for Banks ? Product Dashboards are considered operational analysis ...
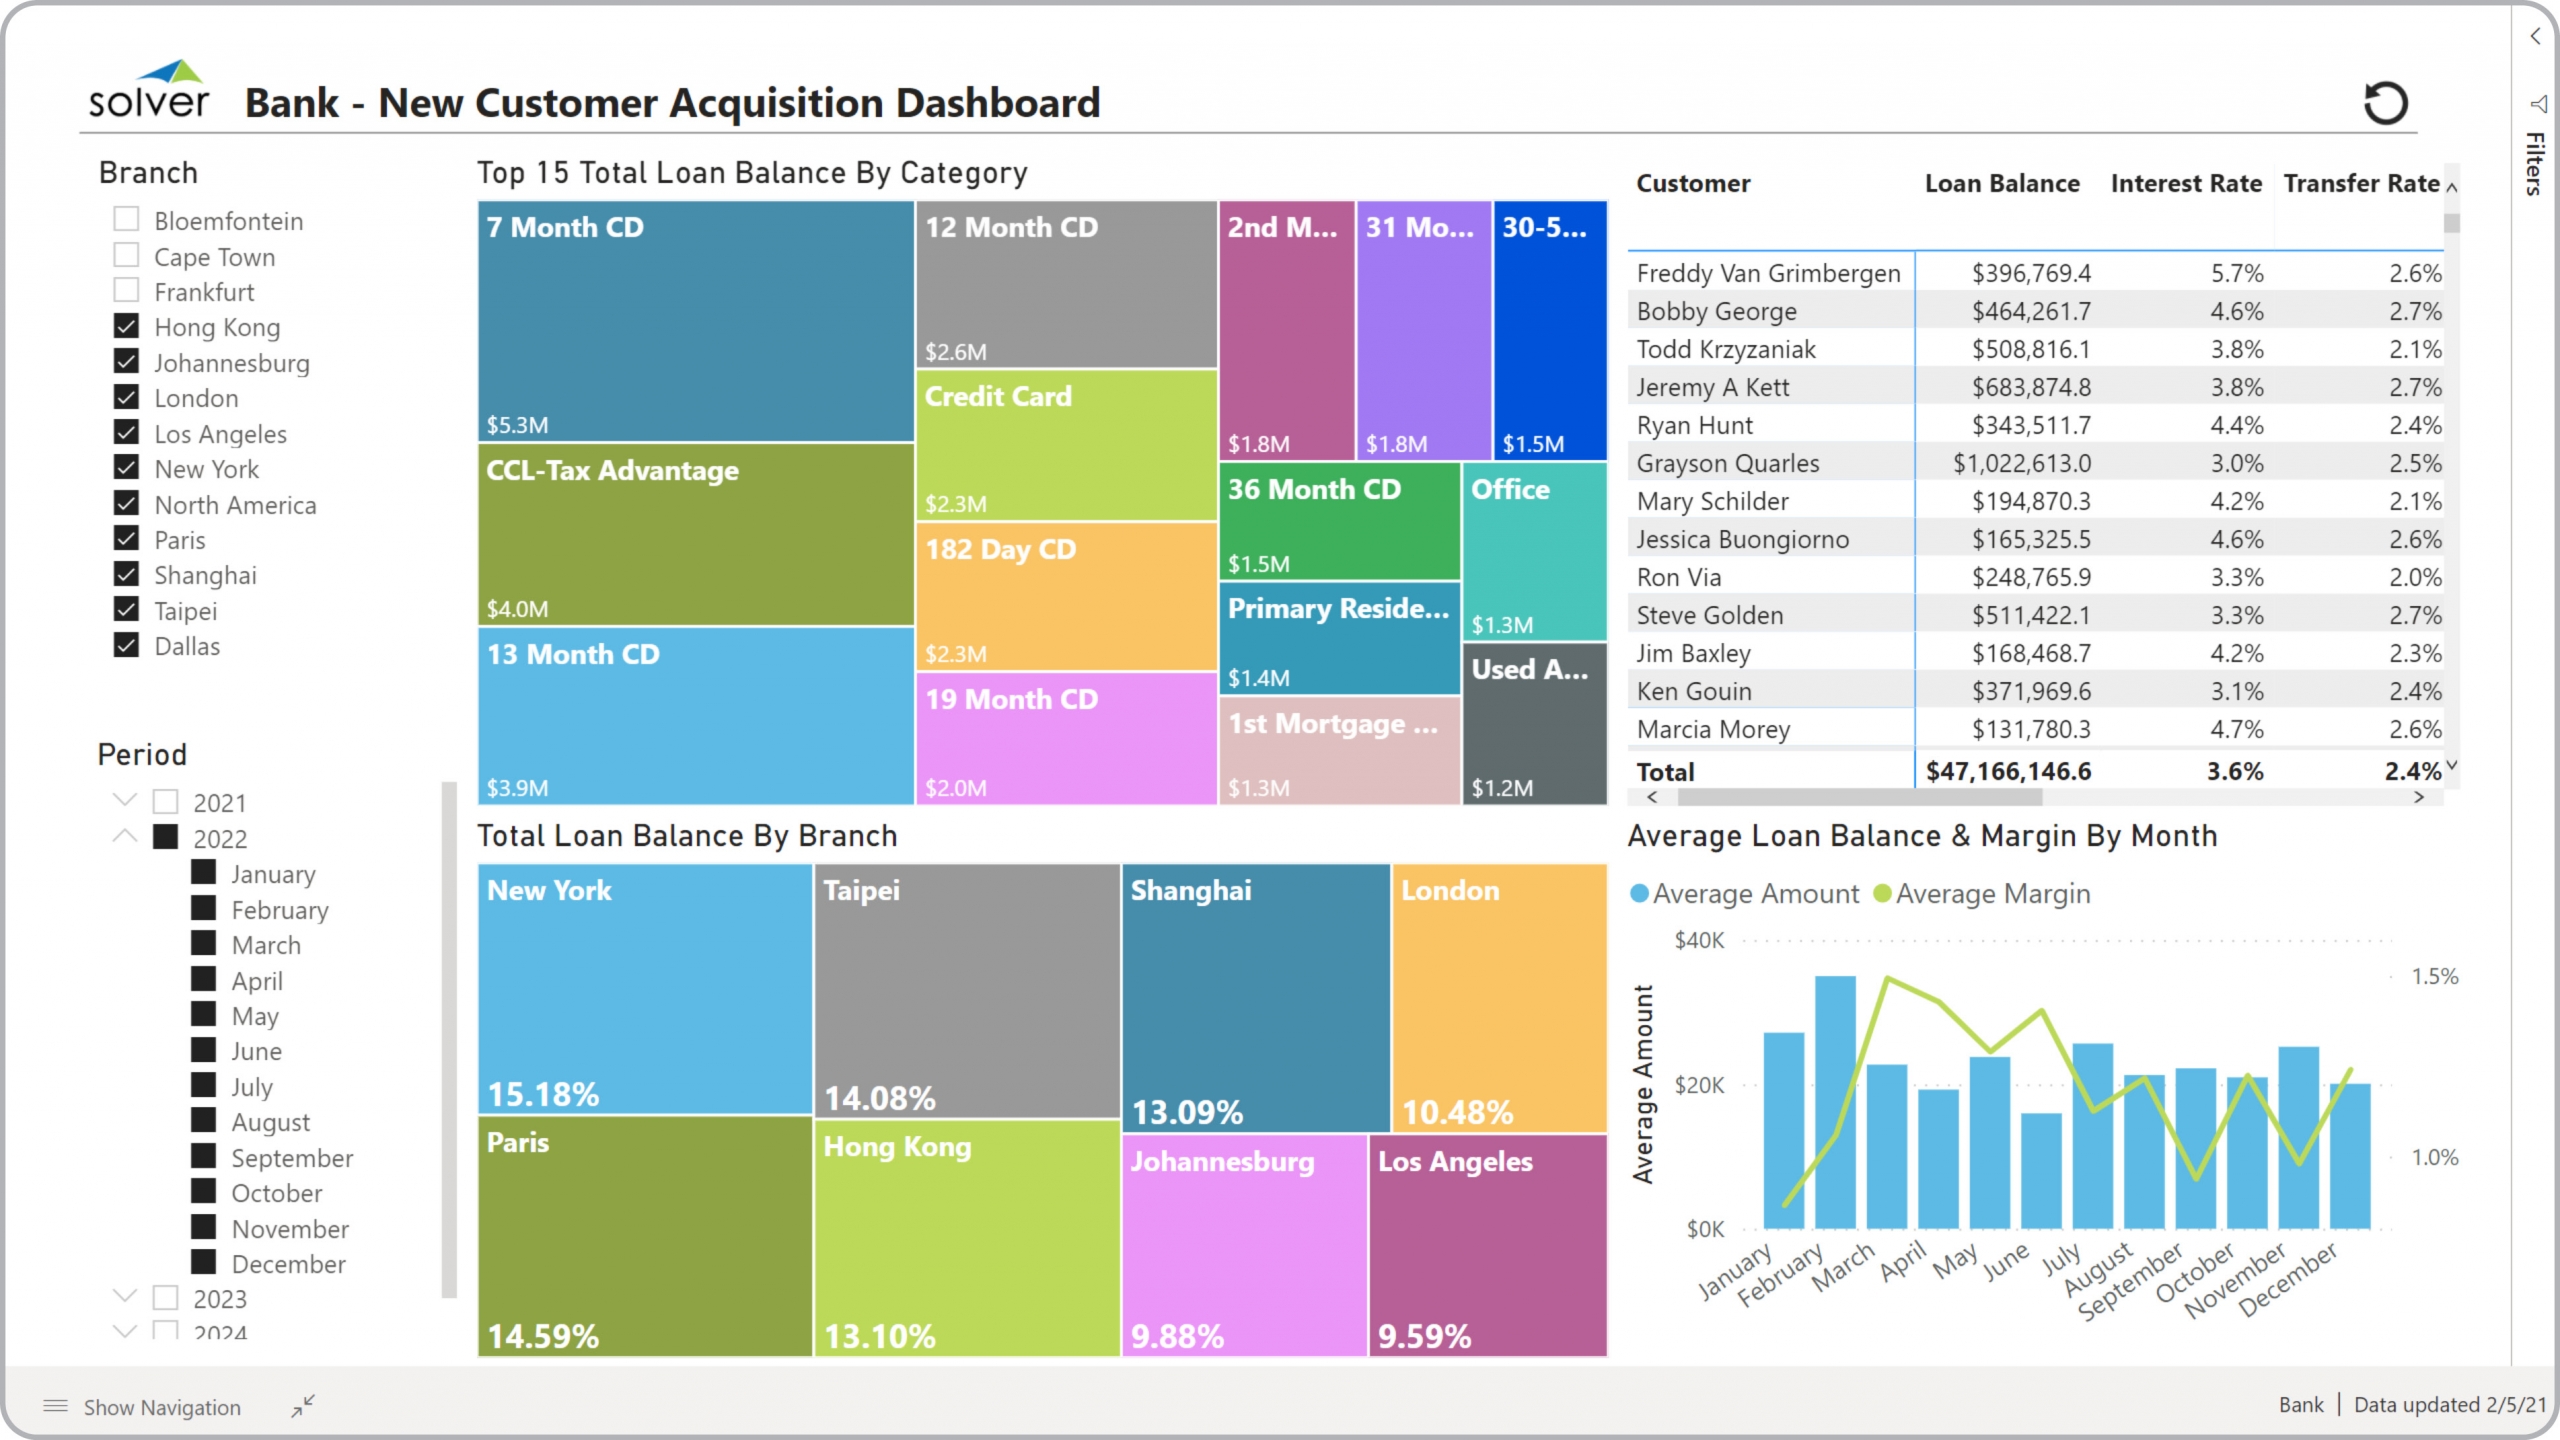
Customer Acquisition Dashboard for Banks
What is a Customer Acquisition Dashboard ? Customer Acquisition Dashboards are considered customer ...
Loan Dashboard for Banks
What is a Loan Dashboard for Banks ? Loan Dashboards are considered operational monitoring tools ...
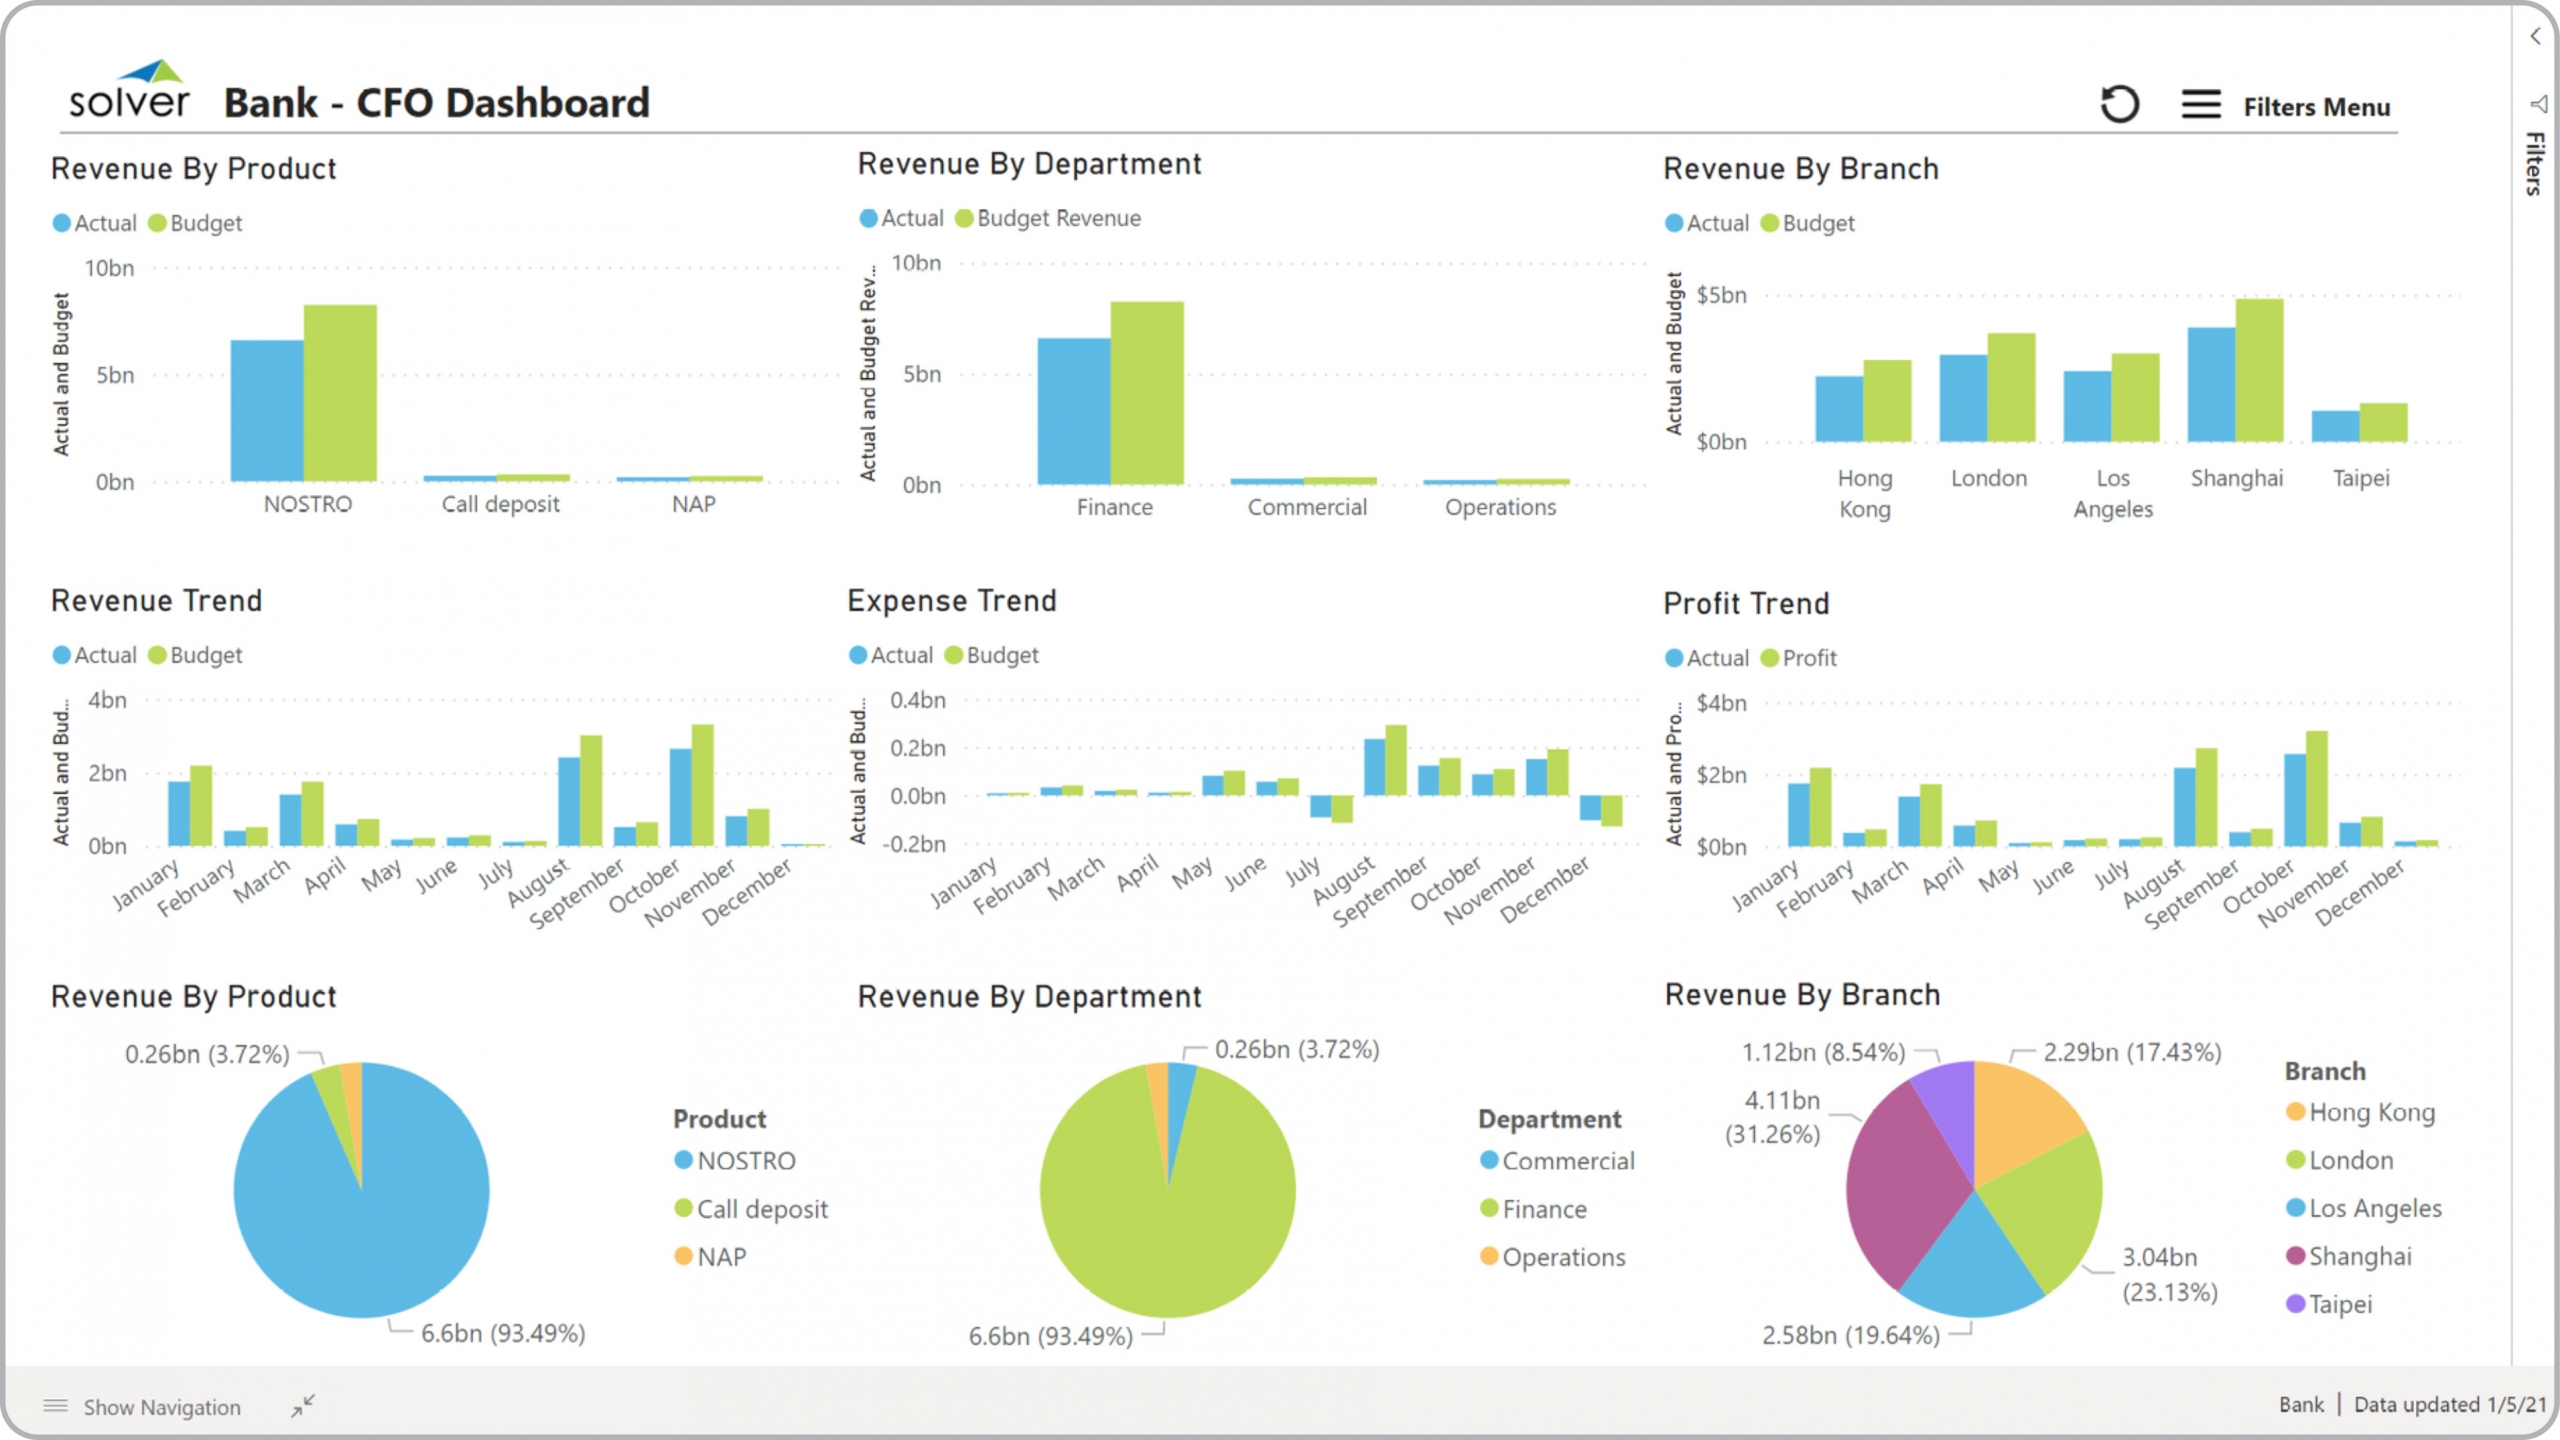
CFO Dashboards for Banks
What is a CFO Dashboard for Banks ? CFO Dashboards are considered financial analysis tools and are ...
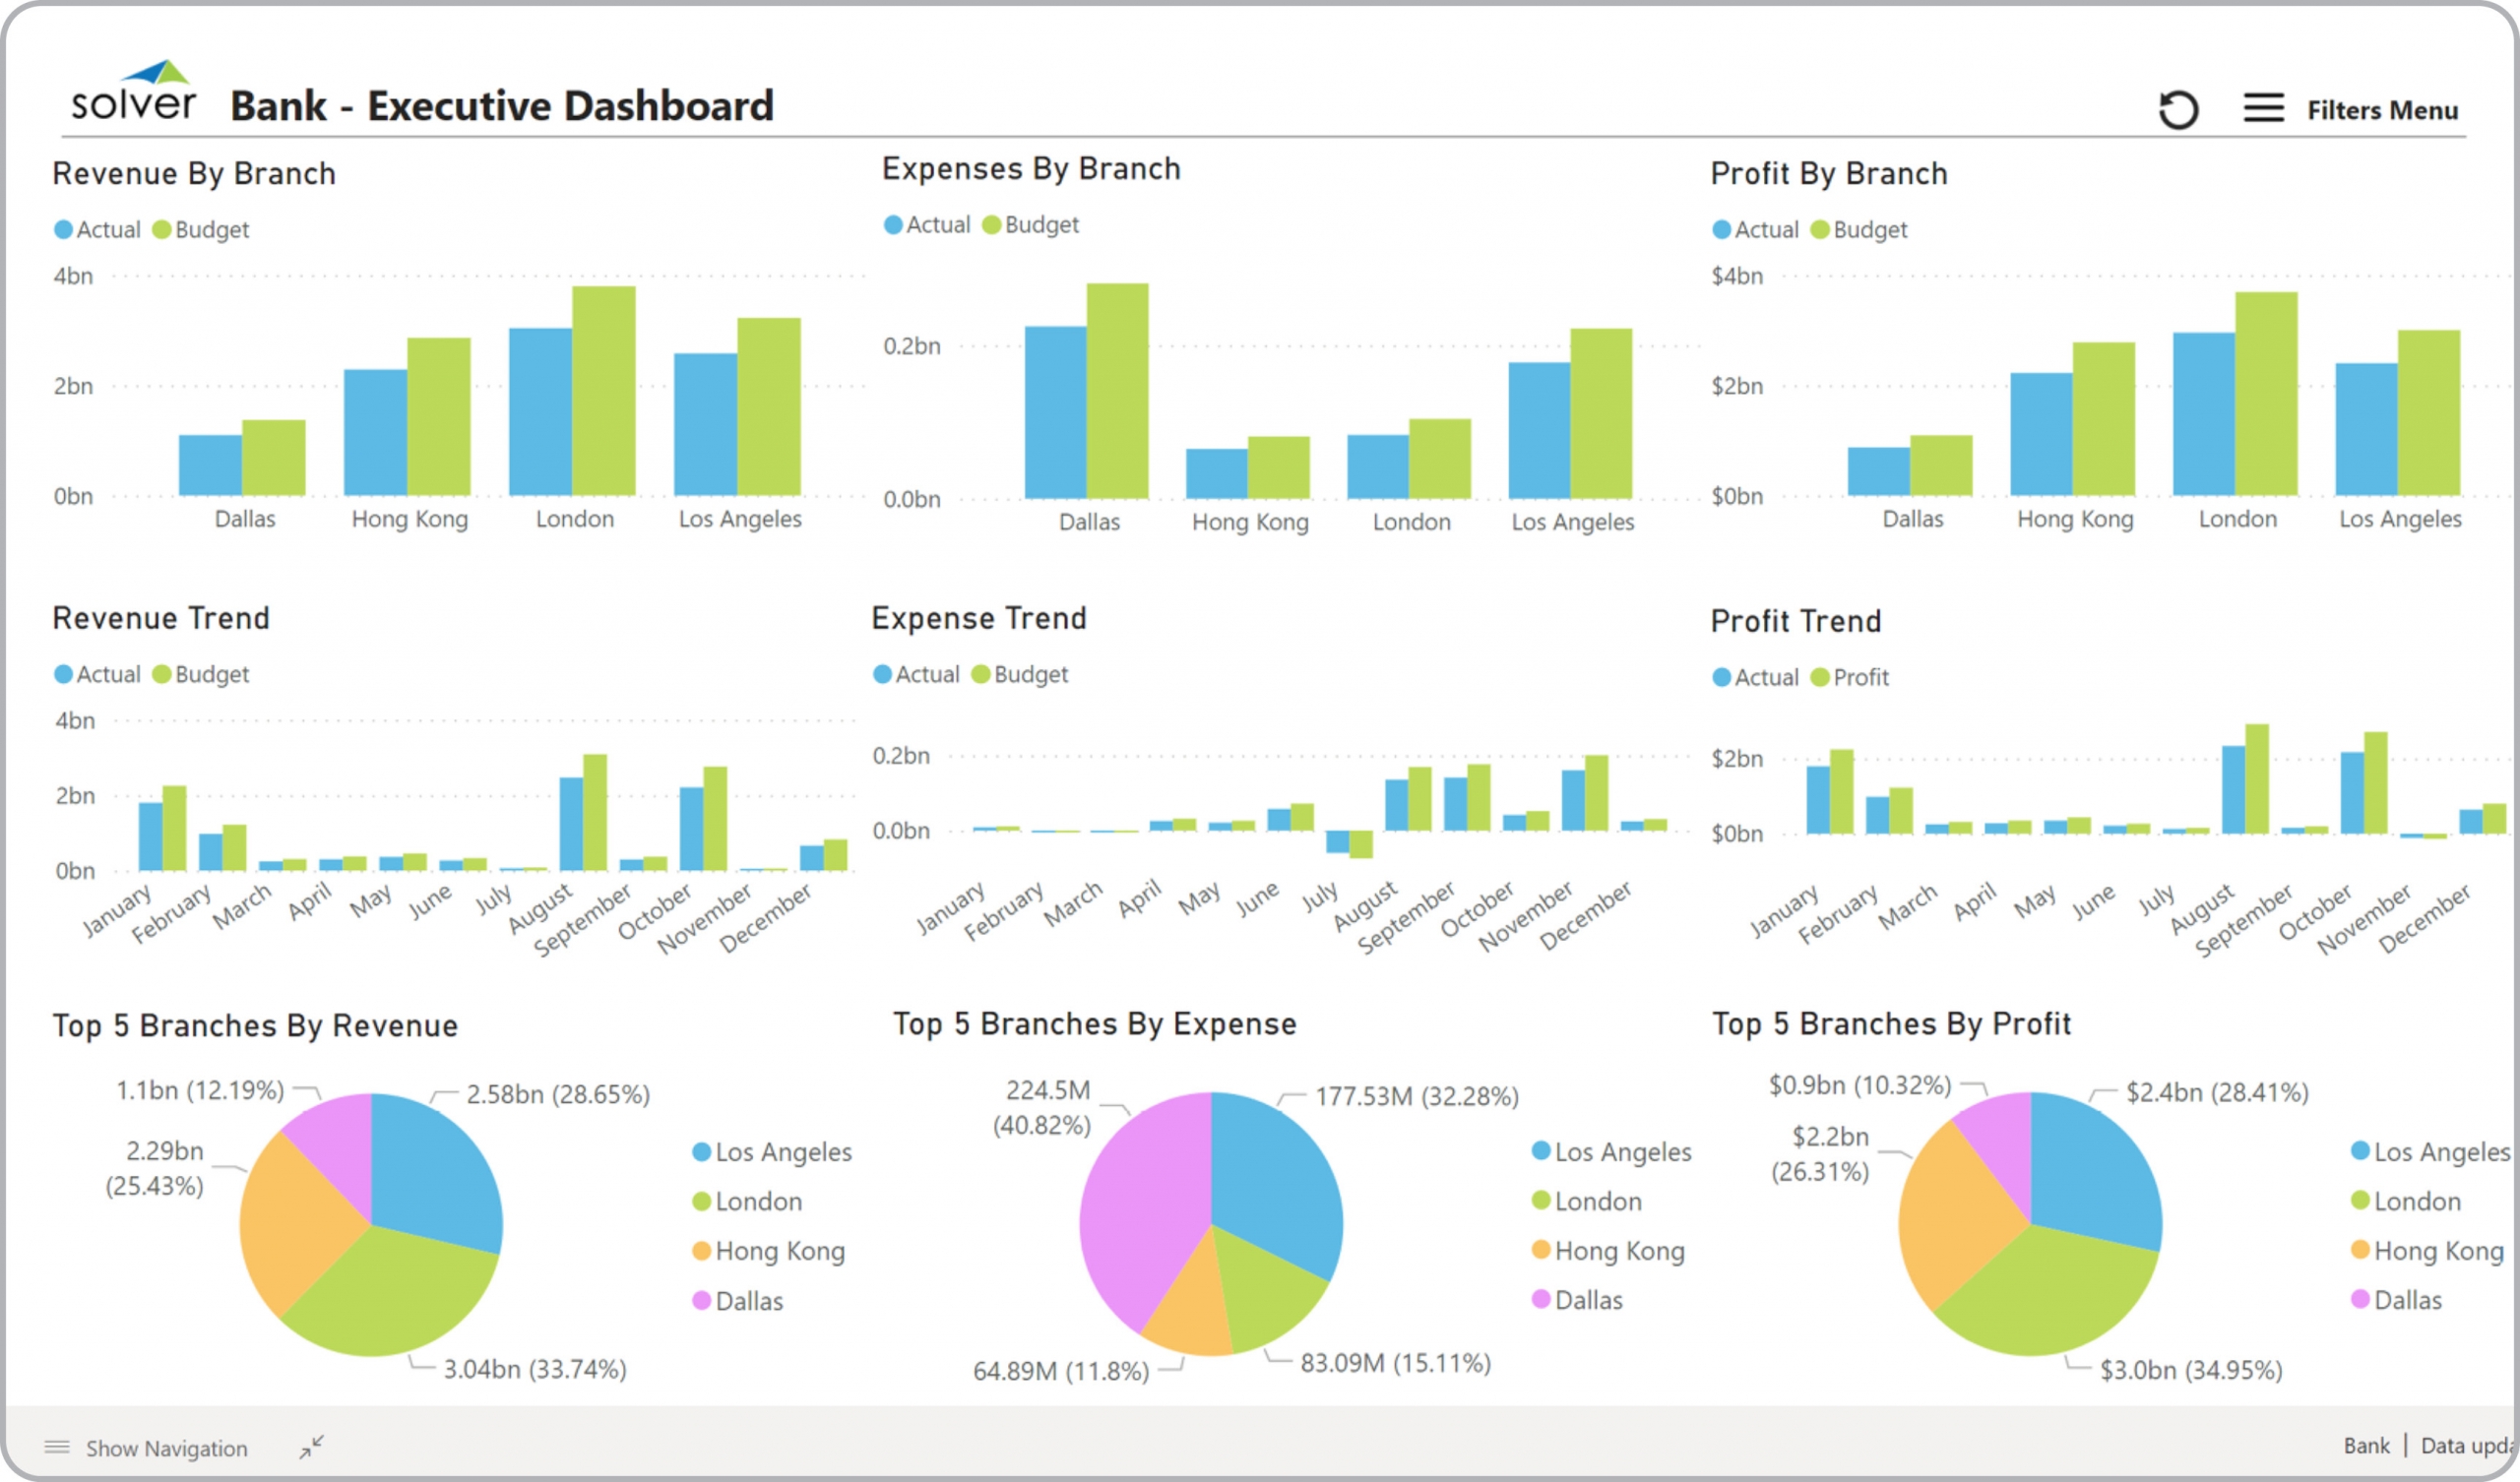
Executive Dashboard for Banks
What is an Executive Dashboard for Banks ? Executive Dashboards are considered interactive ...
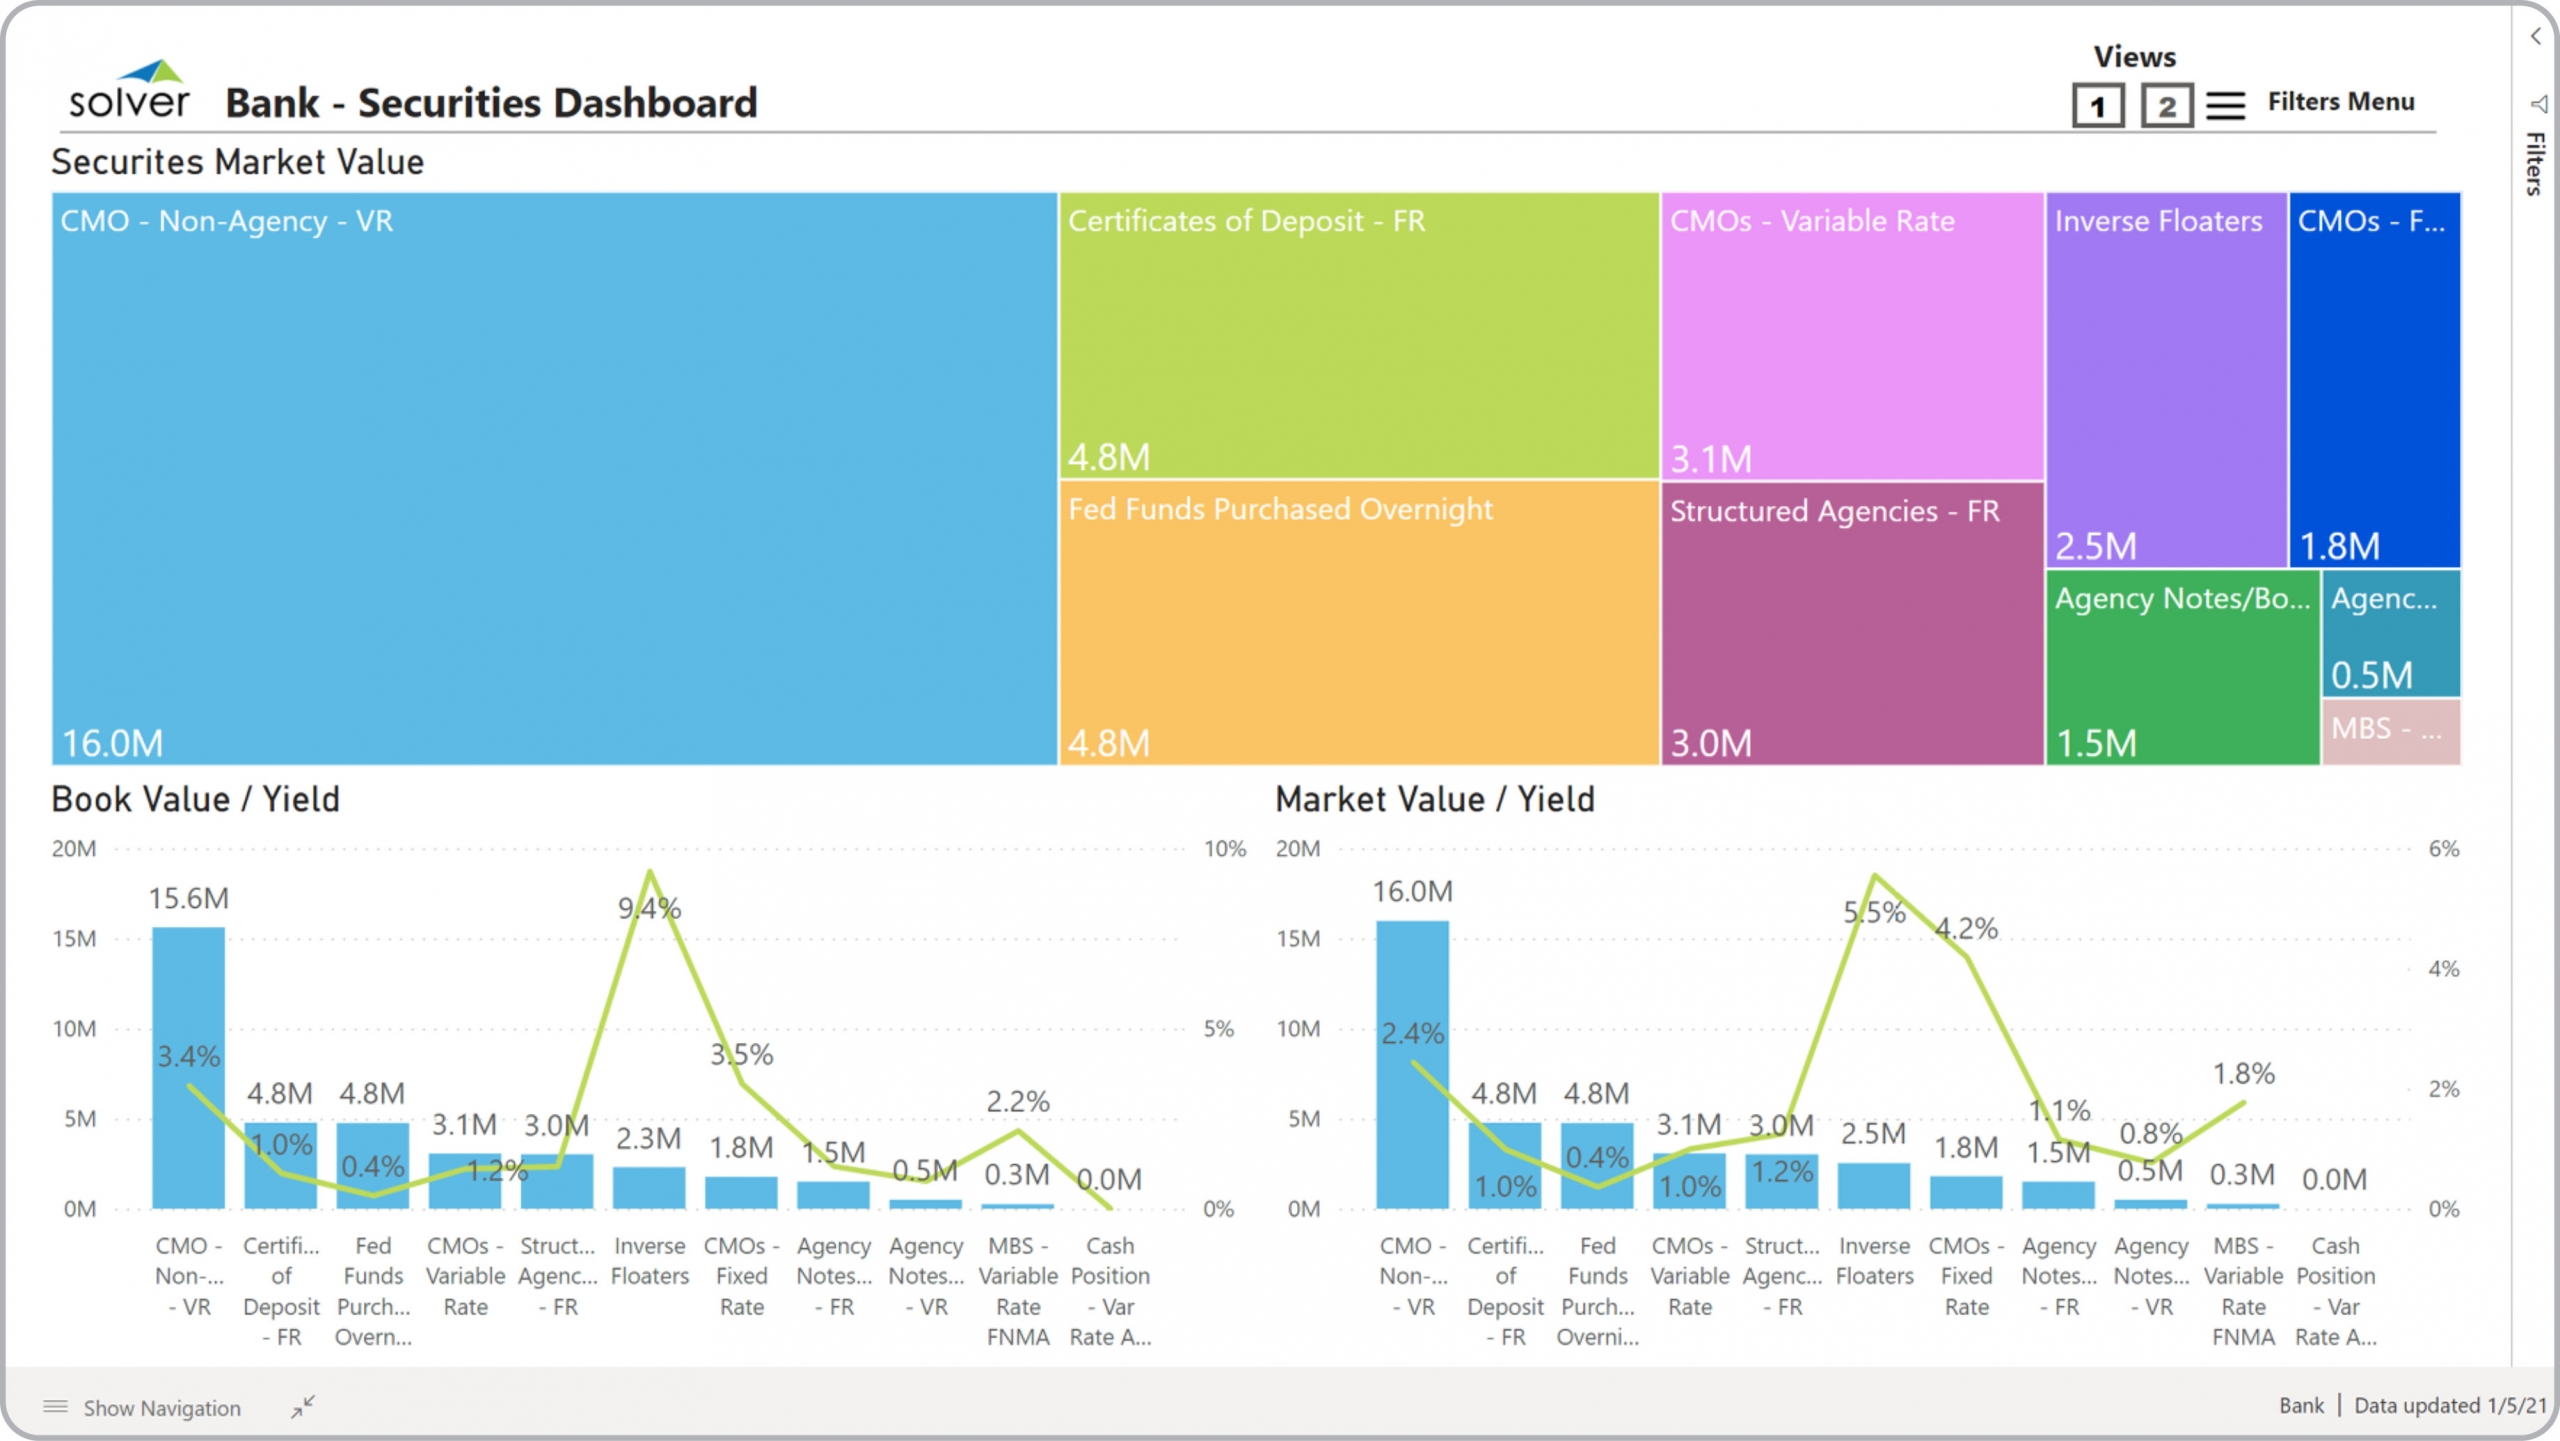
Securities Dashboard for Banks
What is a Securities Dashboard for Banks ? Securities Dashboards are considered financial ...
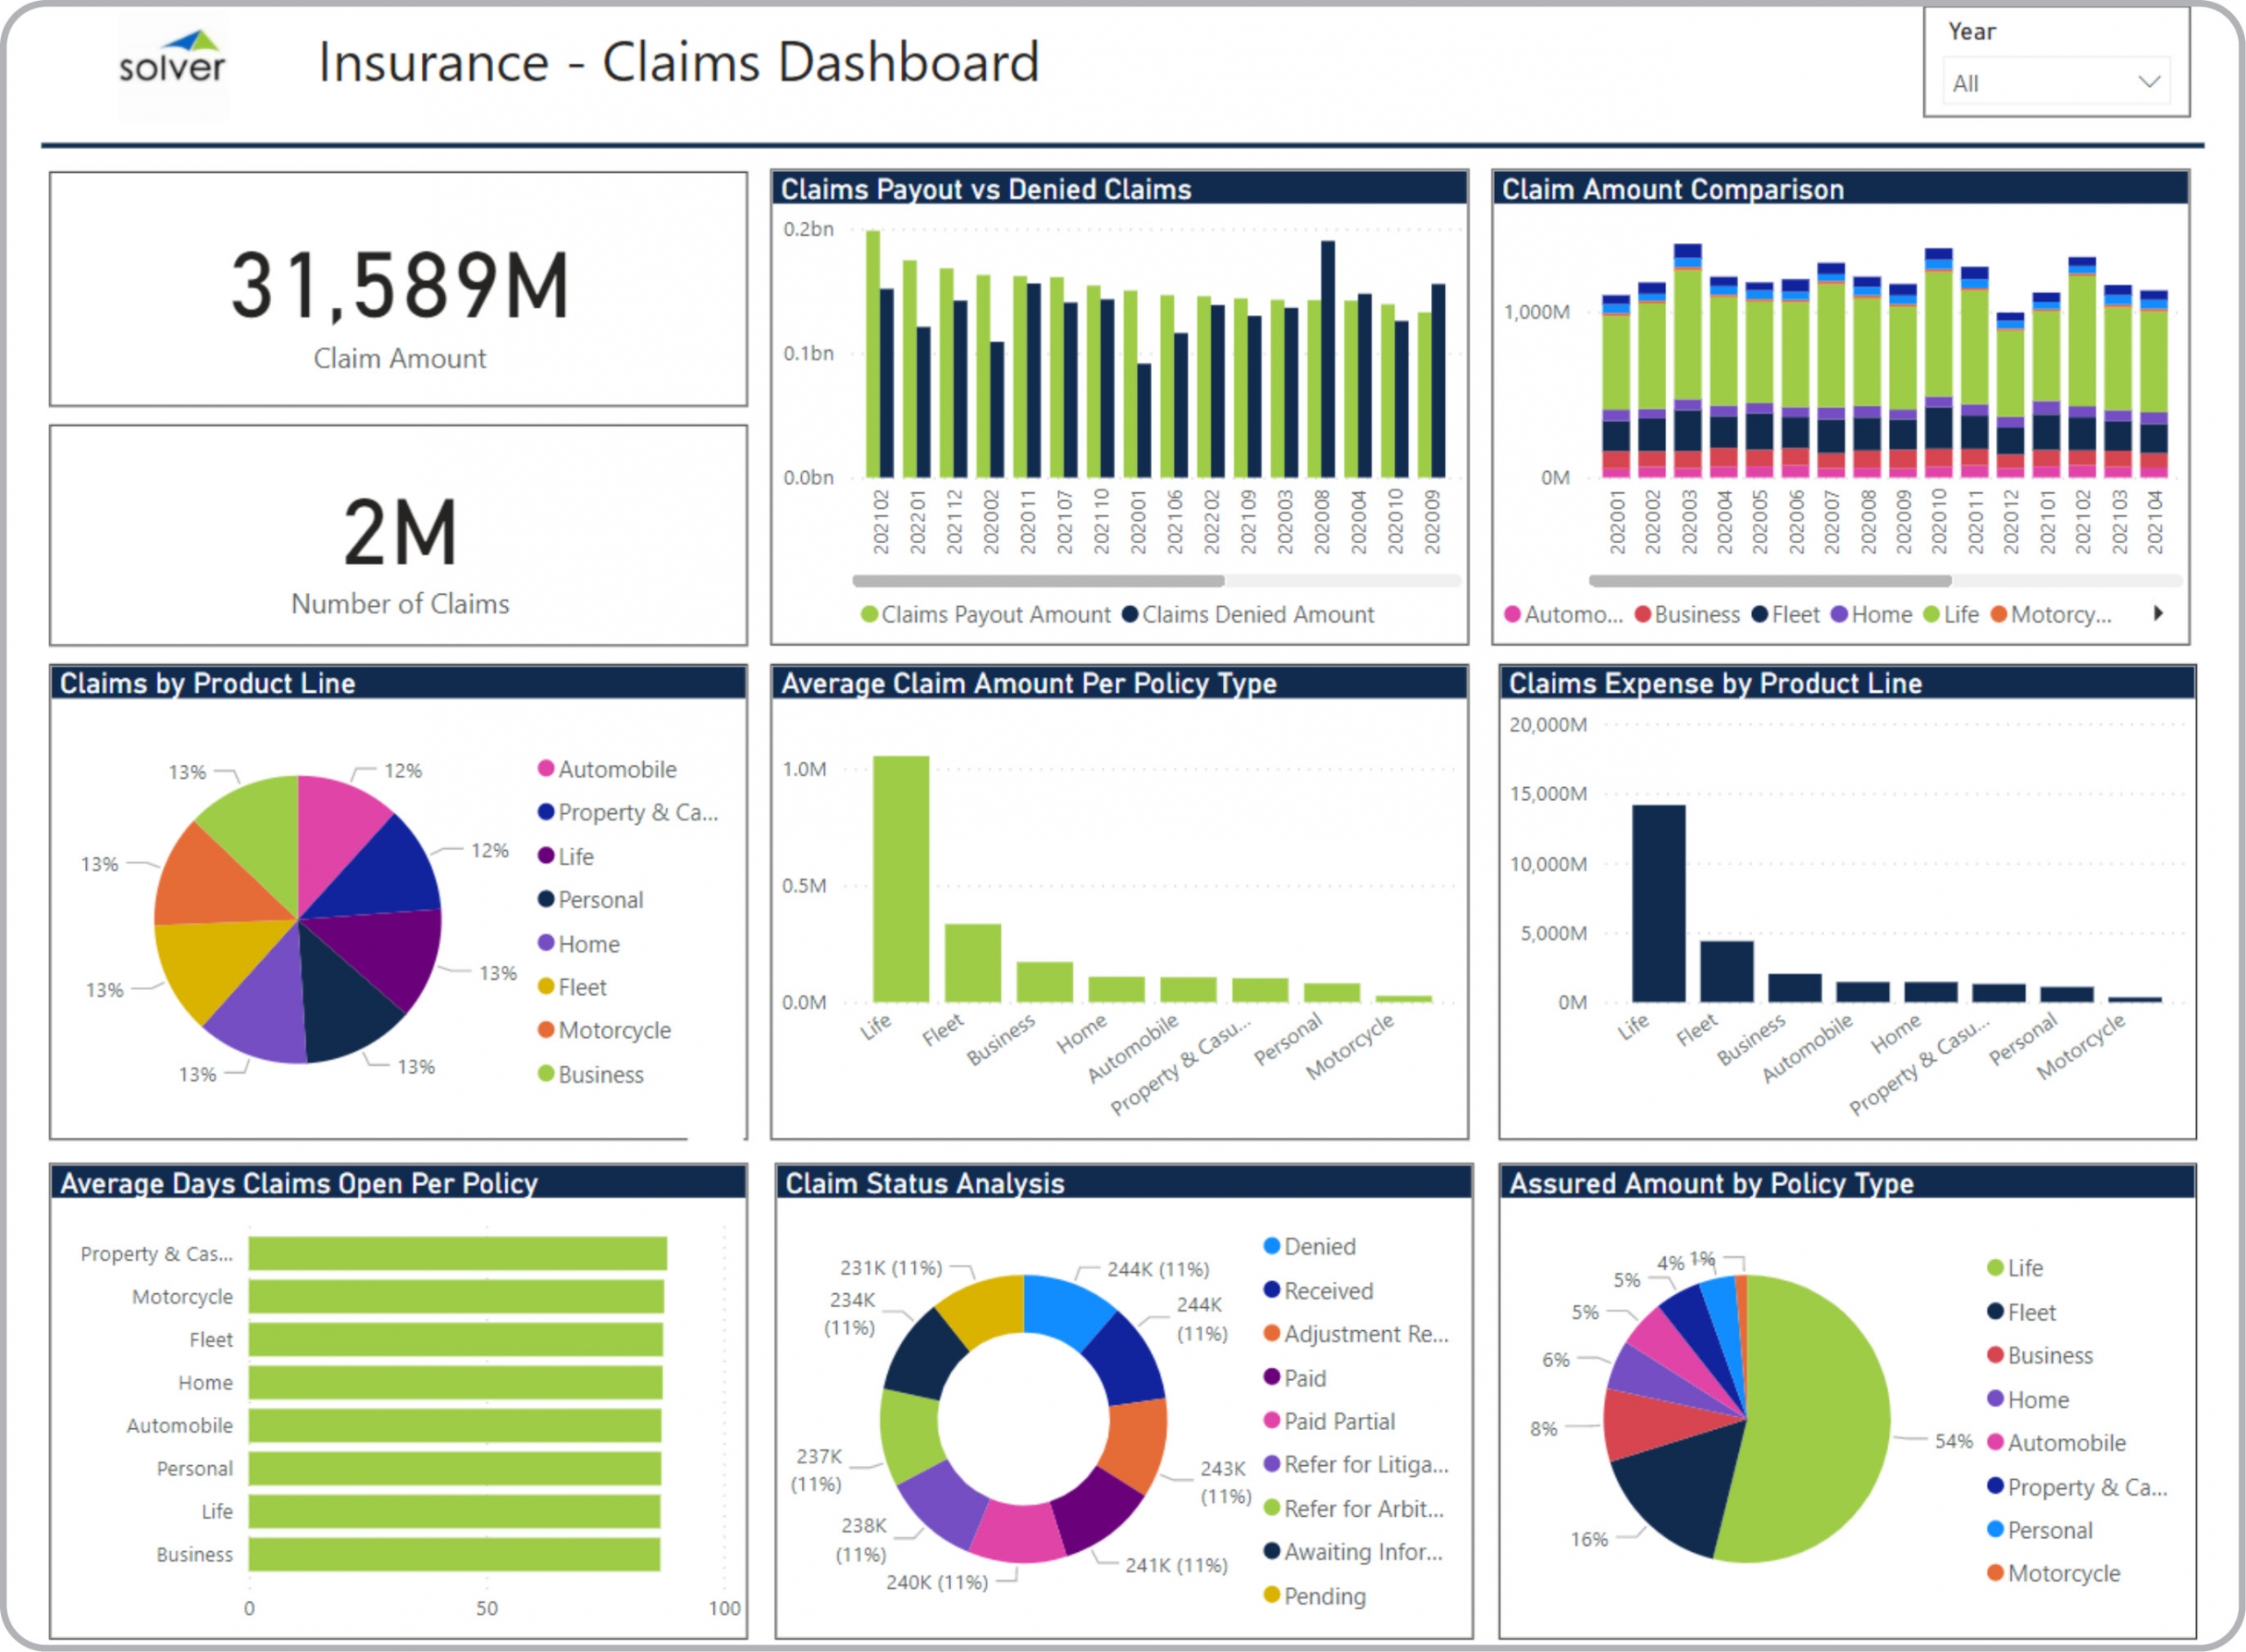
Claims Dashboard for Insurance Companies
What is a Claims Dashboard ? Claims Dashboards are considered operational analysis tools and are ...
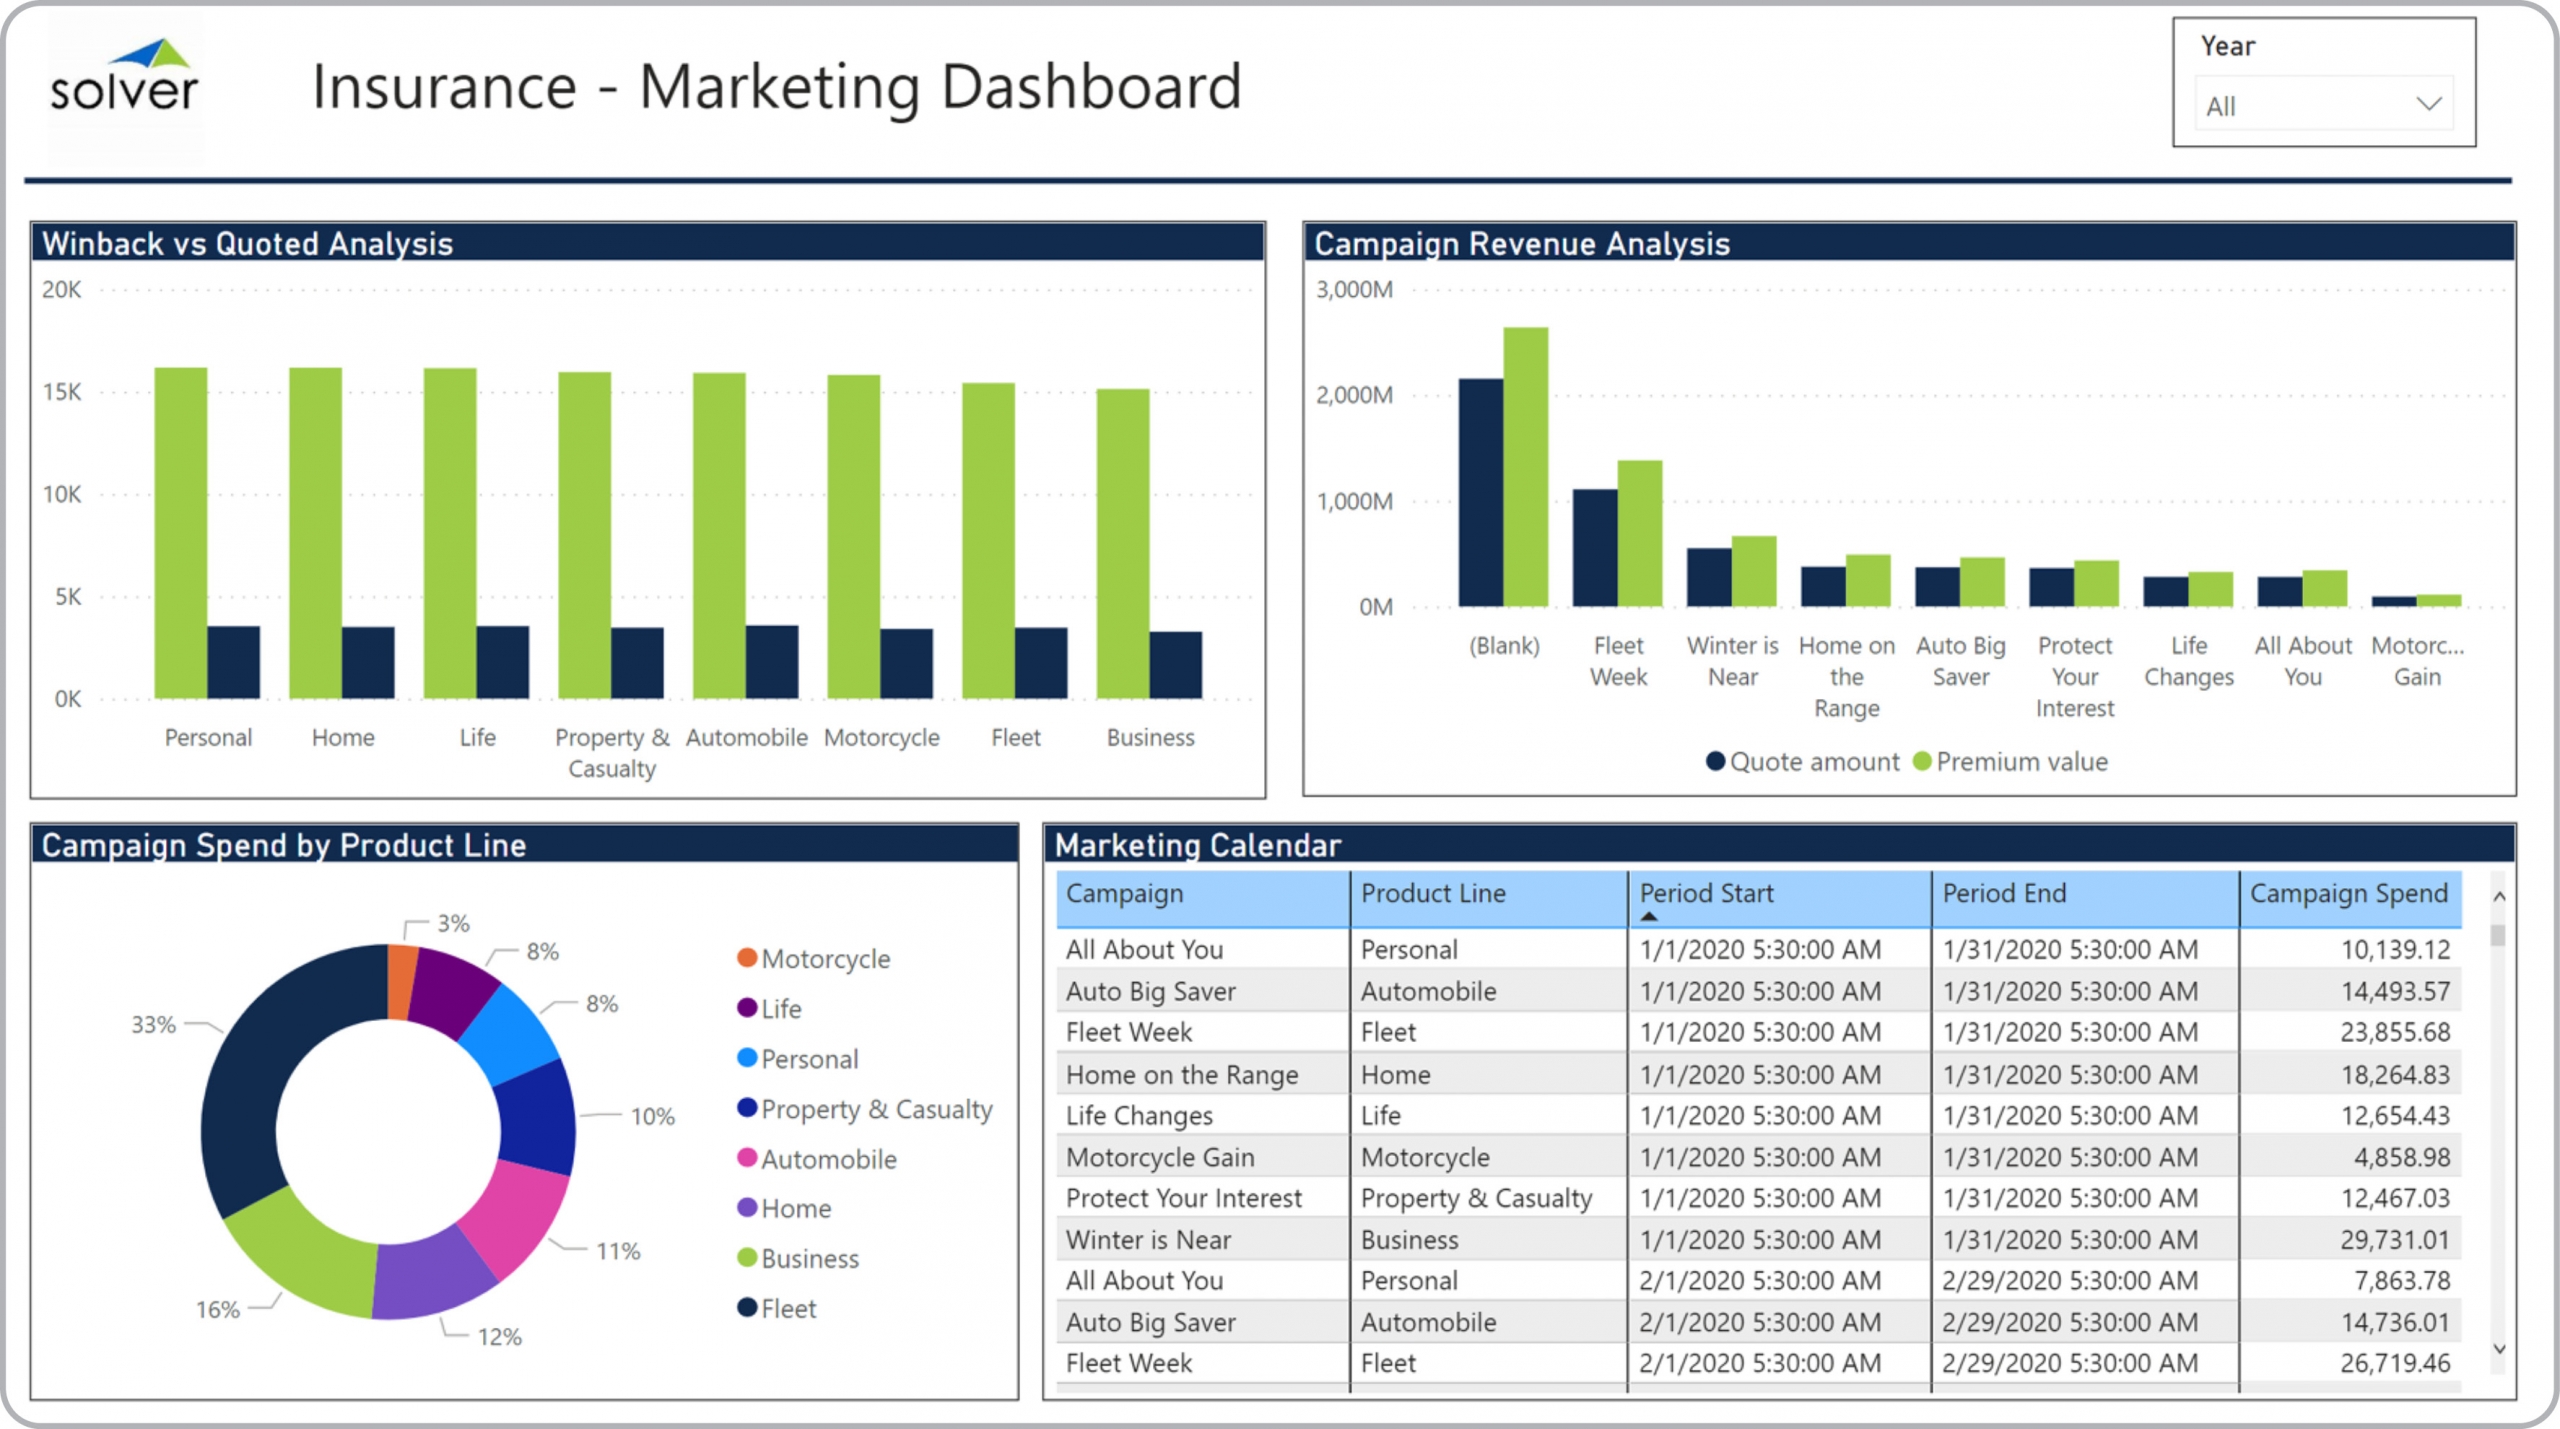
Marketing Dashboard for Insurance Companies
What is a Marketing Dashboard ? Marketing Dashboards are considered operational analysis tools and ...
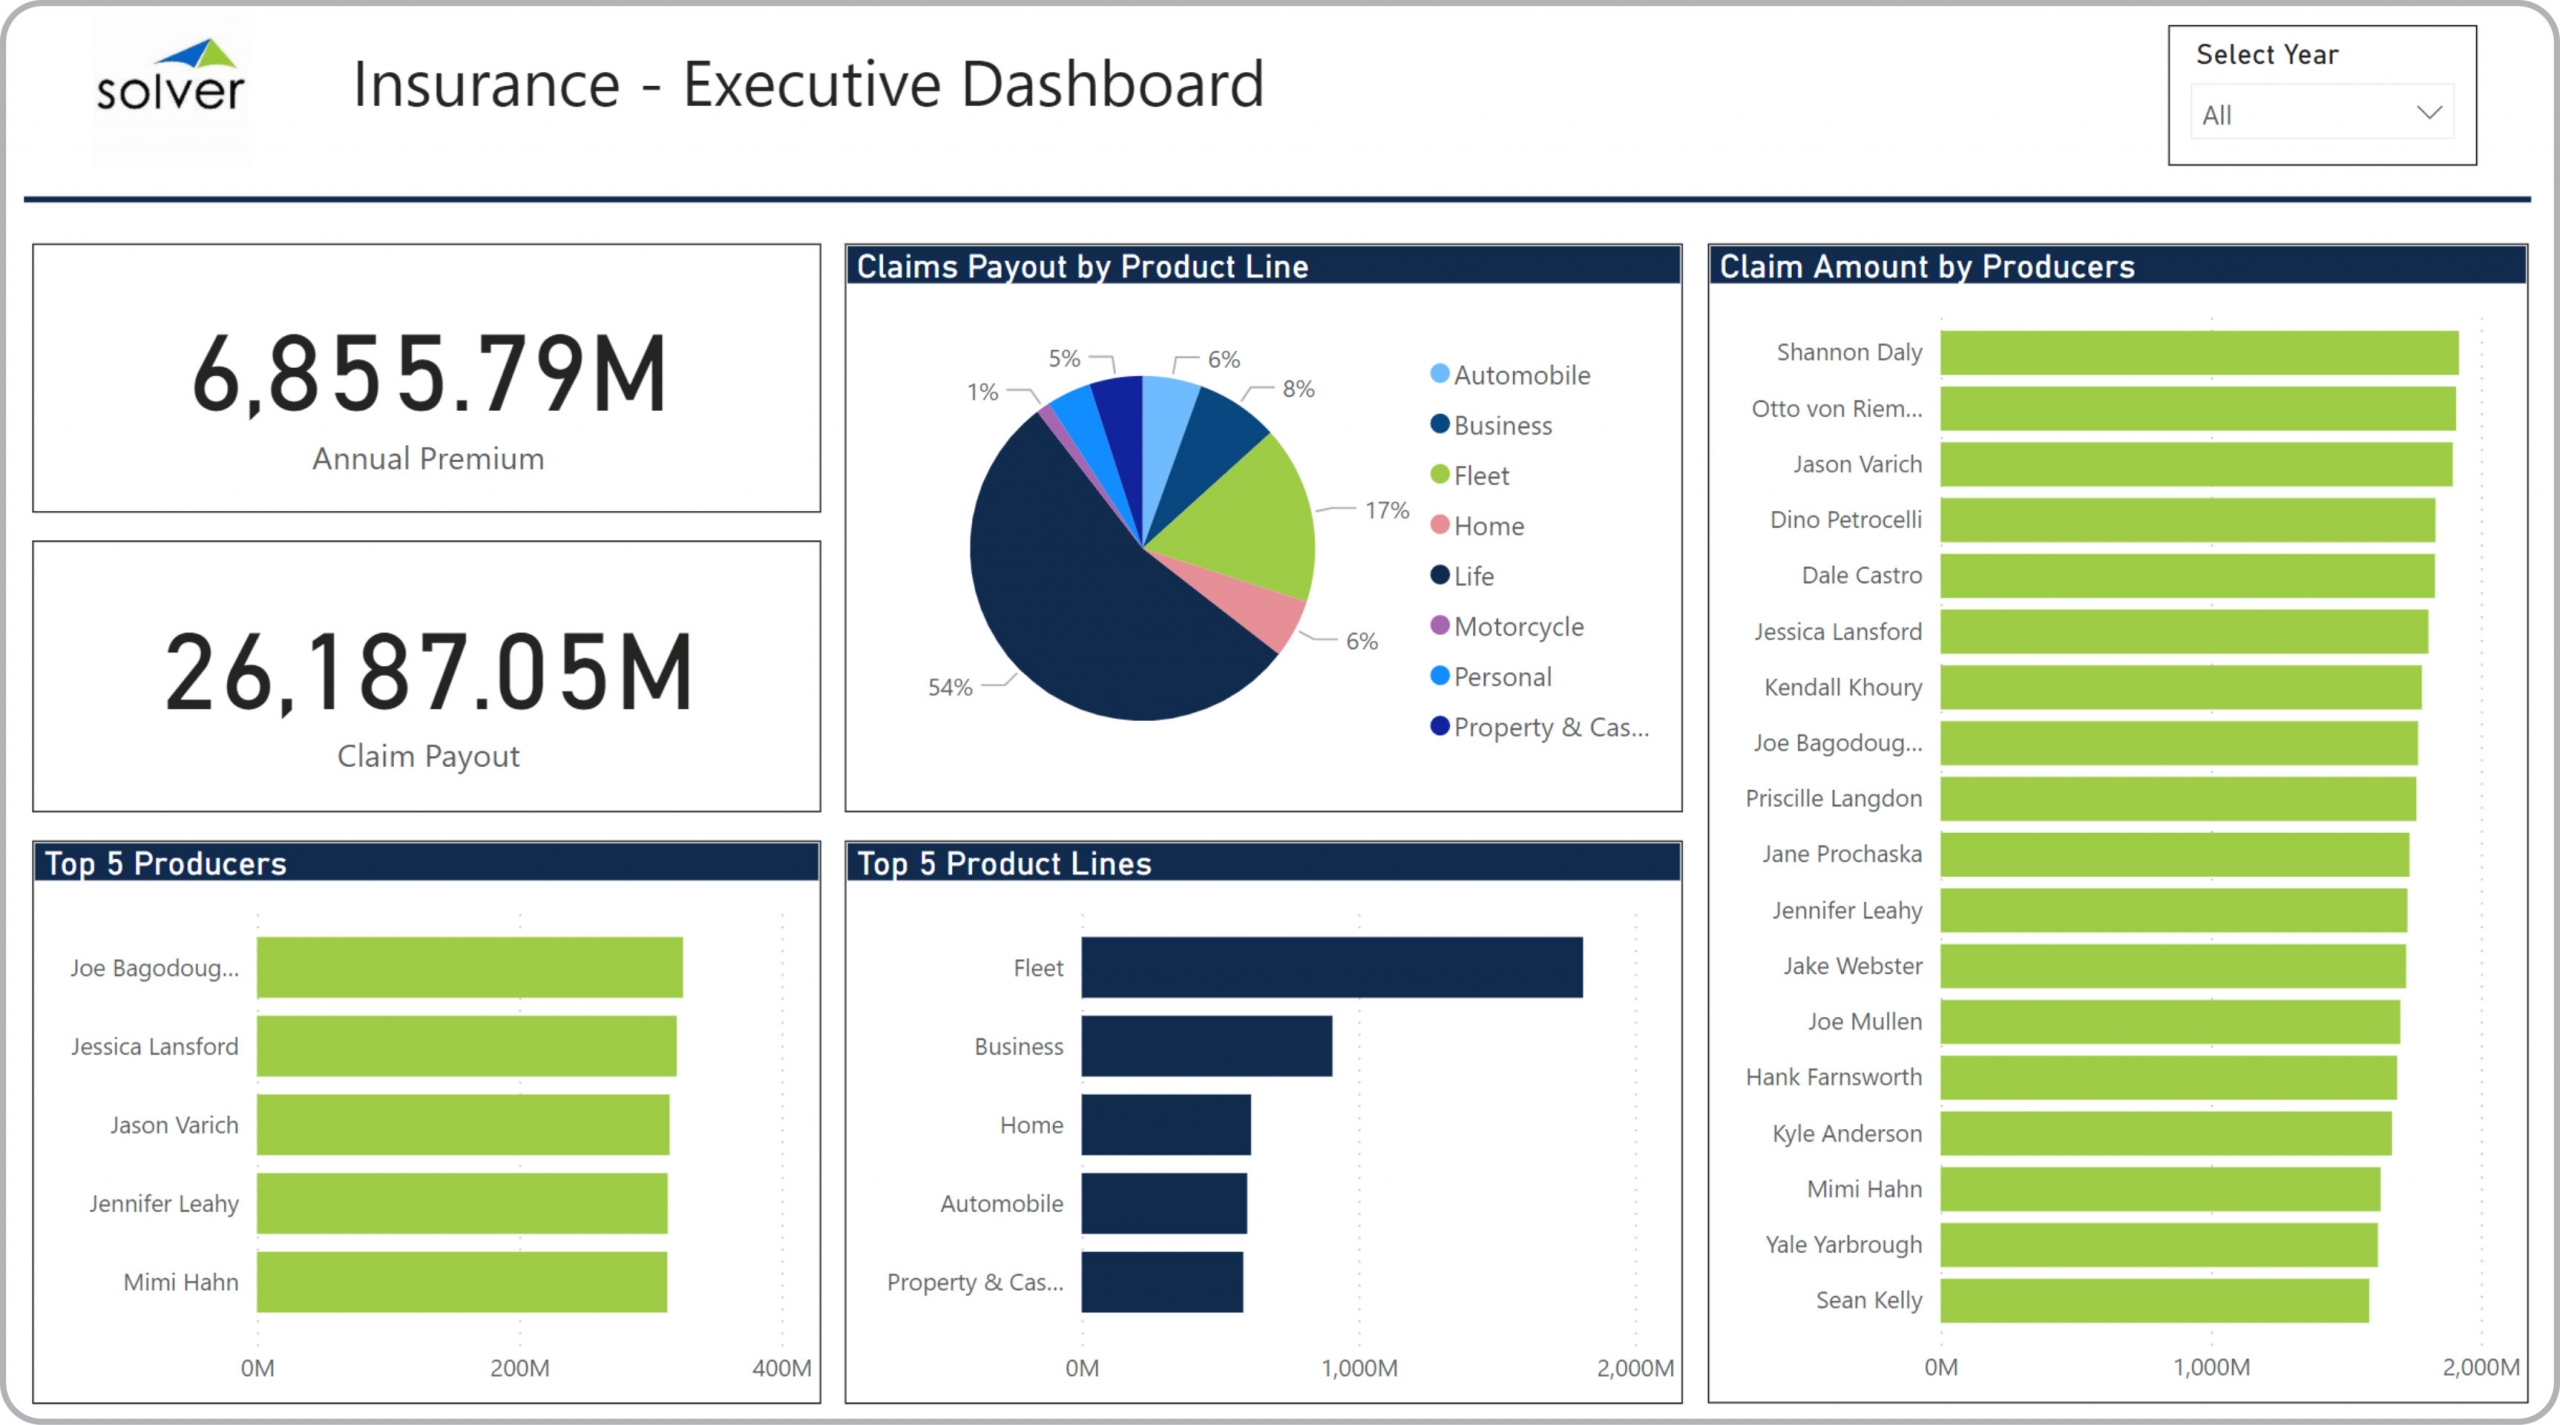
Executive Dashboard for Insurance Companies
What is an Executive Dashboard ? Executive Dashboard are considered corporate monitoring tools and ...
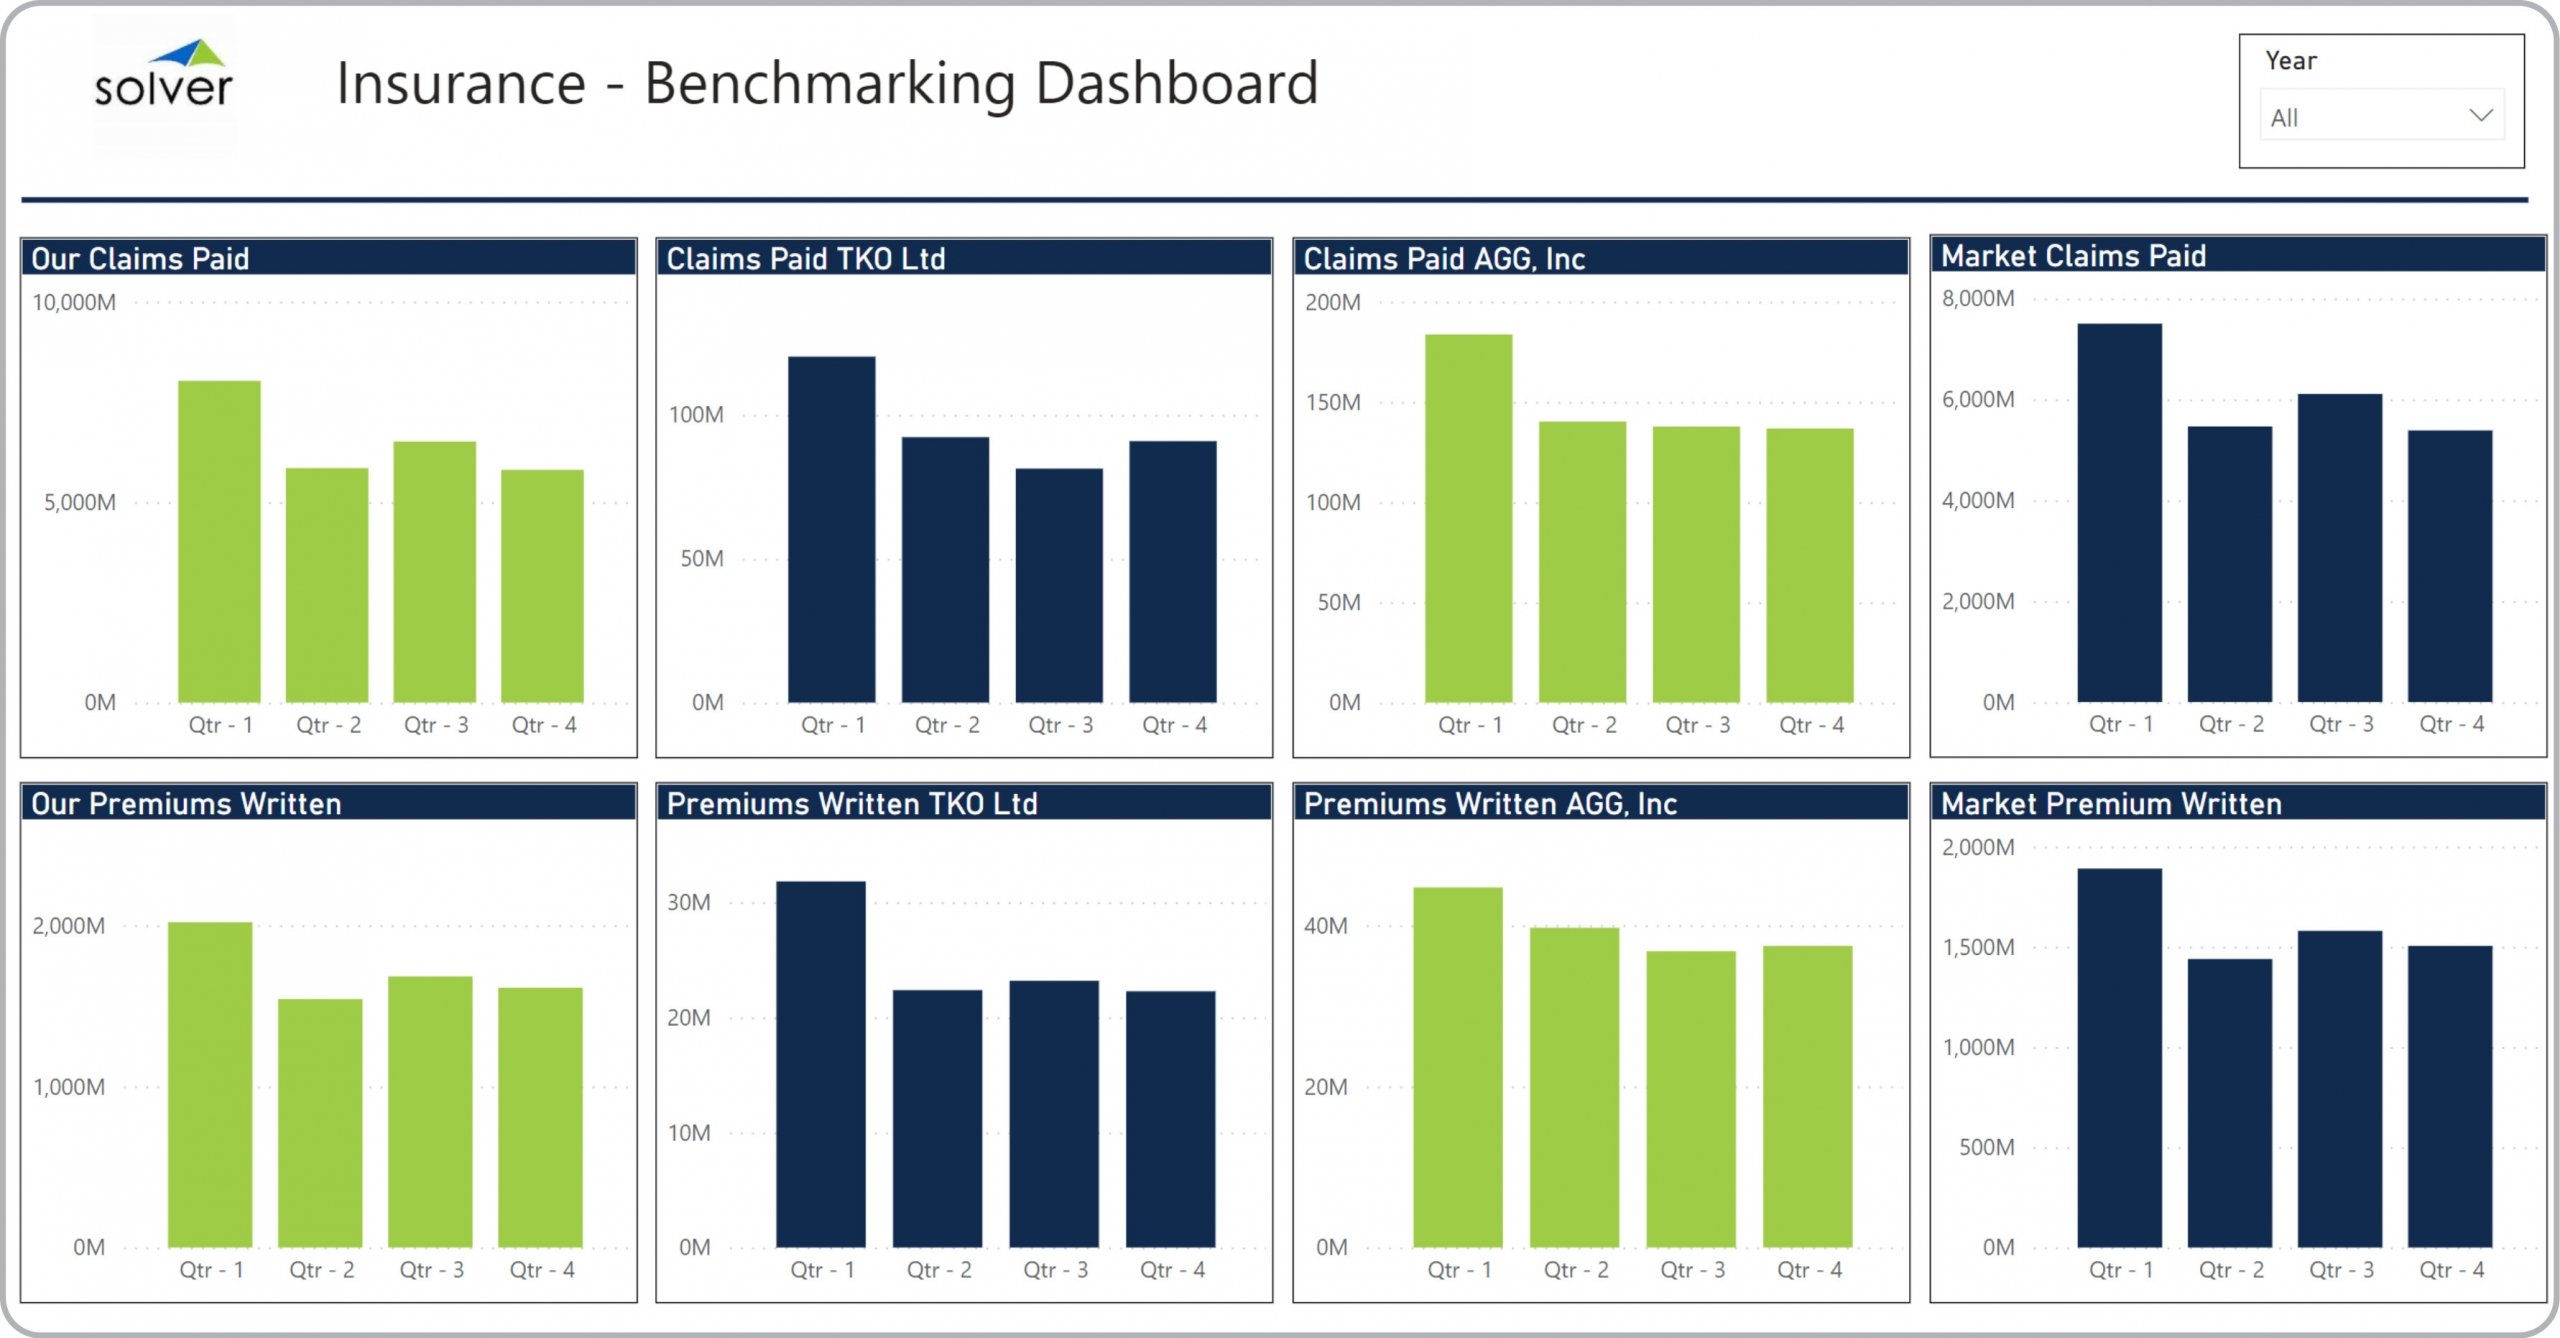
Benchmarking Dashboard for Insurance Companies
What is a Benchmarking Dashboard ? Benchmarking Dashboard are considered comparison analysis tools ...
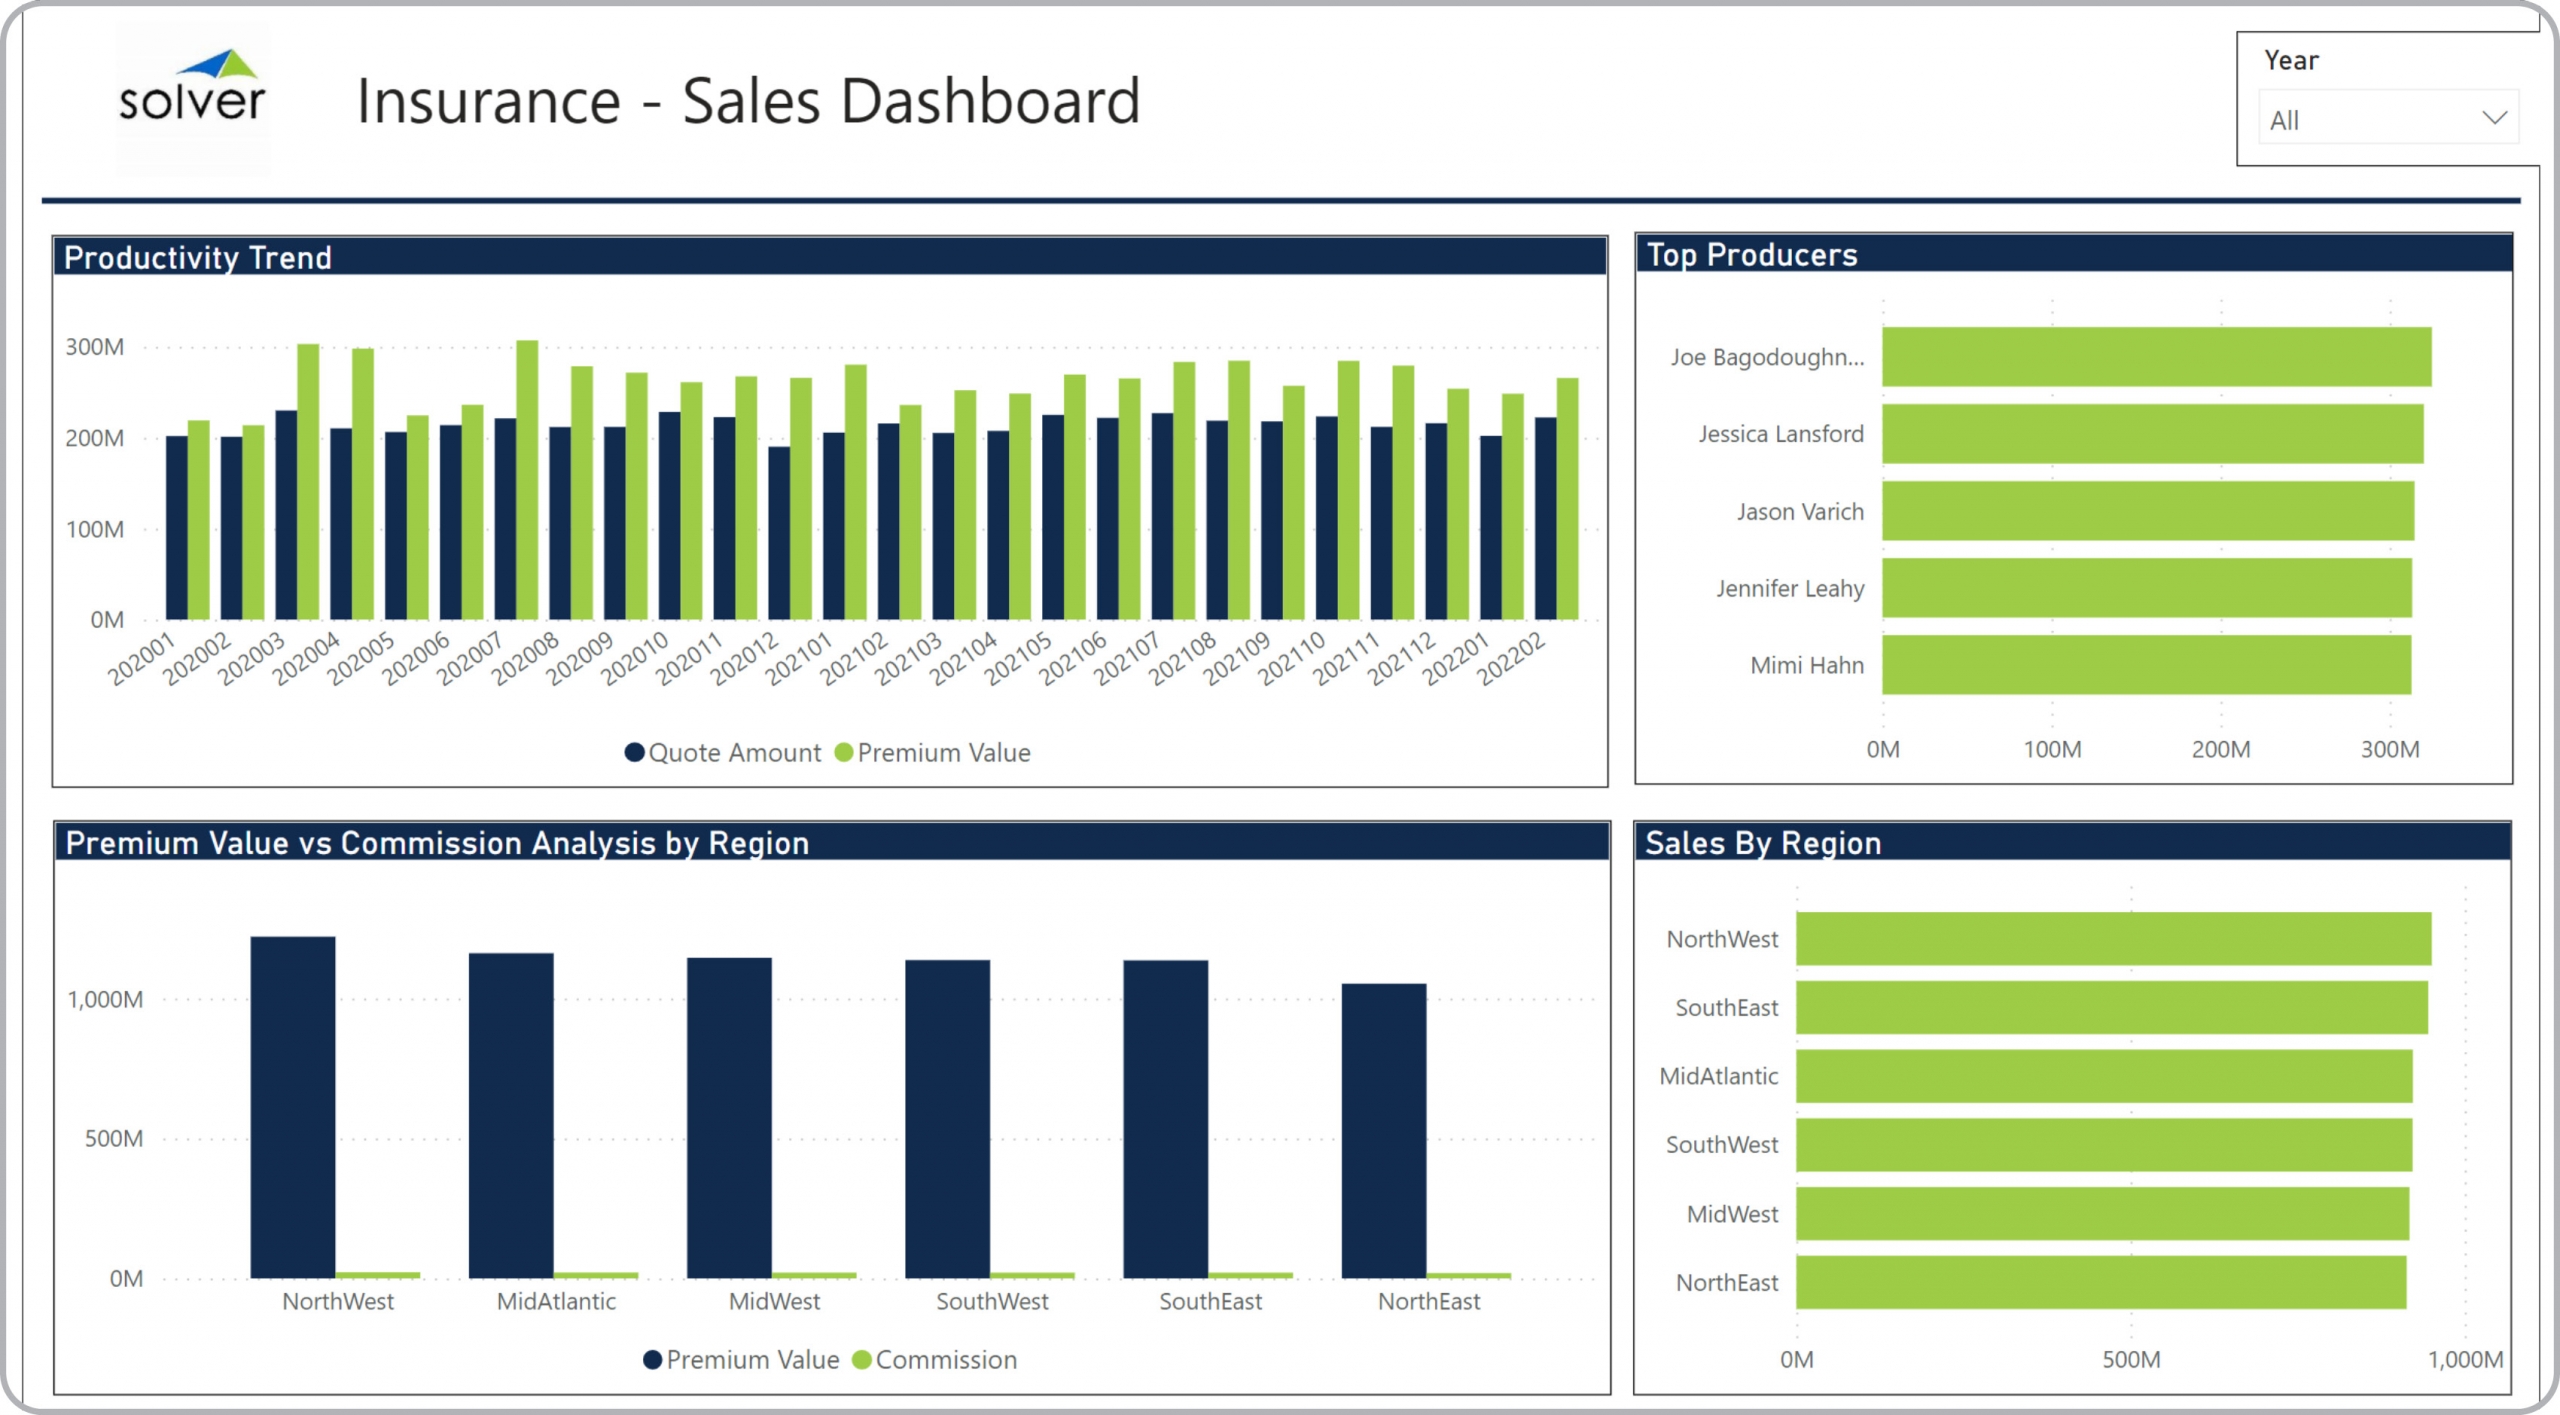
Sales Dashboard for Insurance Companies
What is a Sales Dashboard for Insurance Companies ? Sales Dashboards are considered performance ...
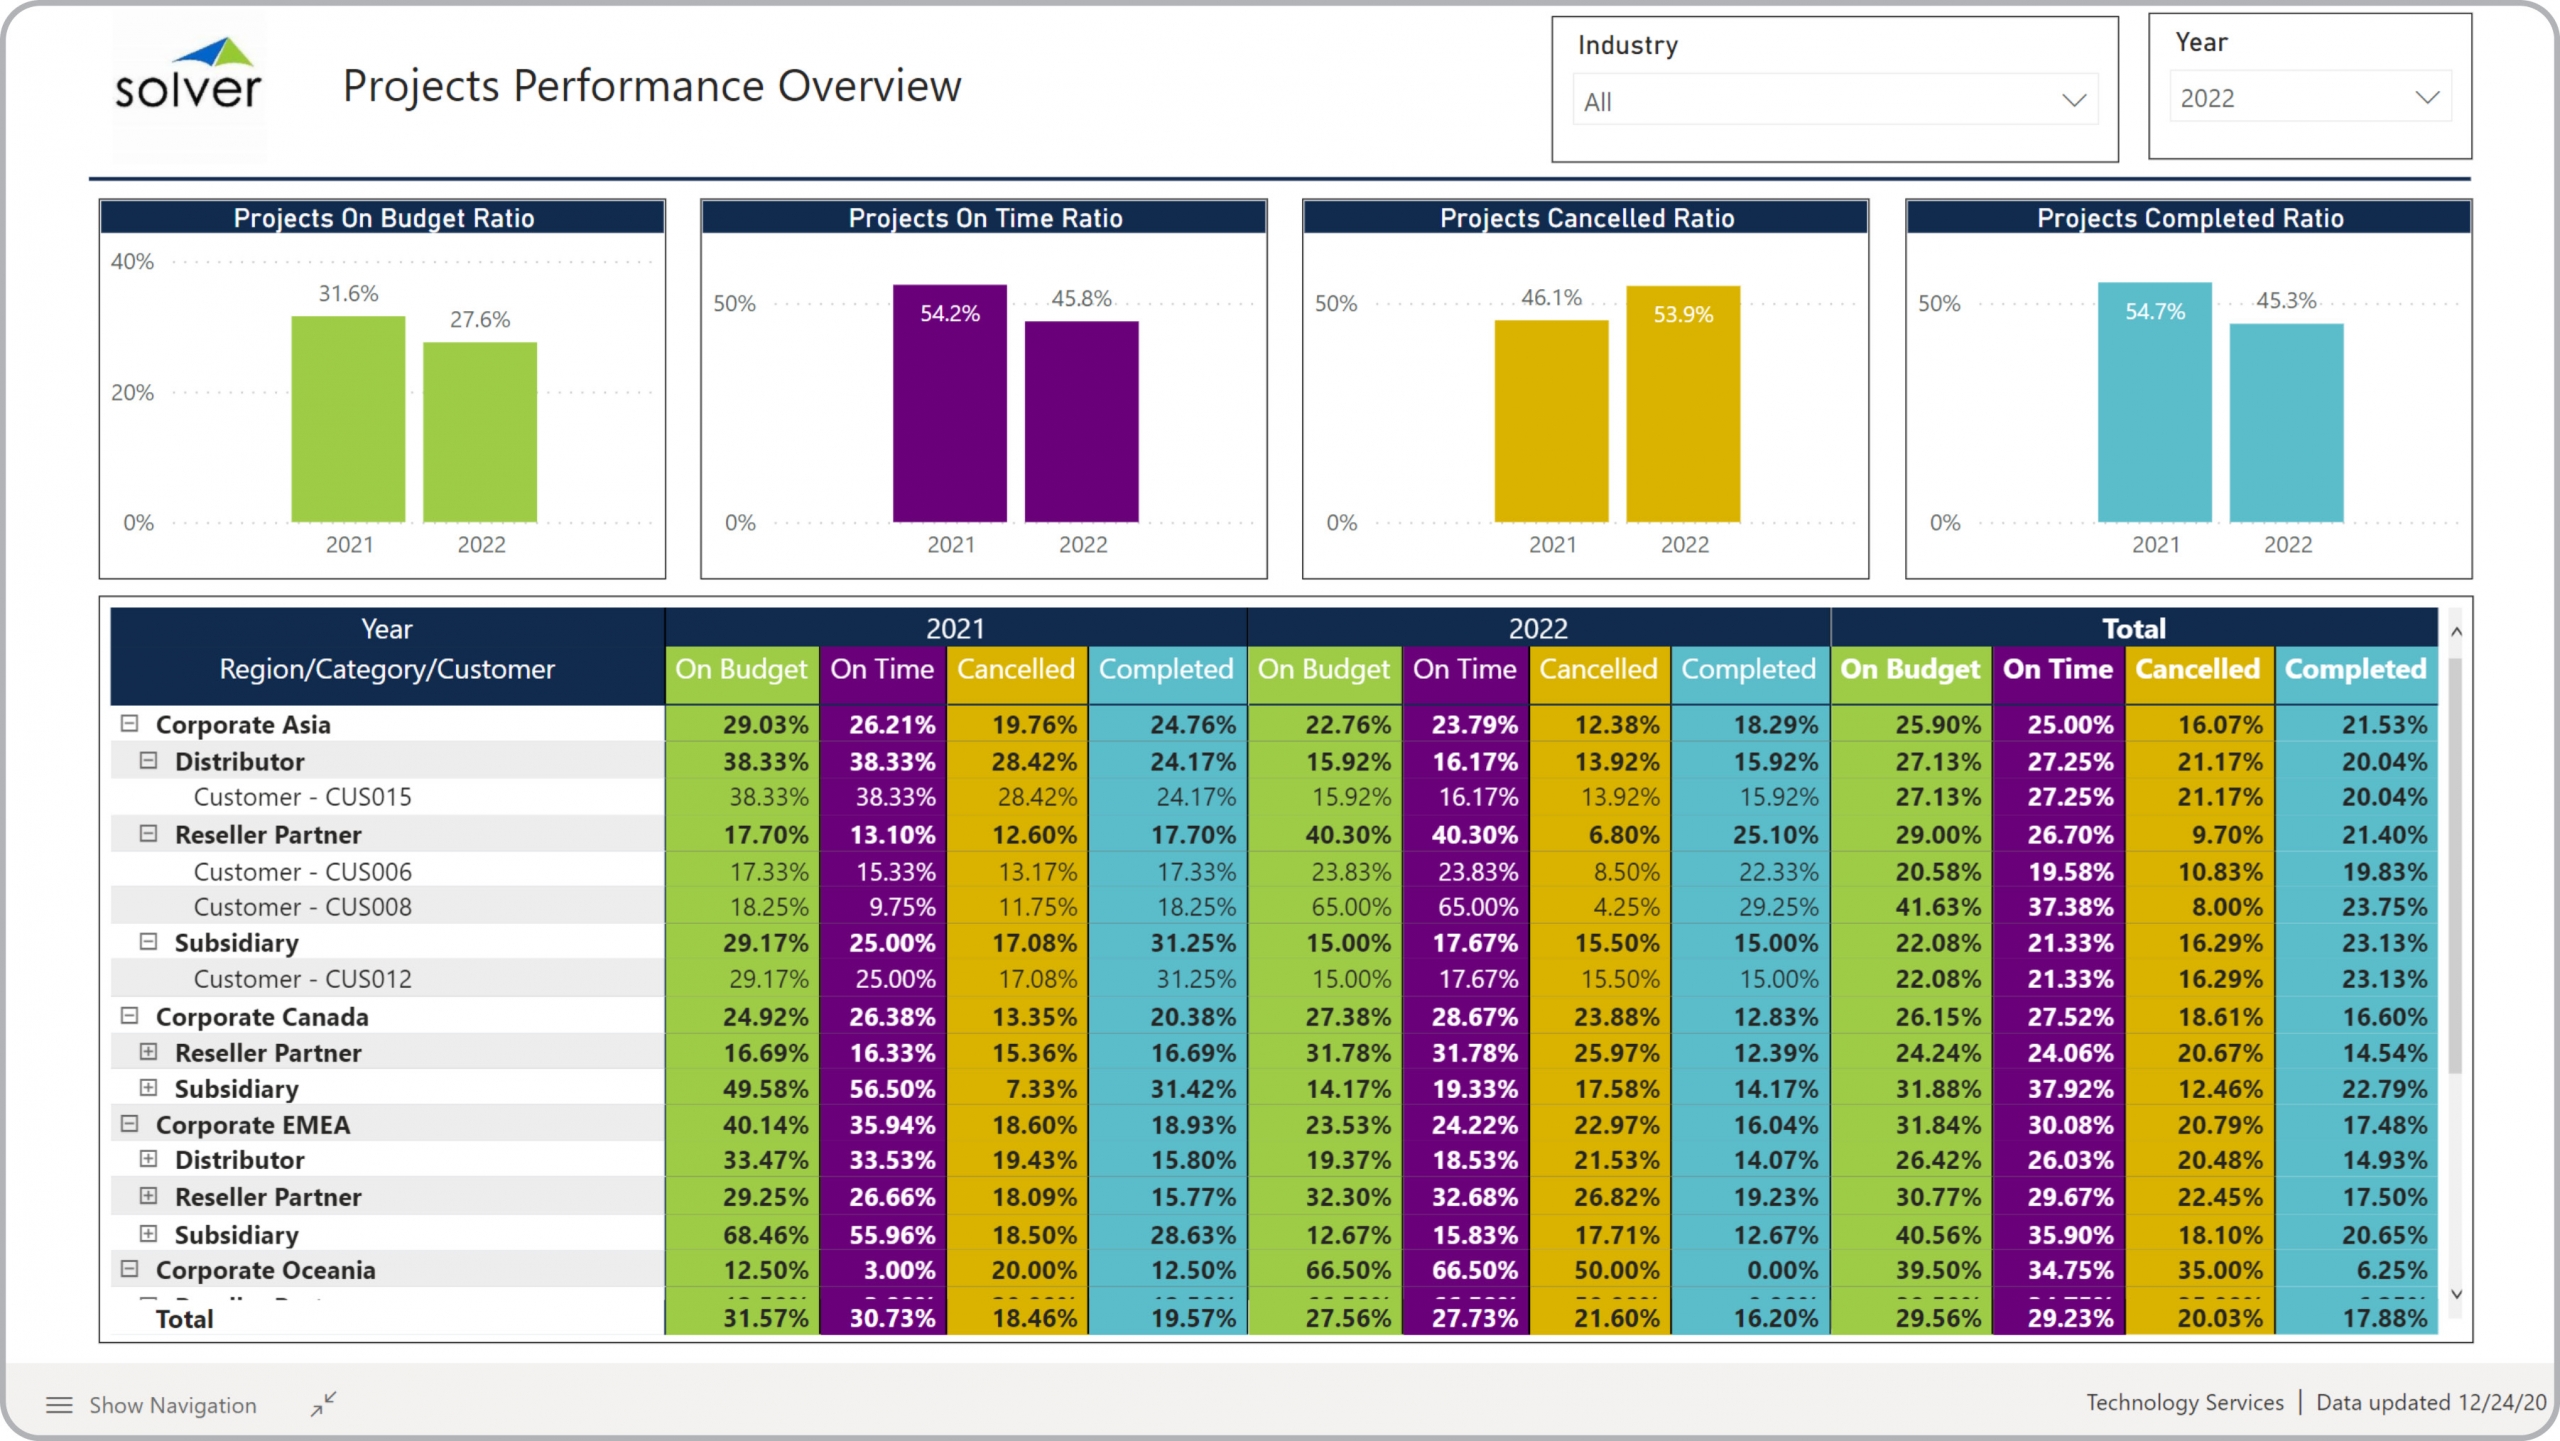
Project Performance Dashboard for Technology Companies
What is a Project Performance Dashboard ? Project Dashboards are considered professional services ...
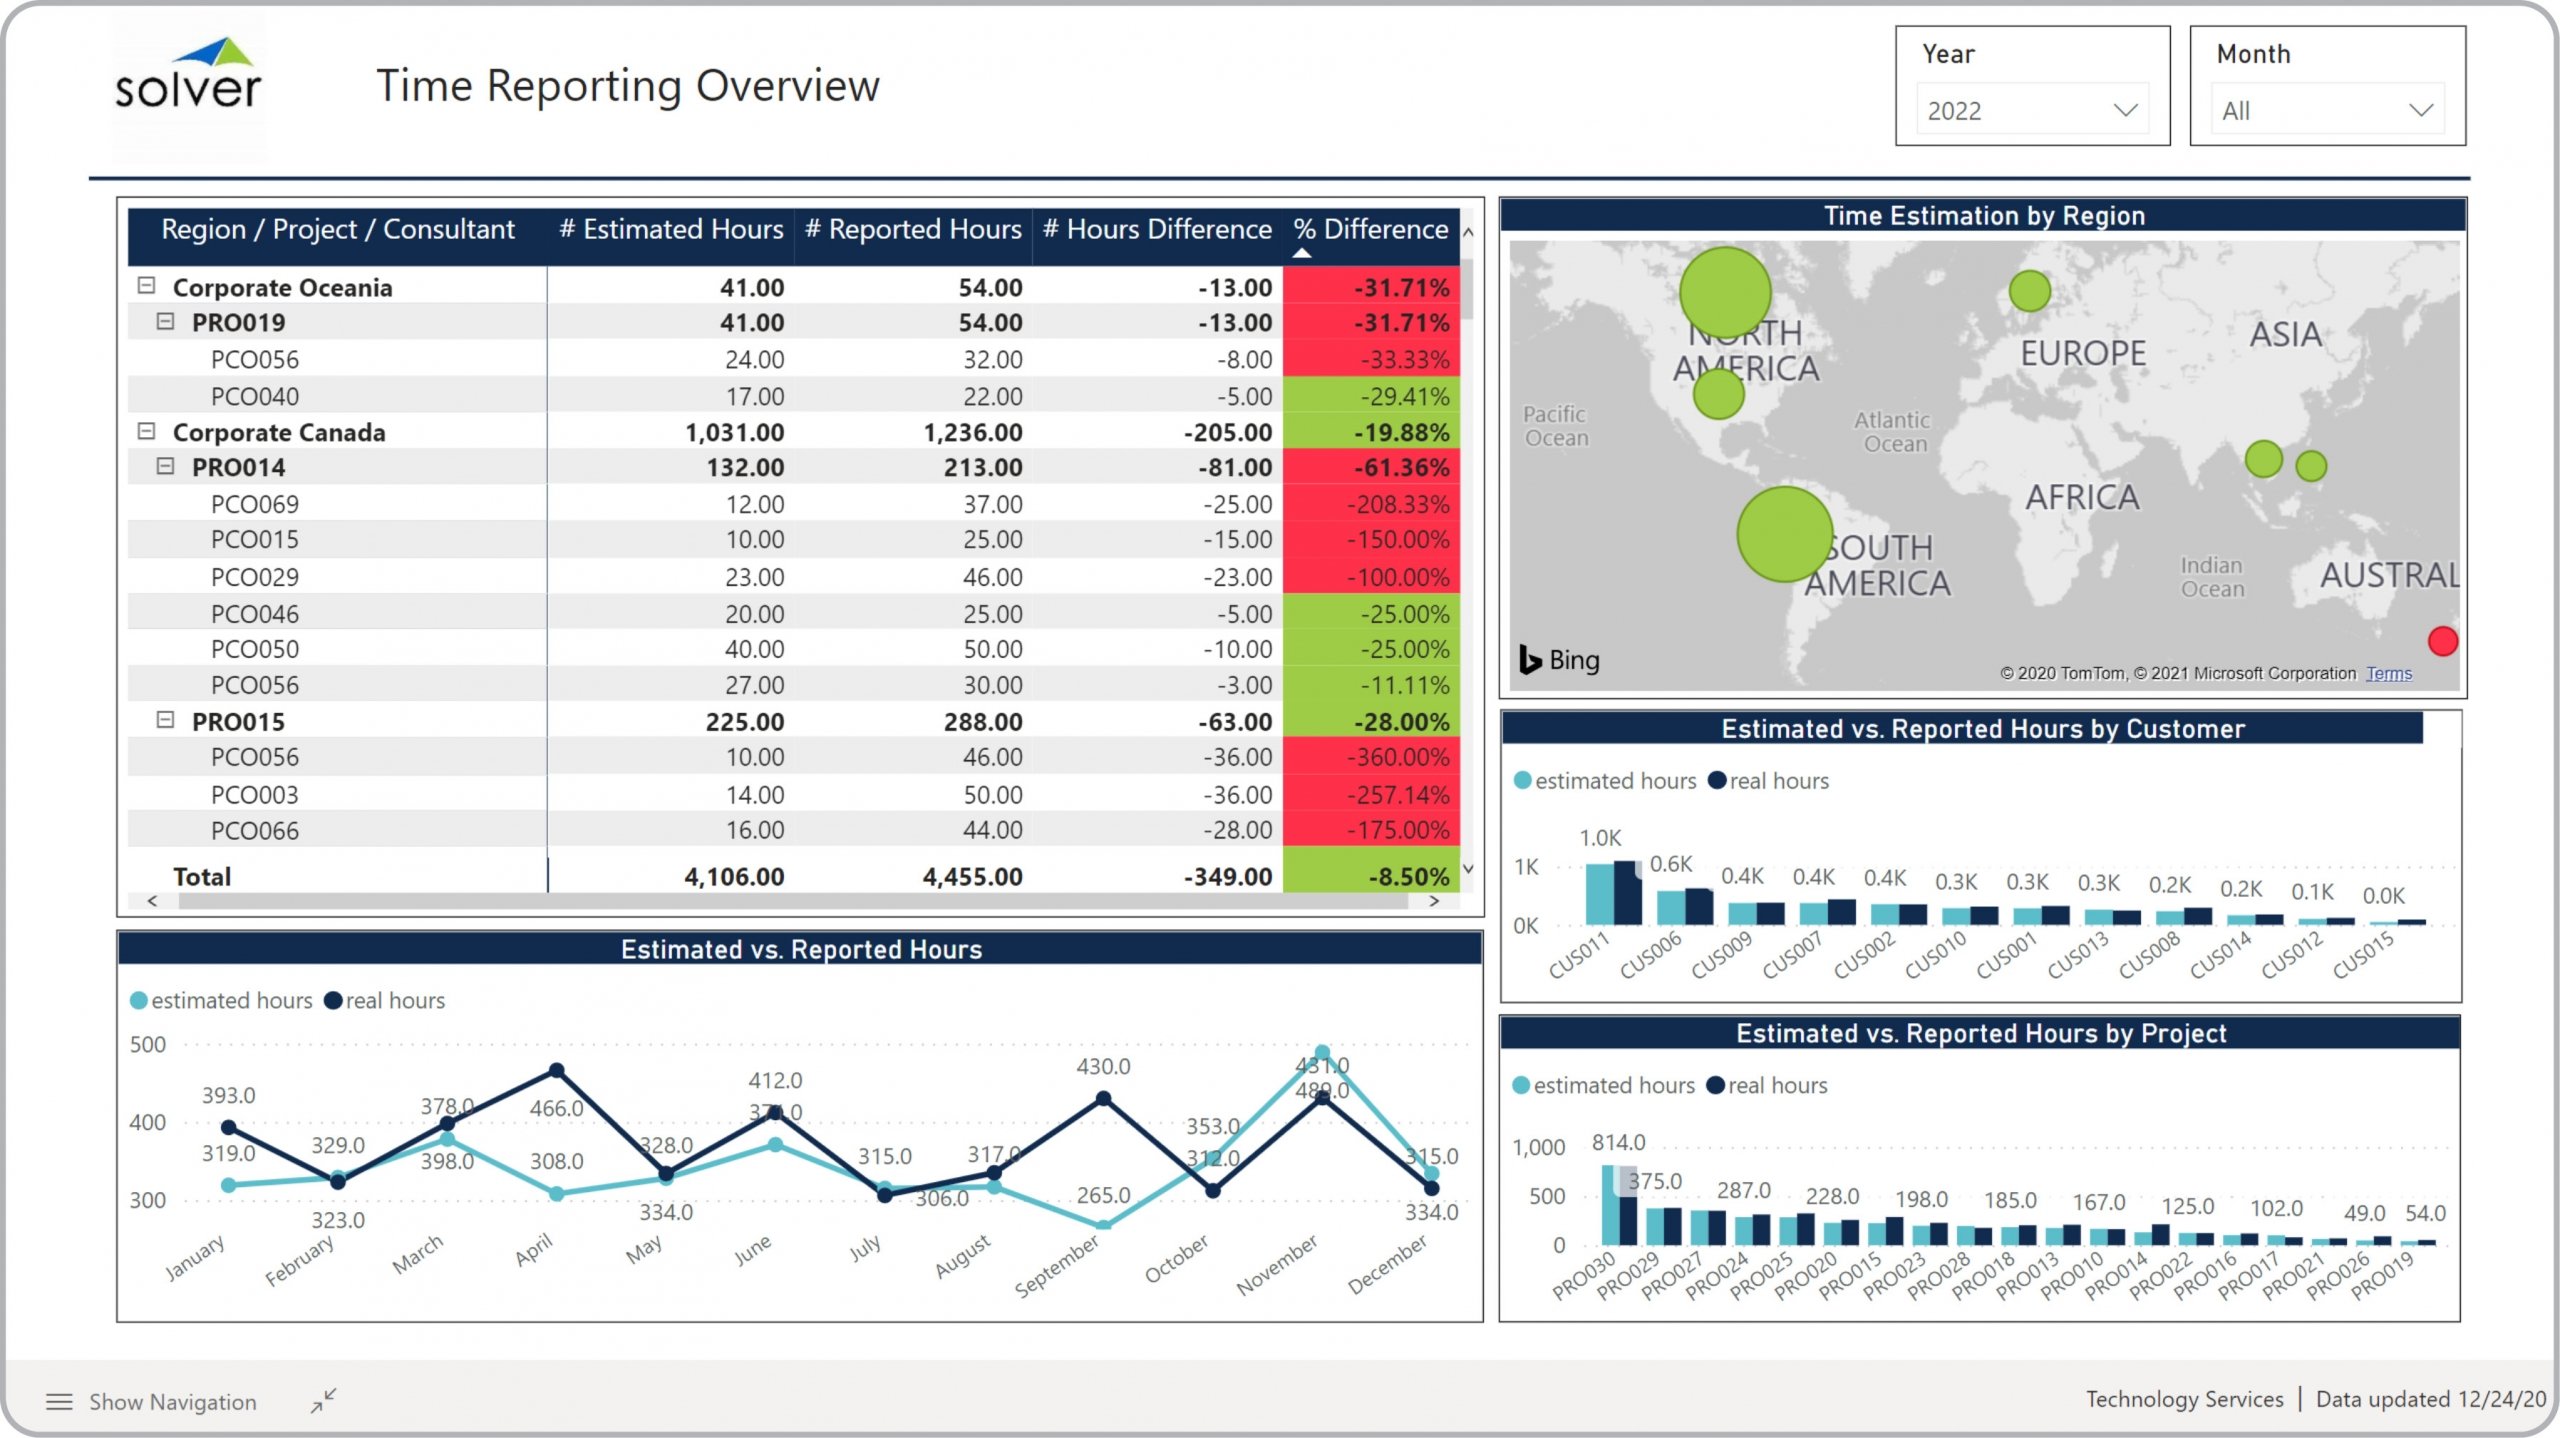
Consulting Time Dashboard for Technology Companies
What is a Consulting Time Dashboard for Technology Companies ? Time analysis dashboards are ...
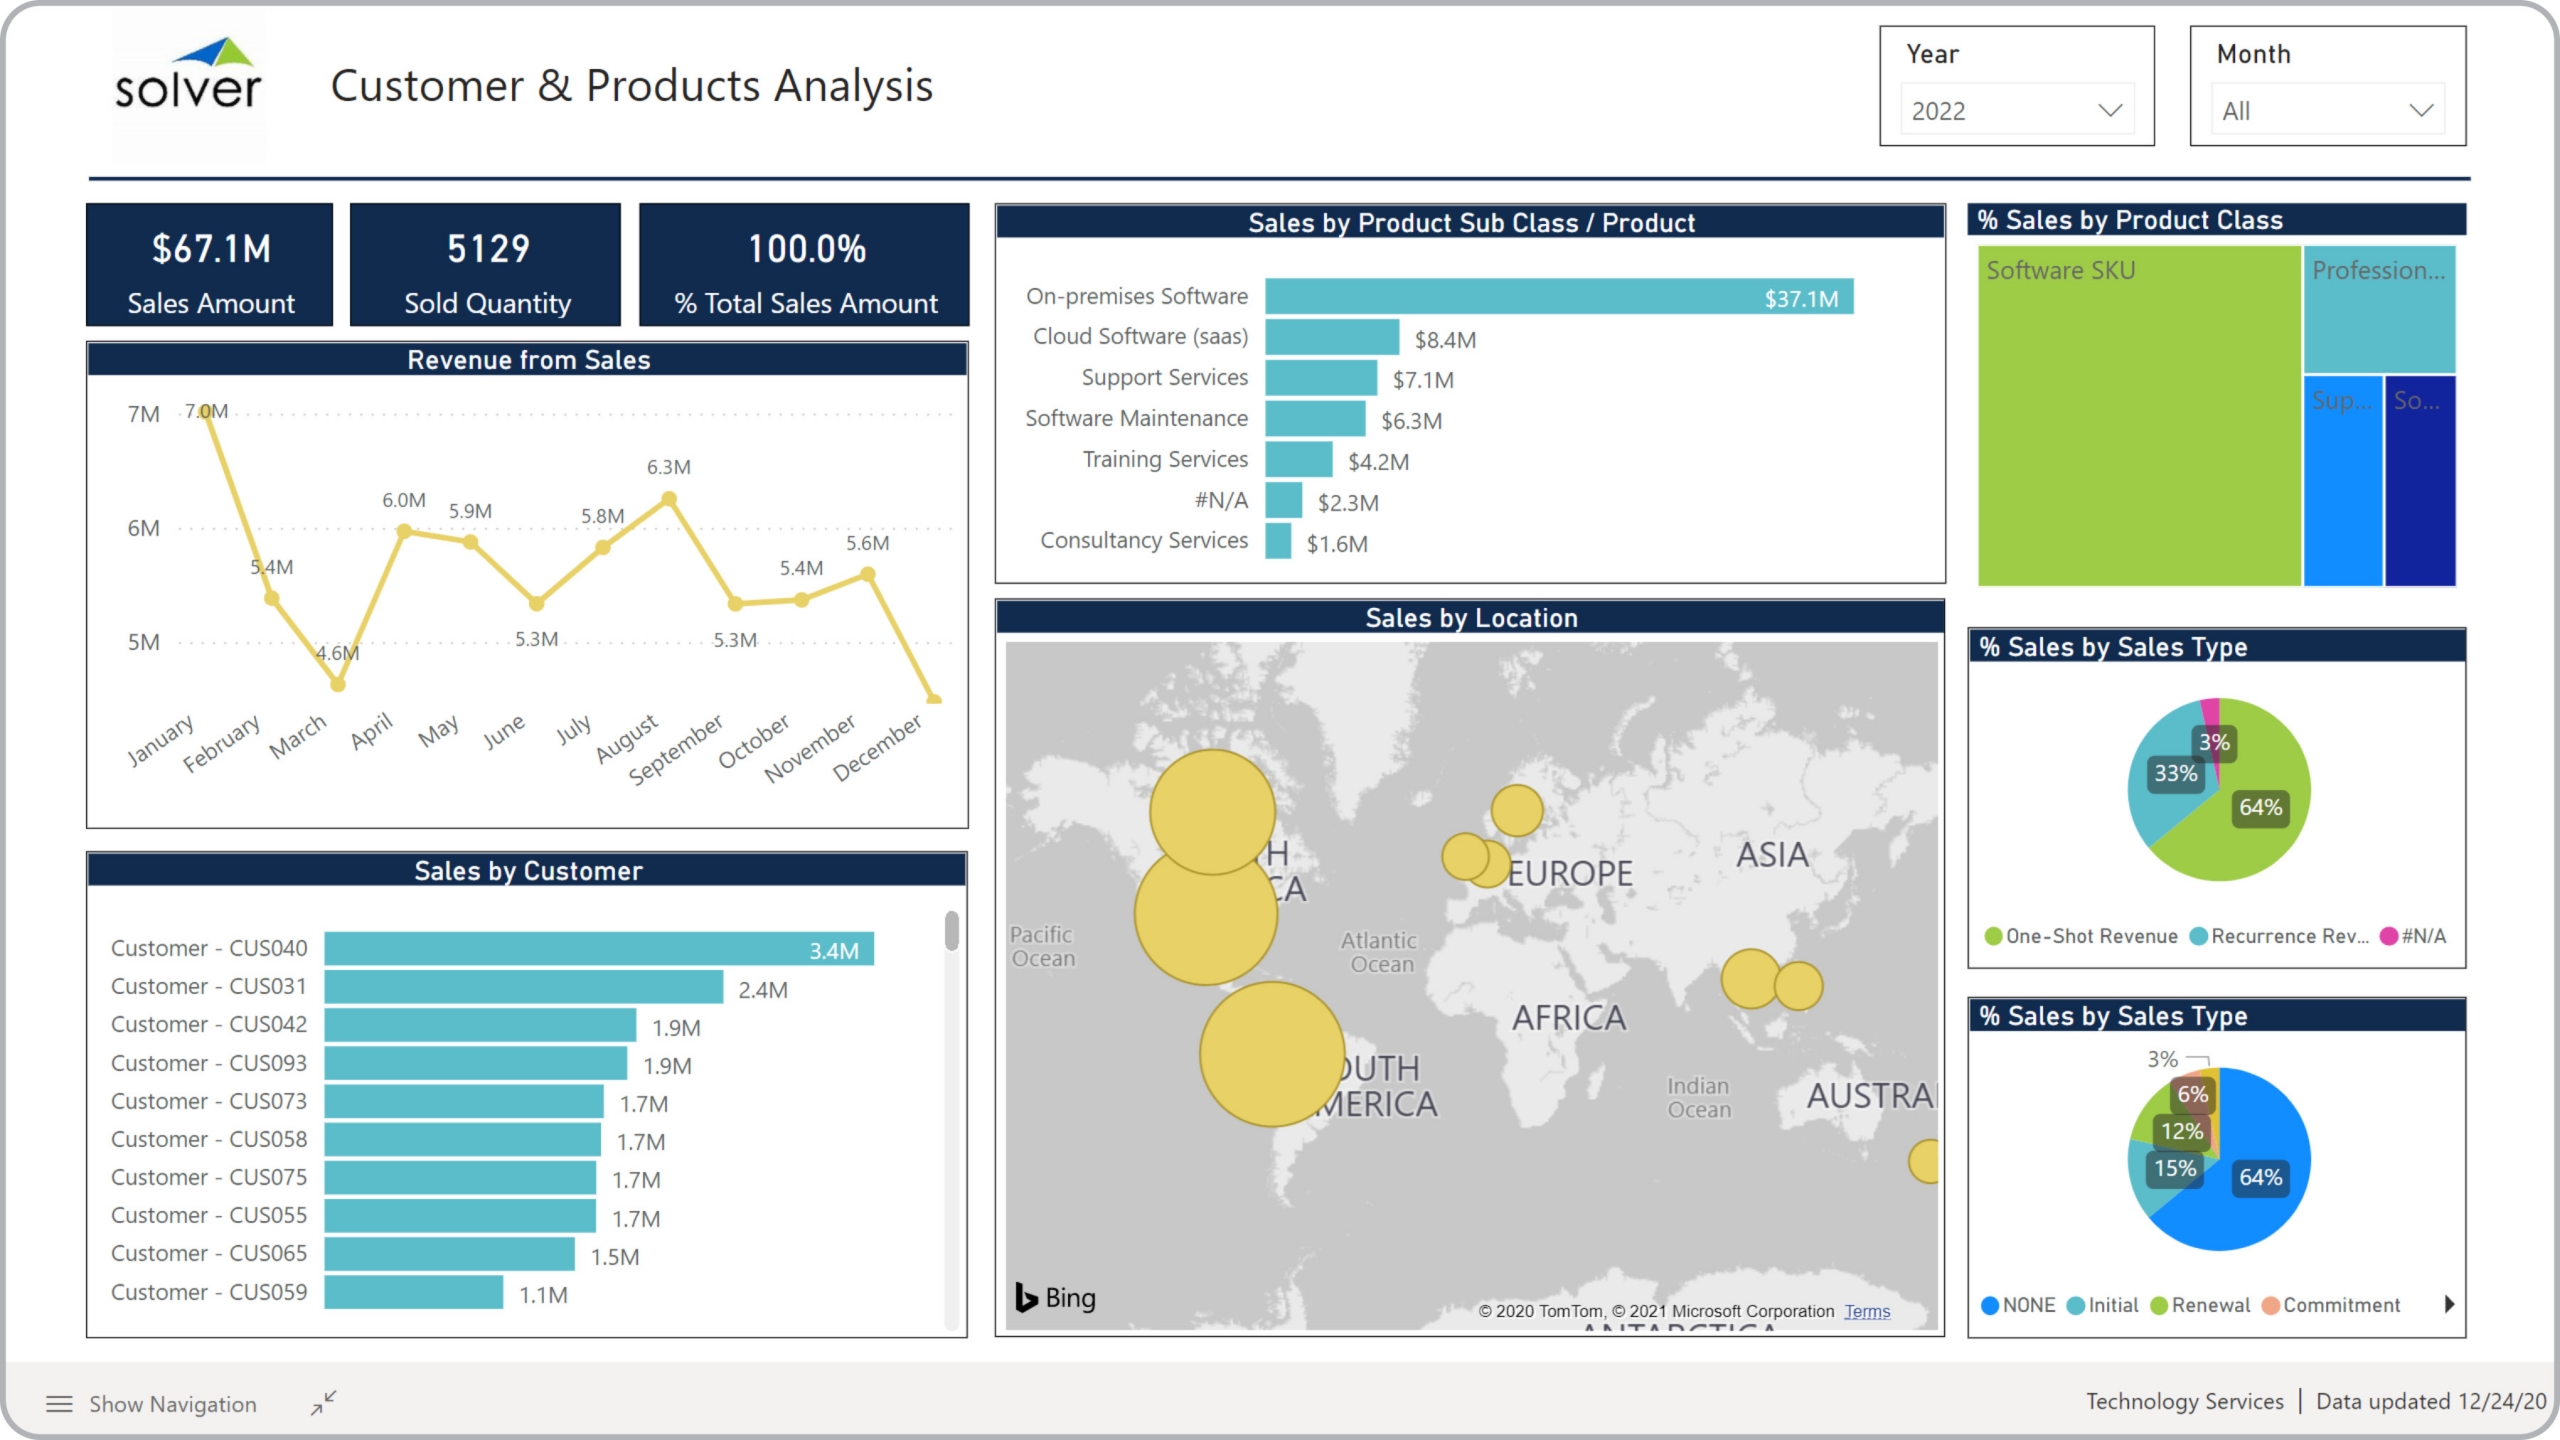
Sales Dashboard for Technology Companies
What is a Sales Dashboard for Technology Companies ? Product and Customer Sales Dashboards are ...
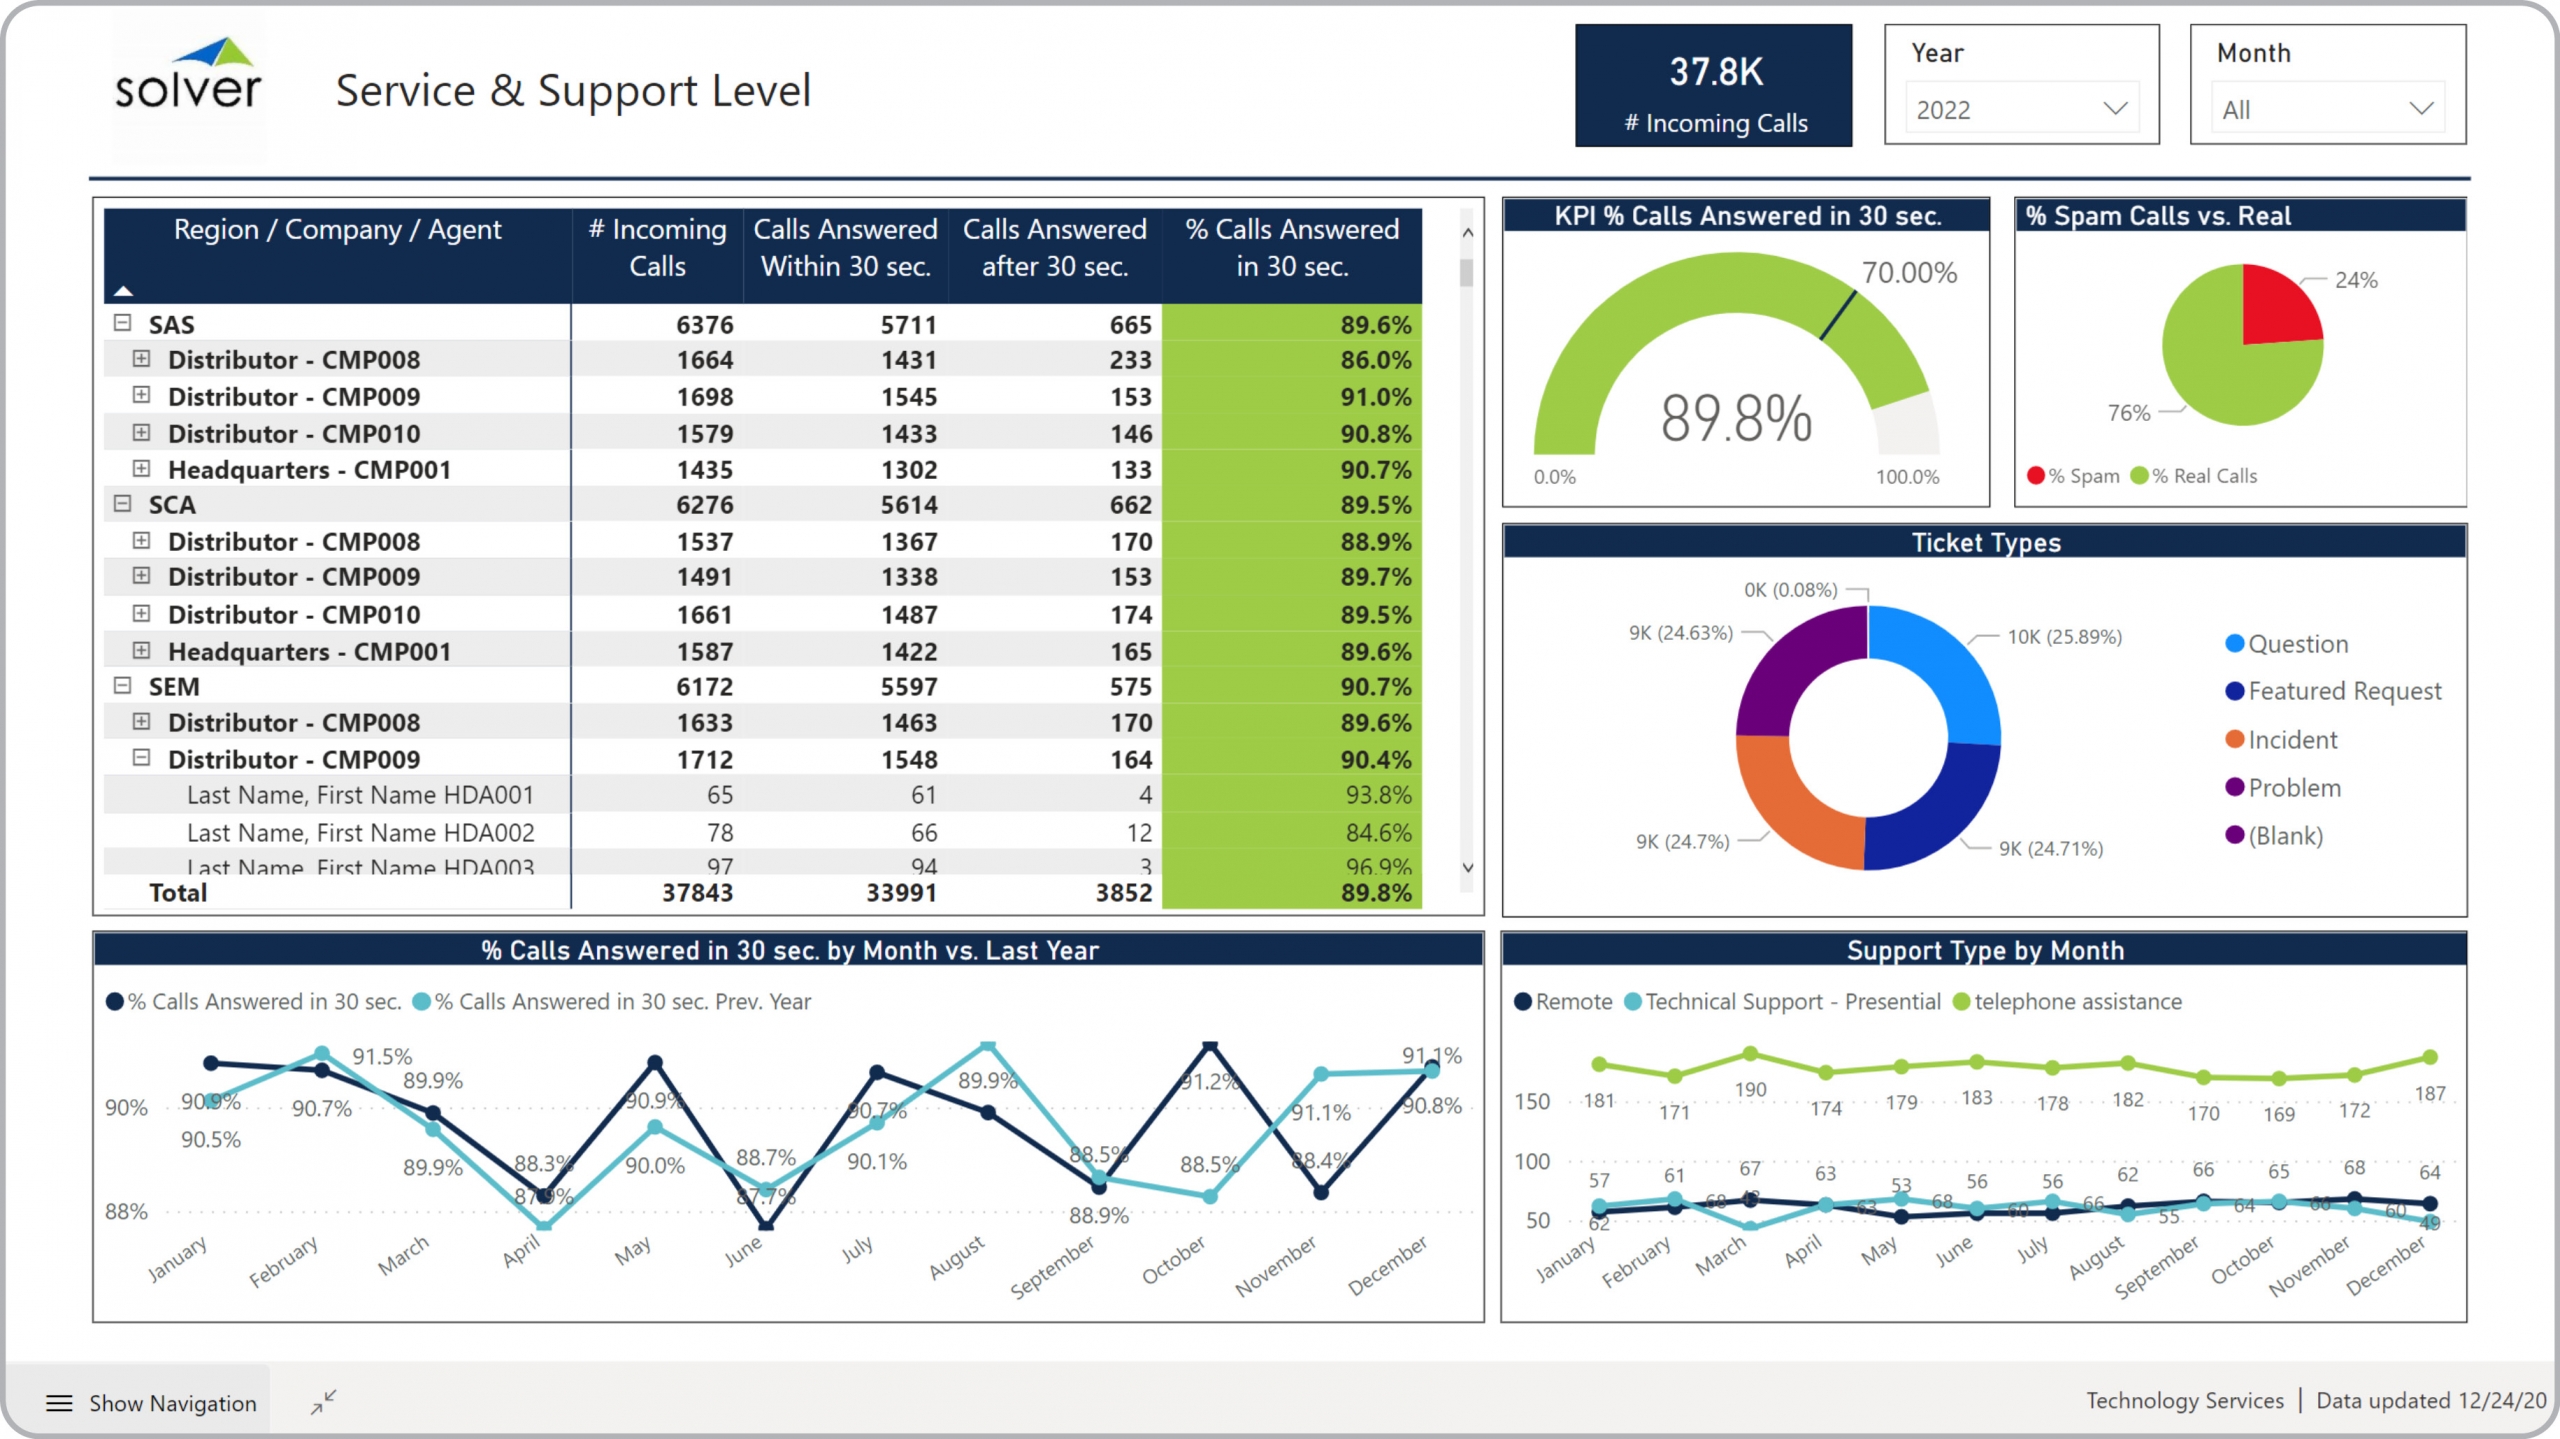
Support and Service Level Dashboard for Technology Companies
What is a Support and Service Level Dashboard ? Support and Service Dashboards are considered ...
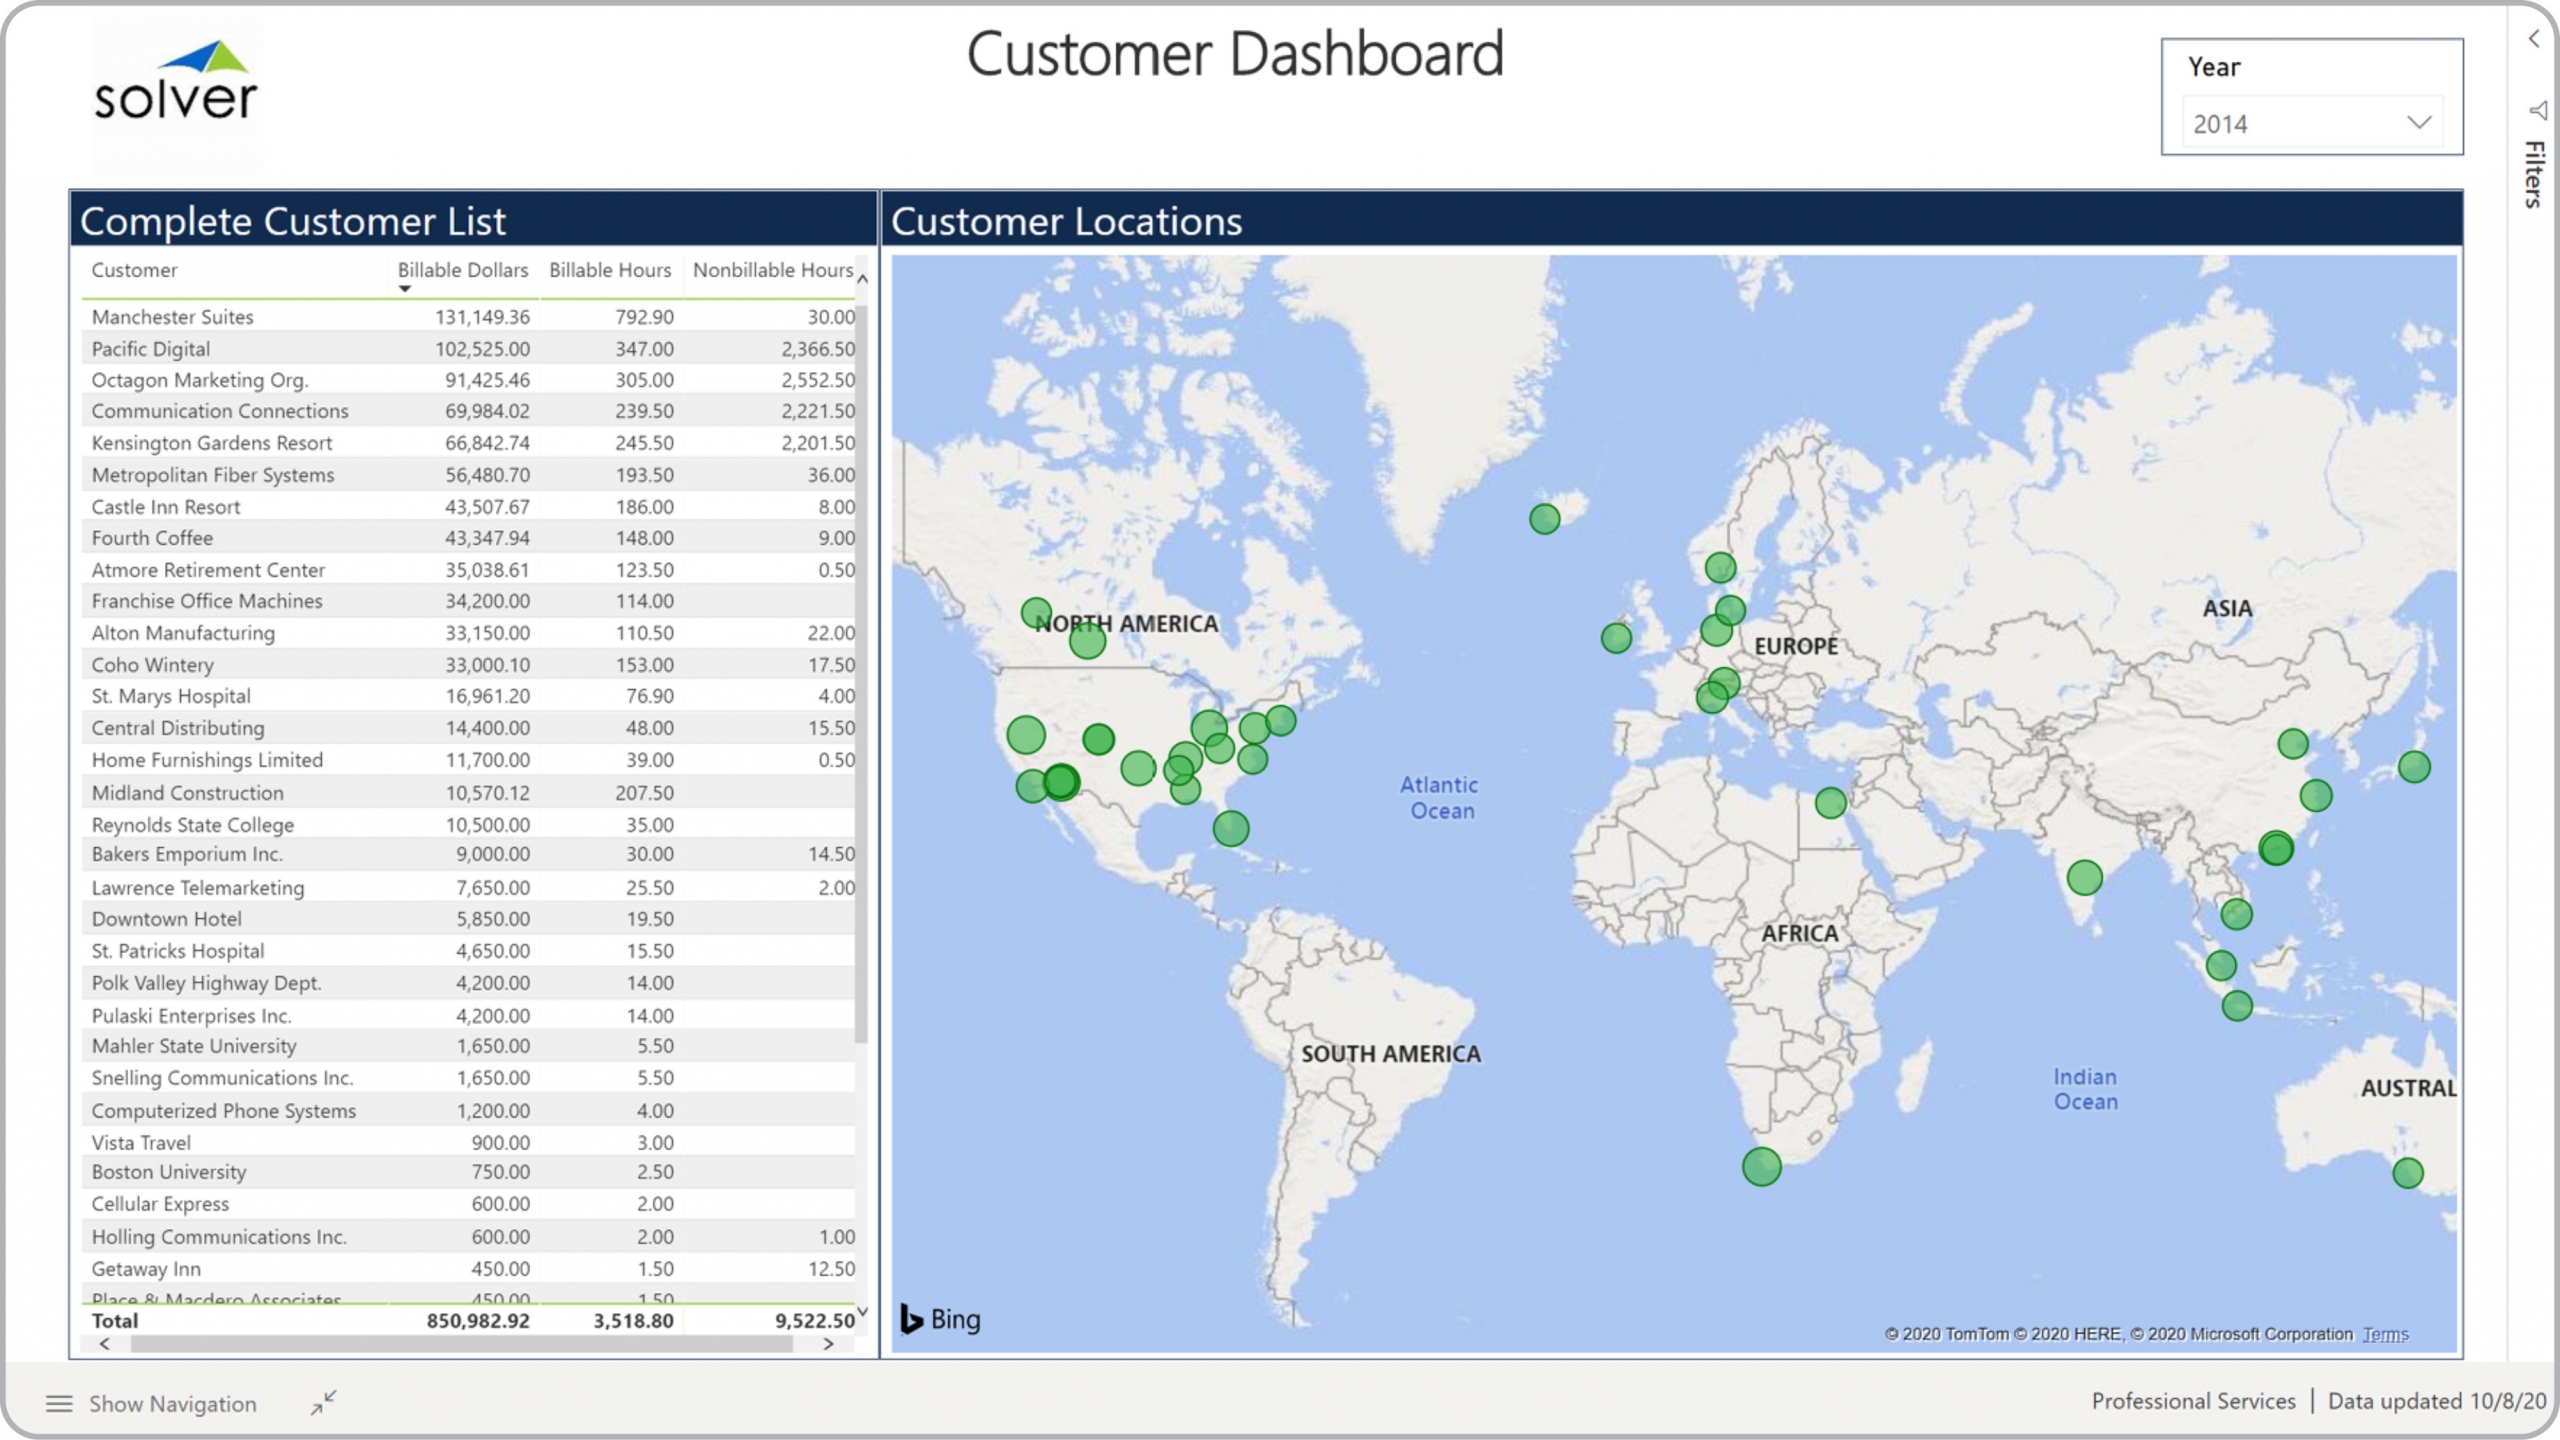
Customer Billing Dashboard for Professional Services Companies
What is a Customer Billing Dashboard ? Customer Billing Dashboards are considered client analysis ...
Project Dashboard for a Professional Services Company
What is a Project Dashboard for a Professional Services Company ? Project Dashboards are considered ...
Billing KPI Dashboard for a Professional Services Company
What is a Billing KPI Dashboard ? KPI Dashboards with billing metrics are considered operational ...
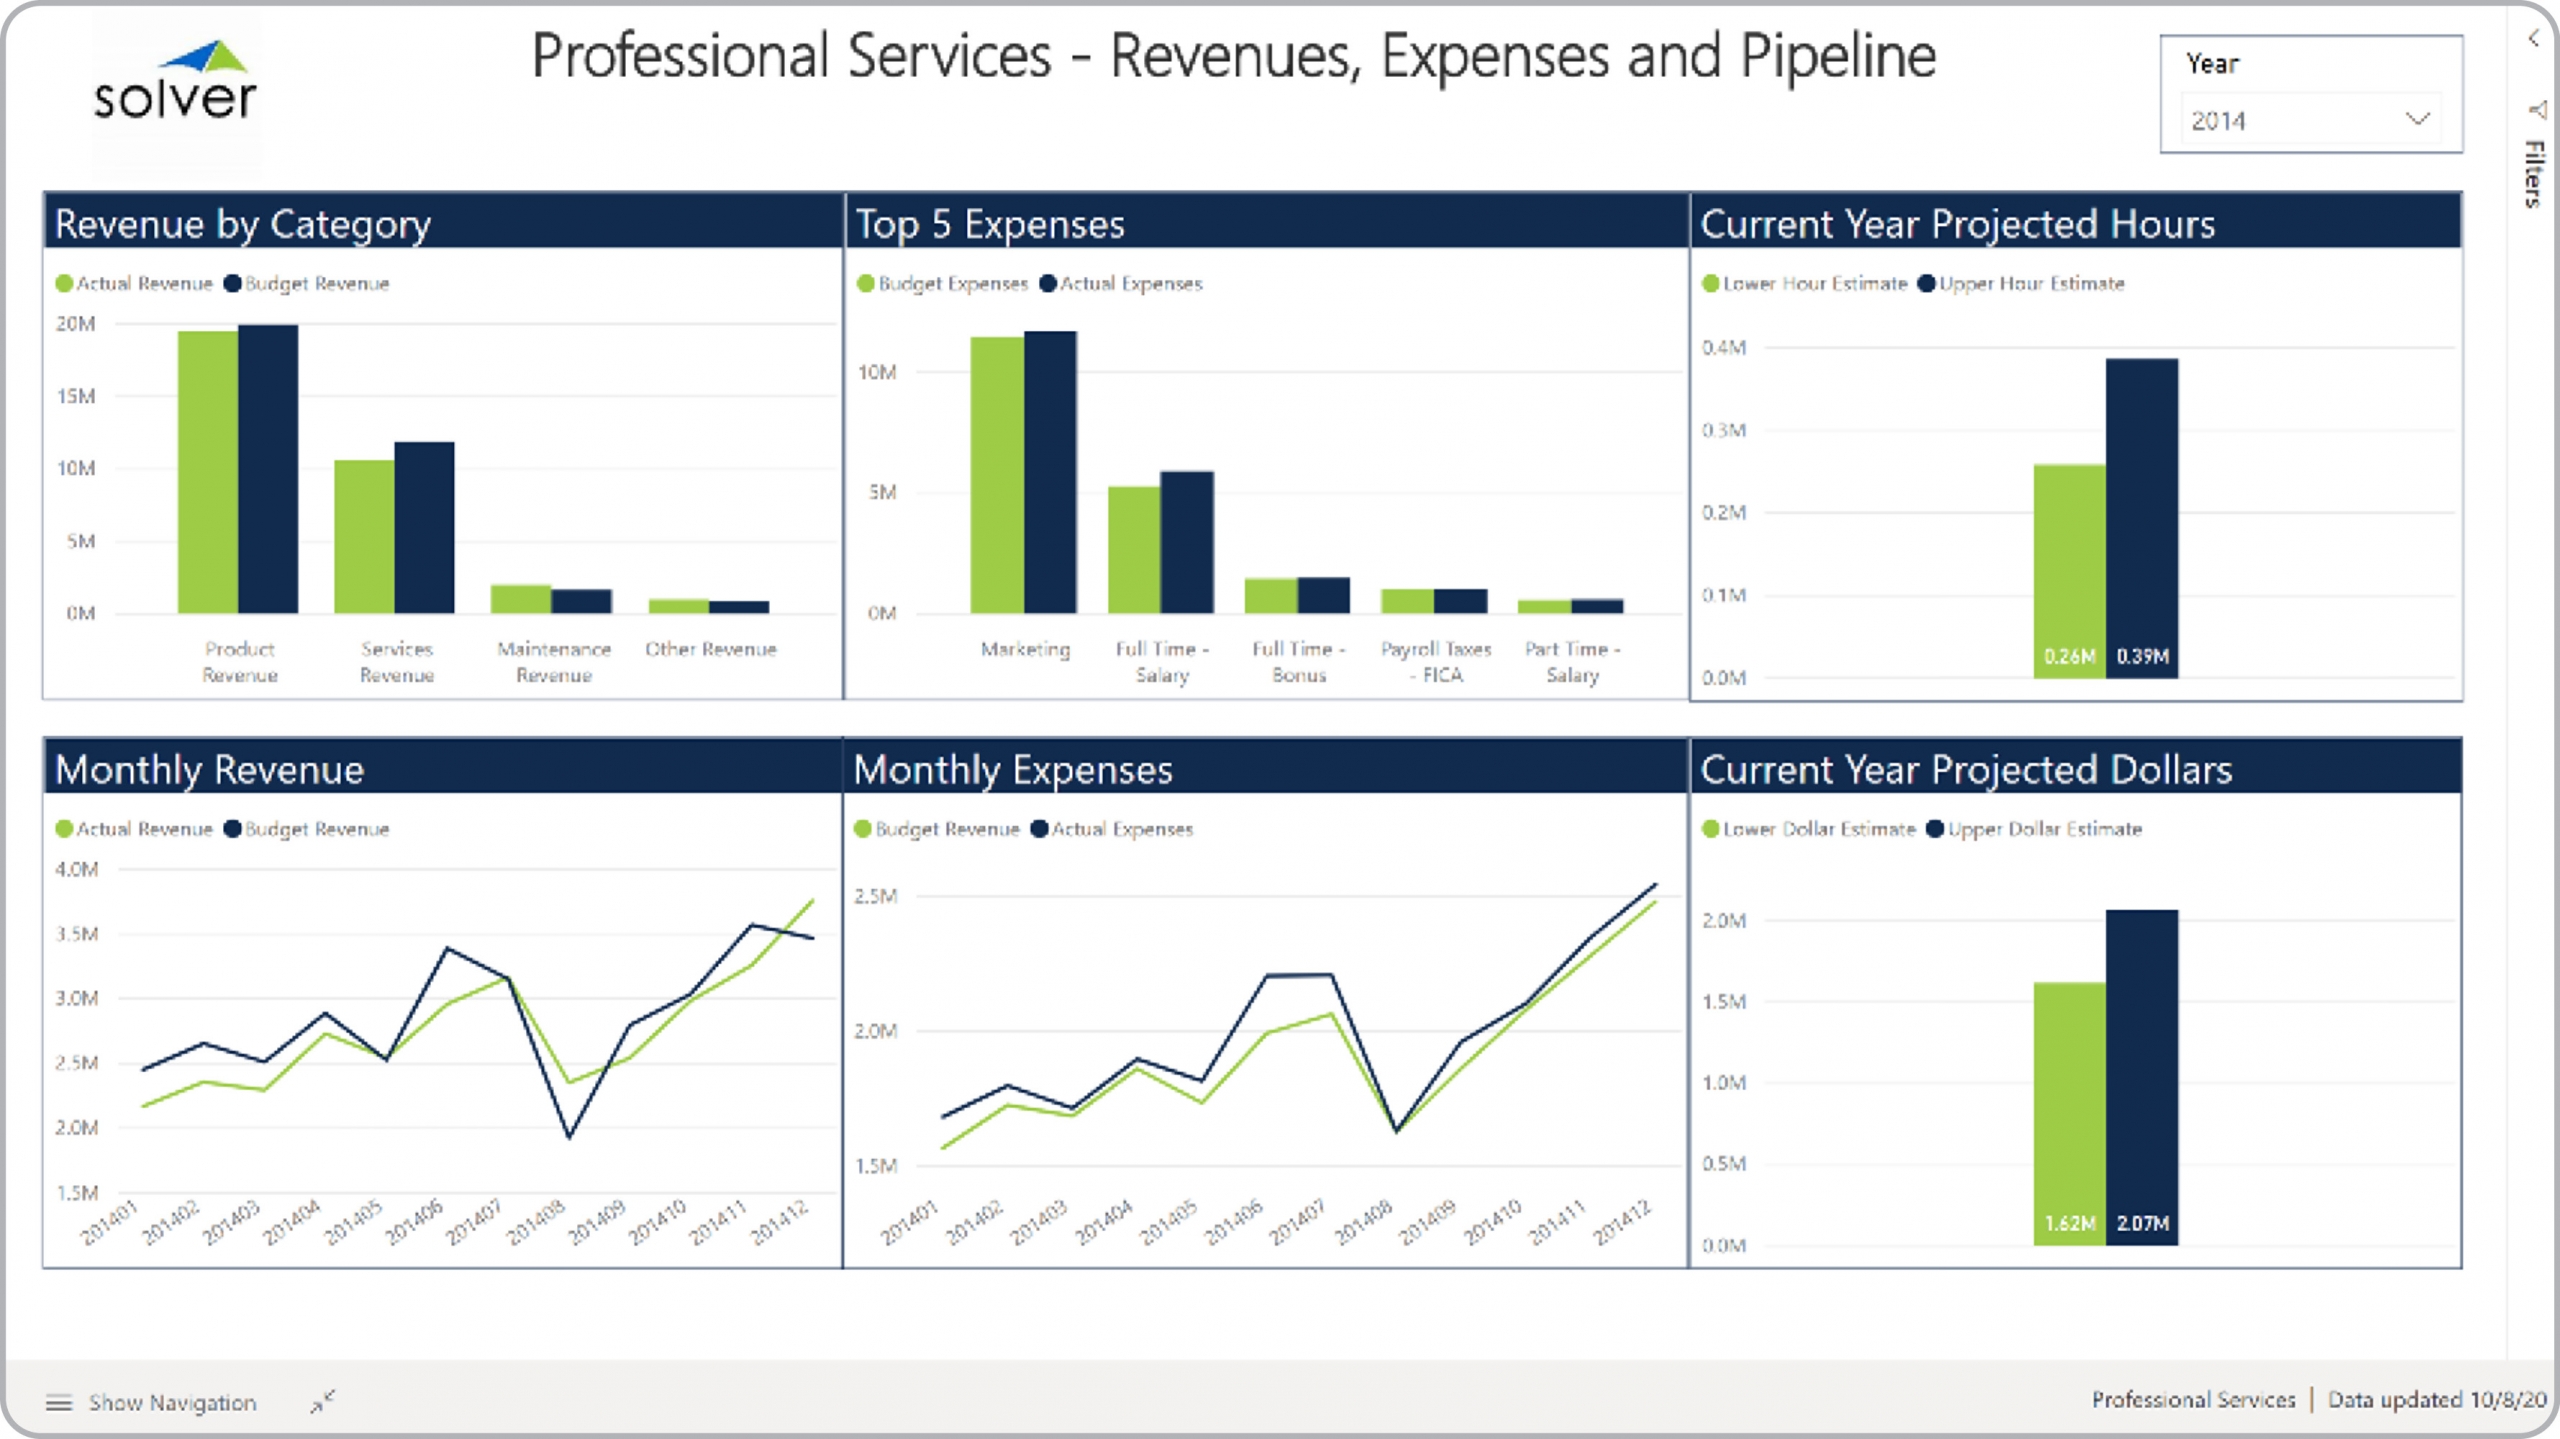
Revenue and Expense Dashboard for a Professional Services Company
What is a Revenue and Expense Dashboard ? Revenue and Expense Dashboards are considered financial ...
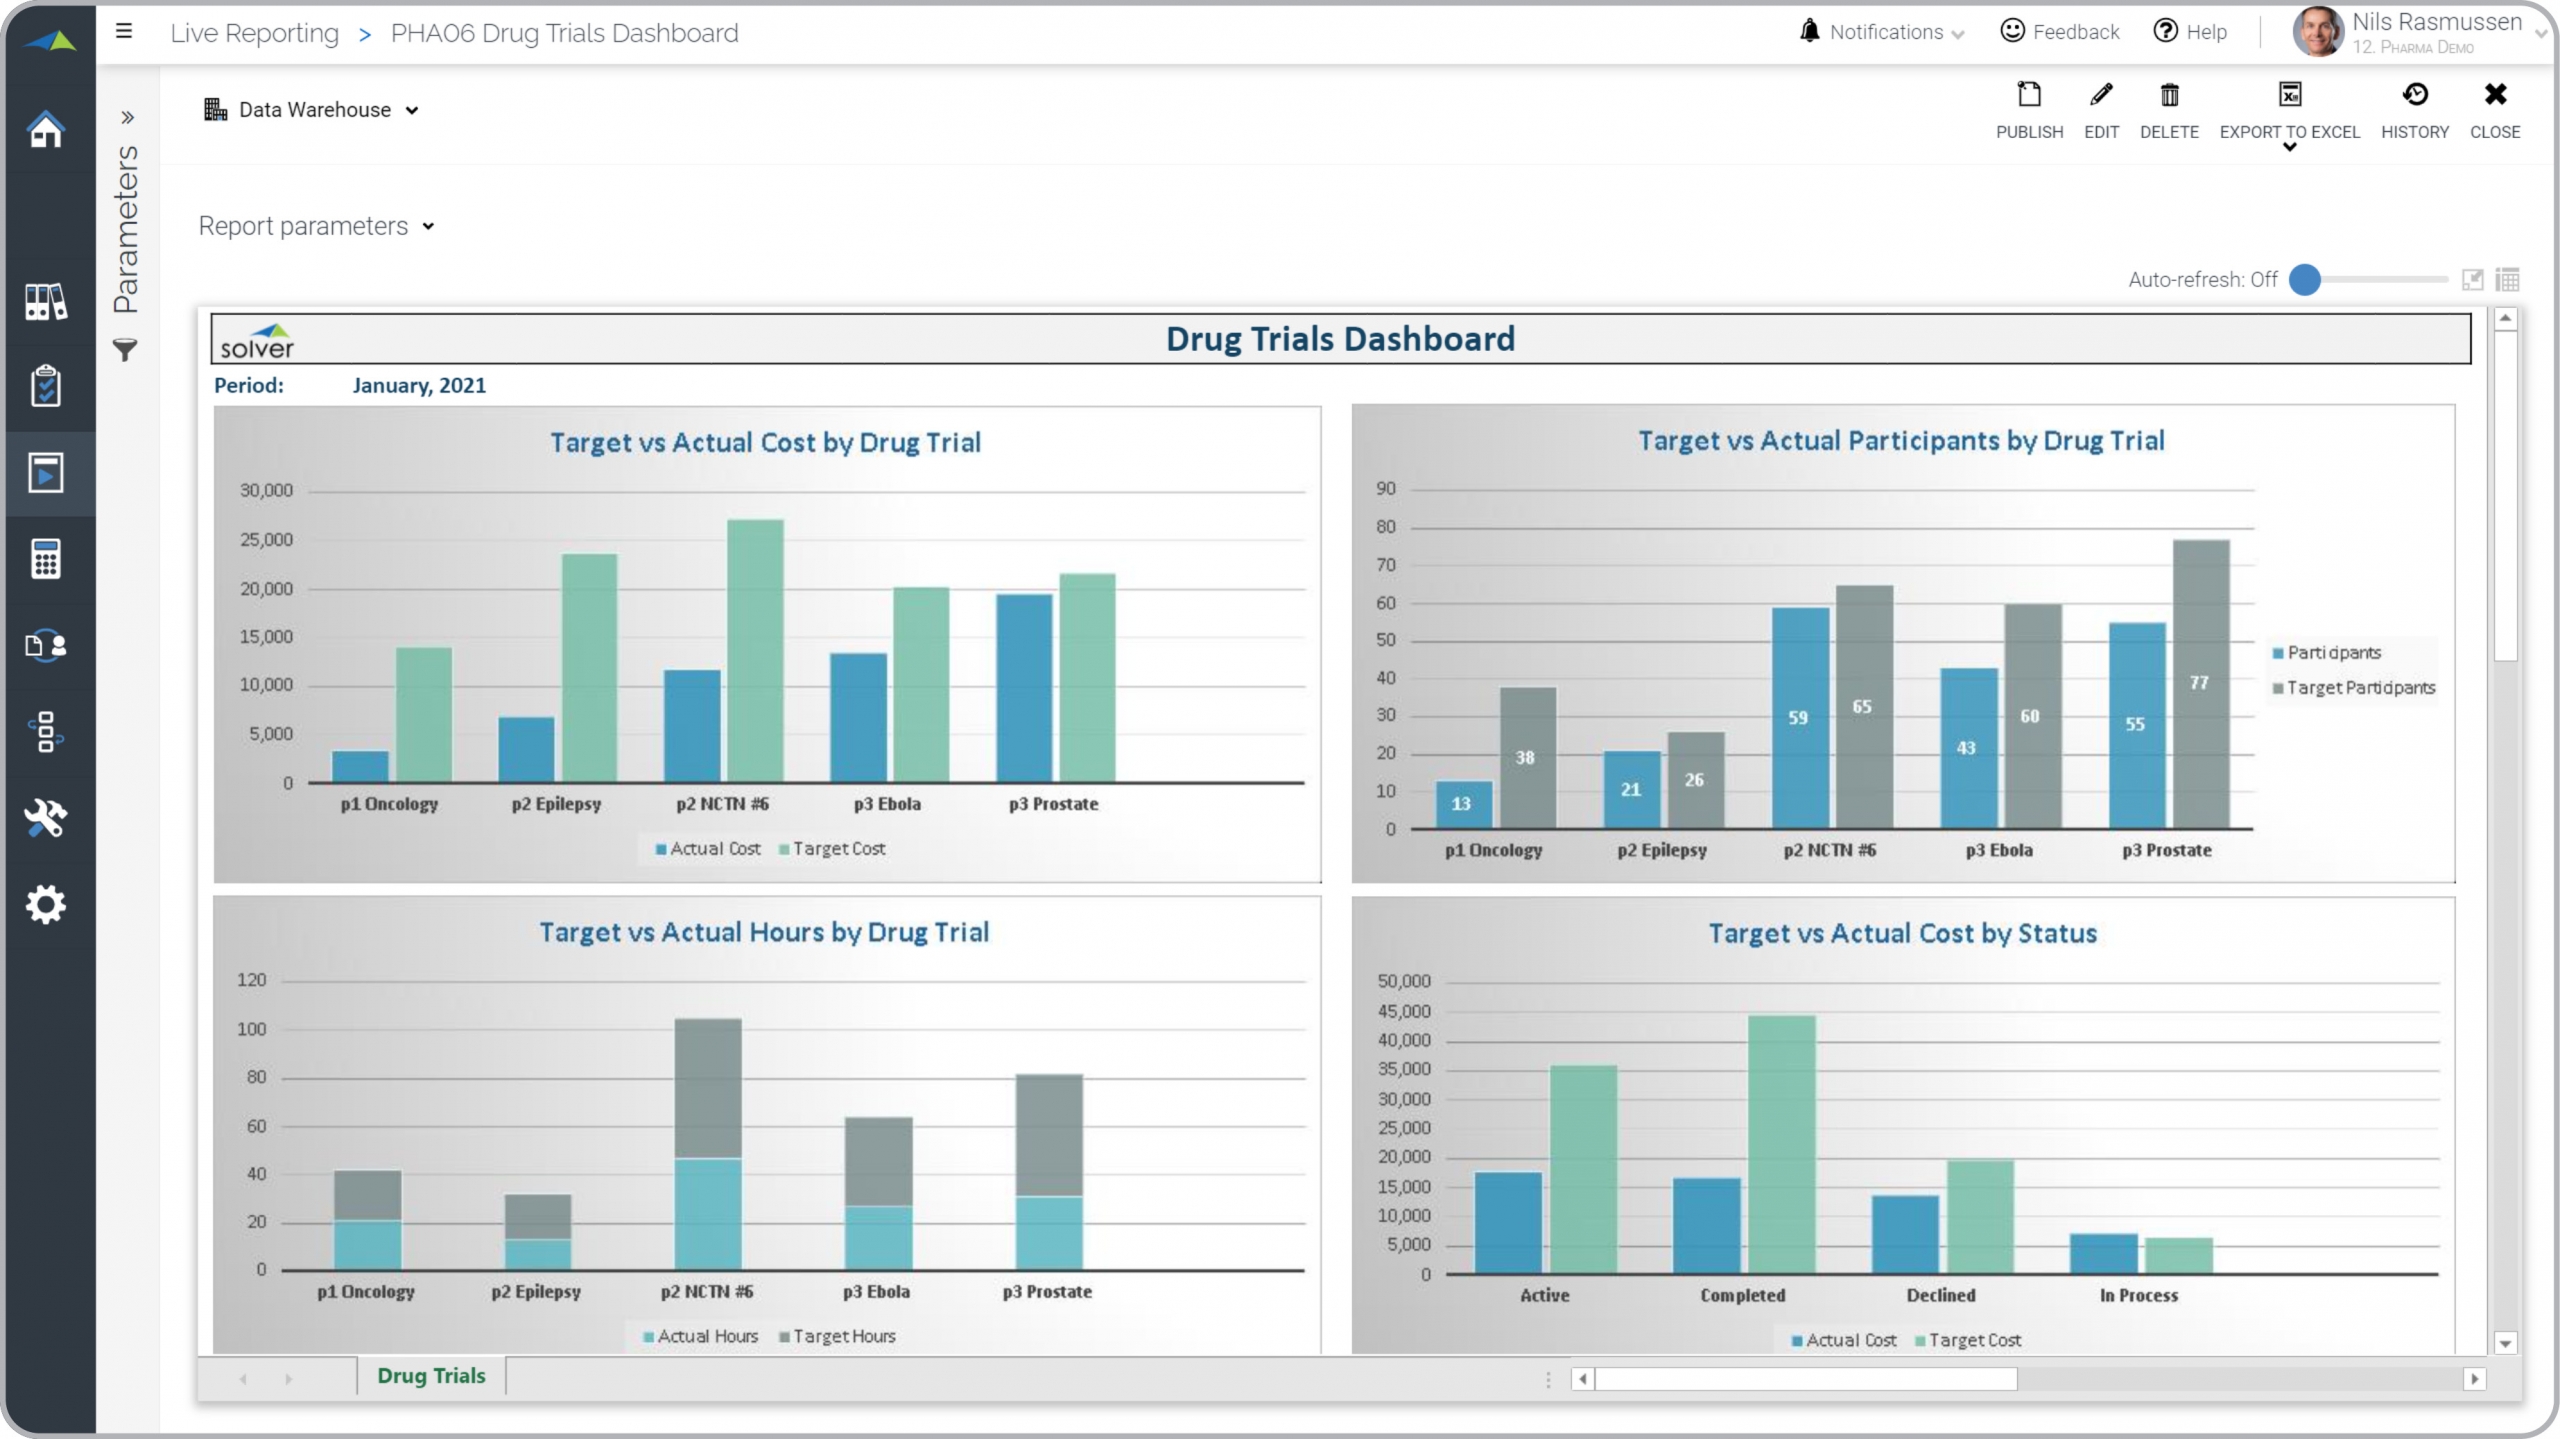
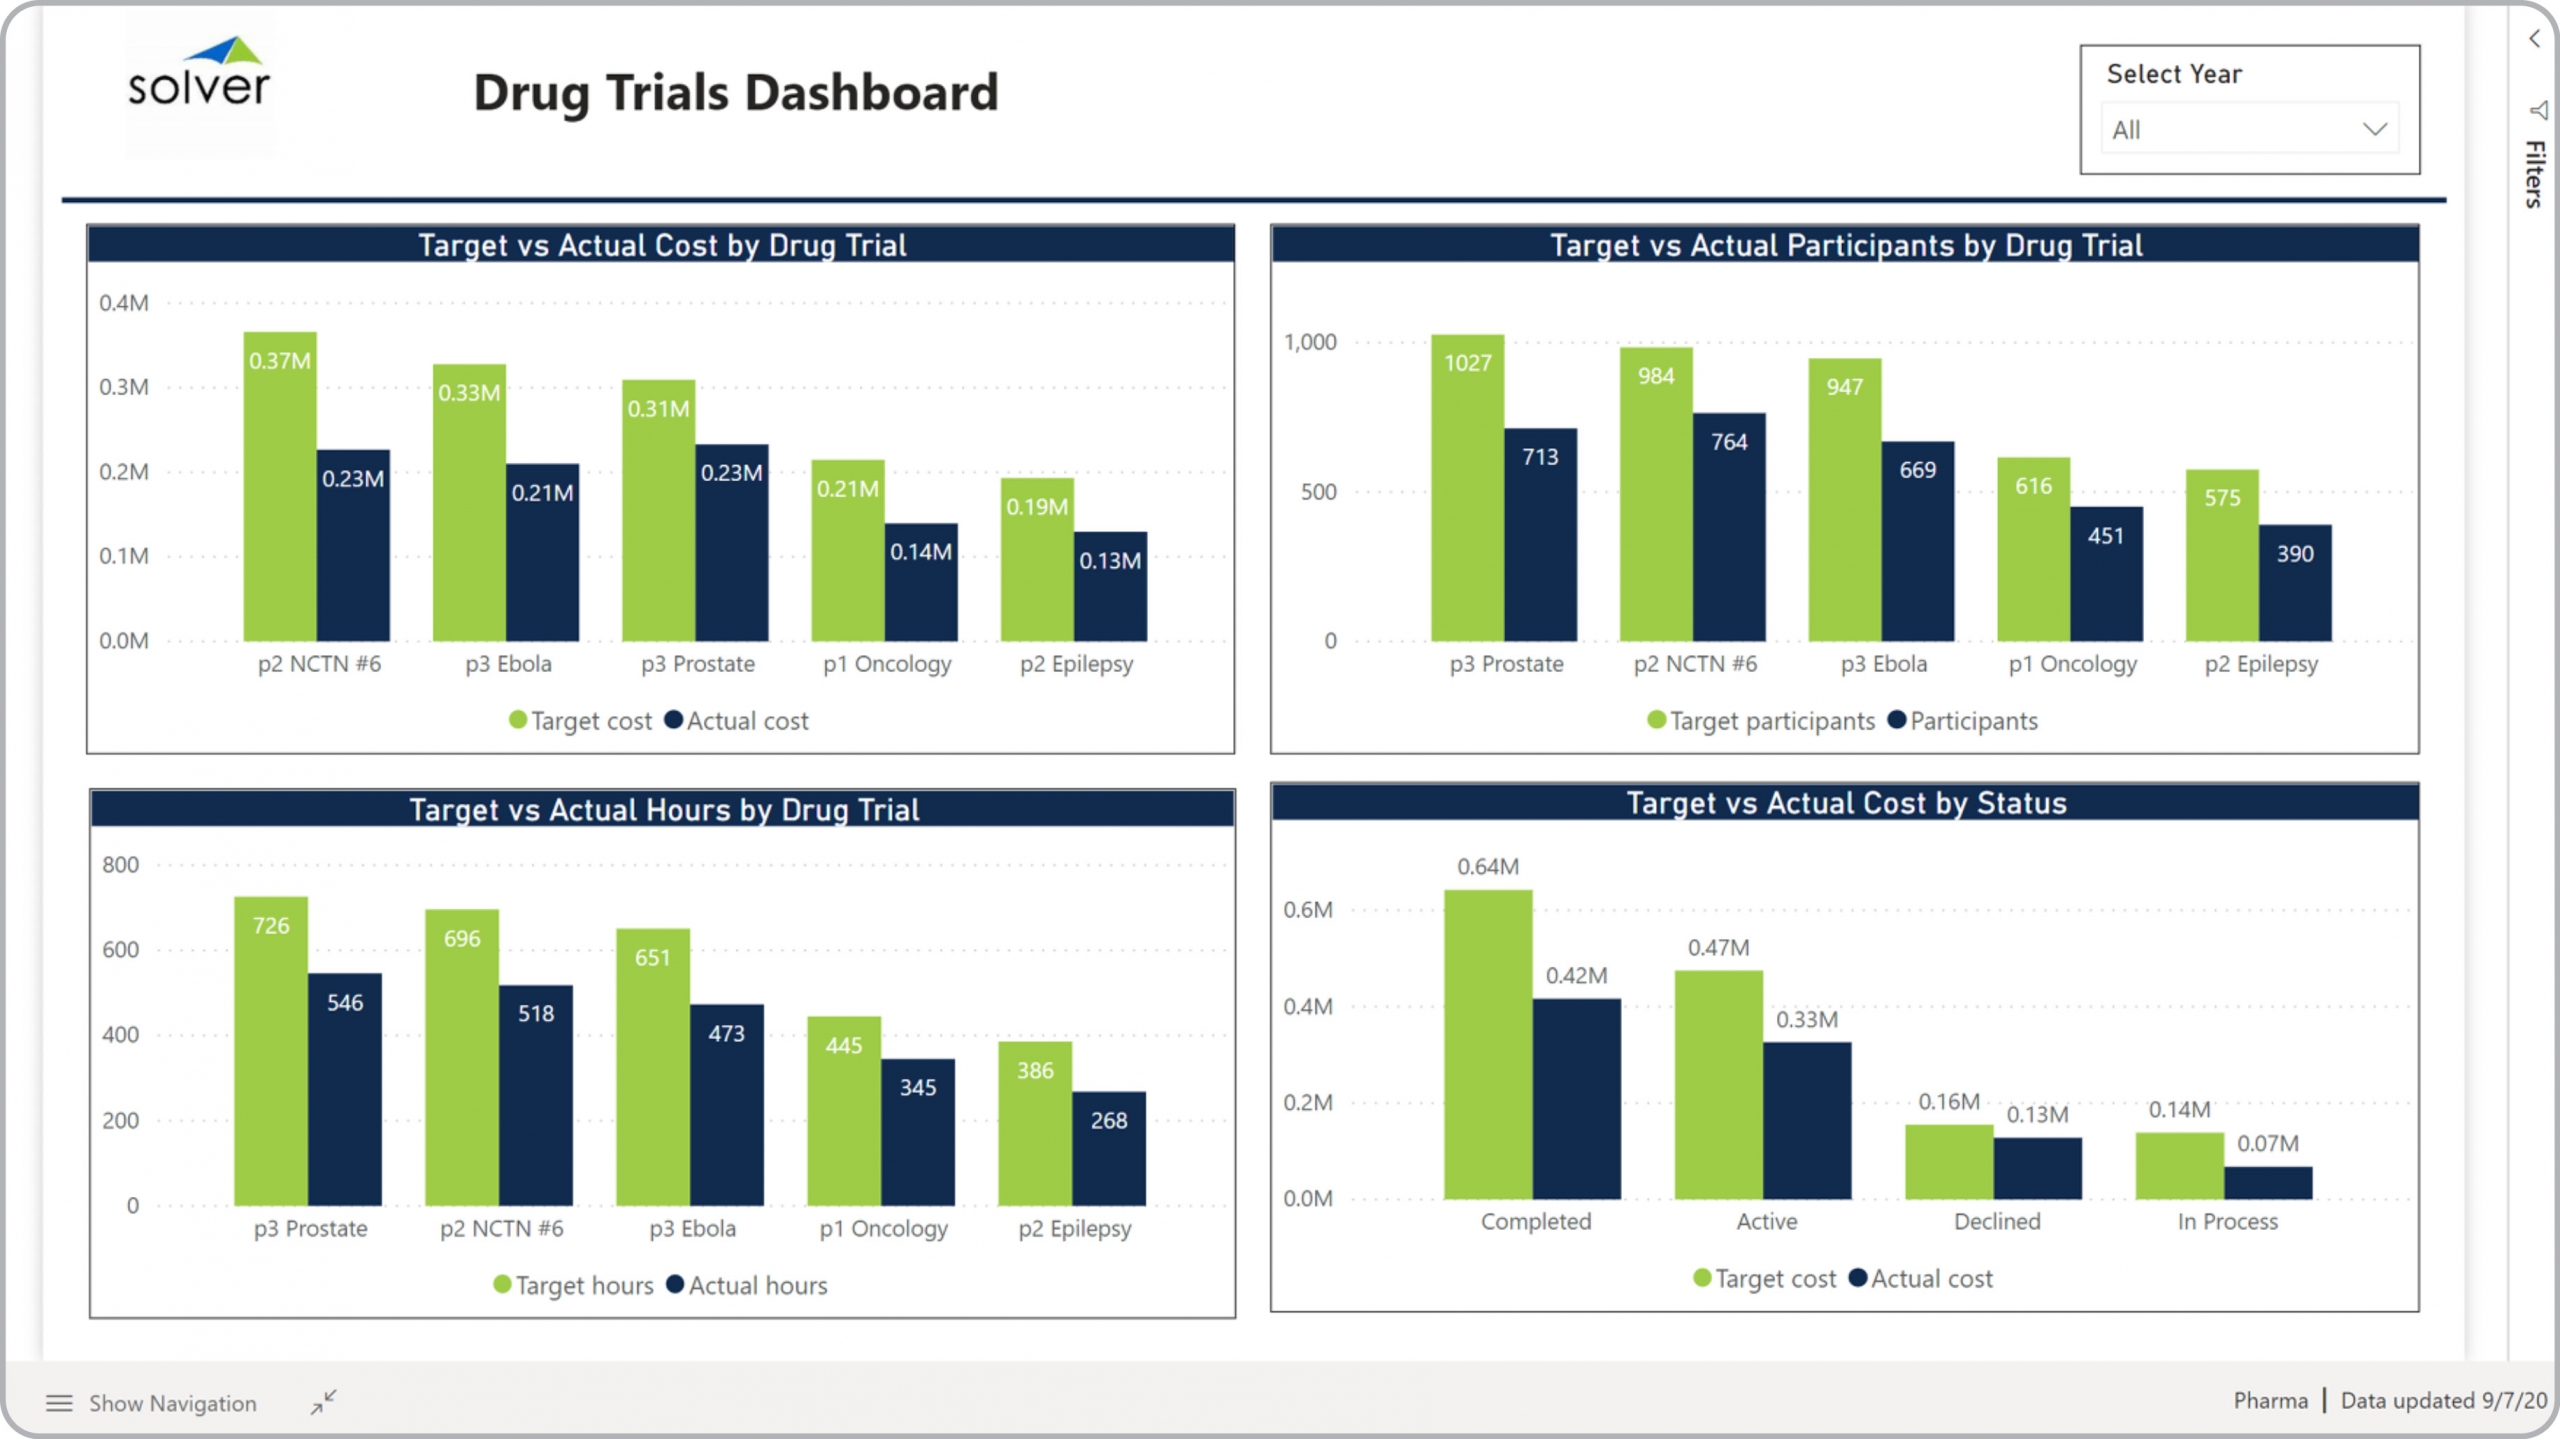
Clinical Trials Dashboard for Pharmaceutical Companies
What is a Clinical Trials Dashboard ? Clinical Trials Dashboards are considered program analysis ...
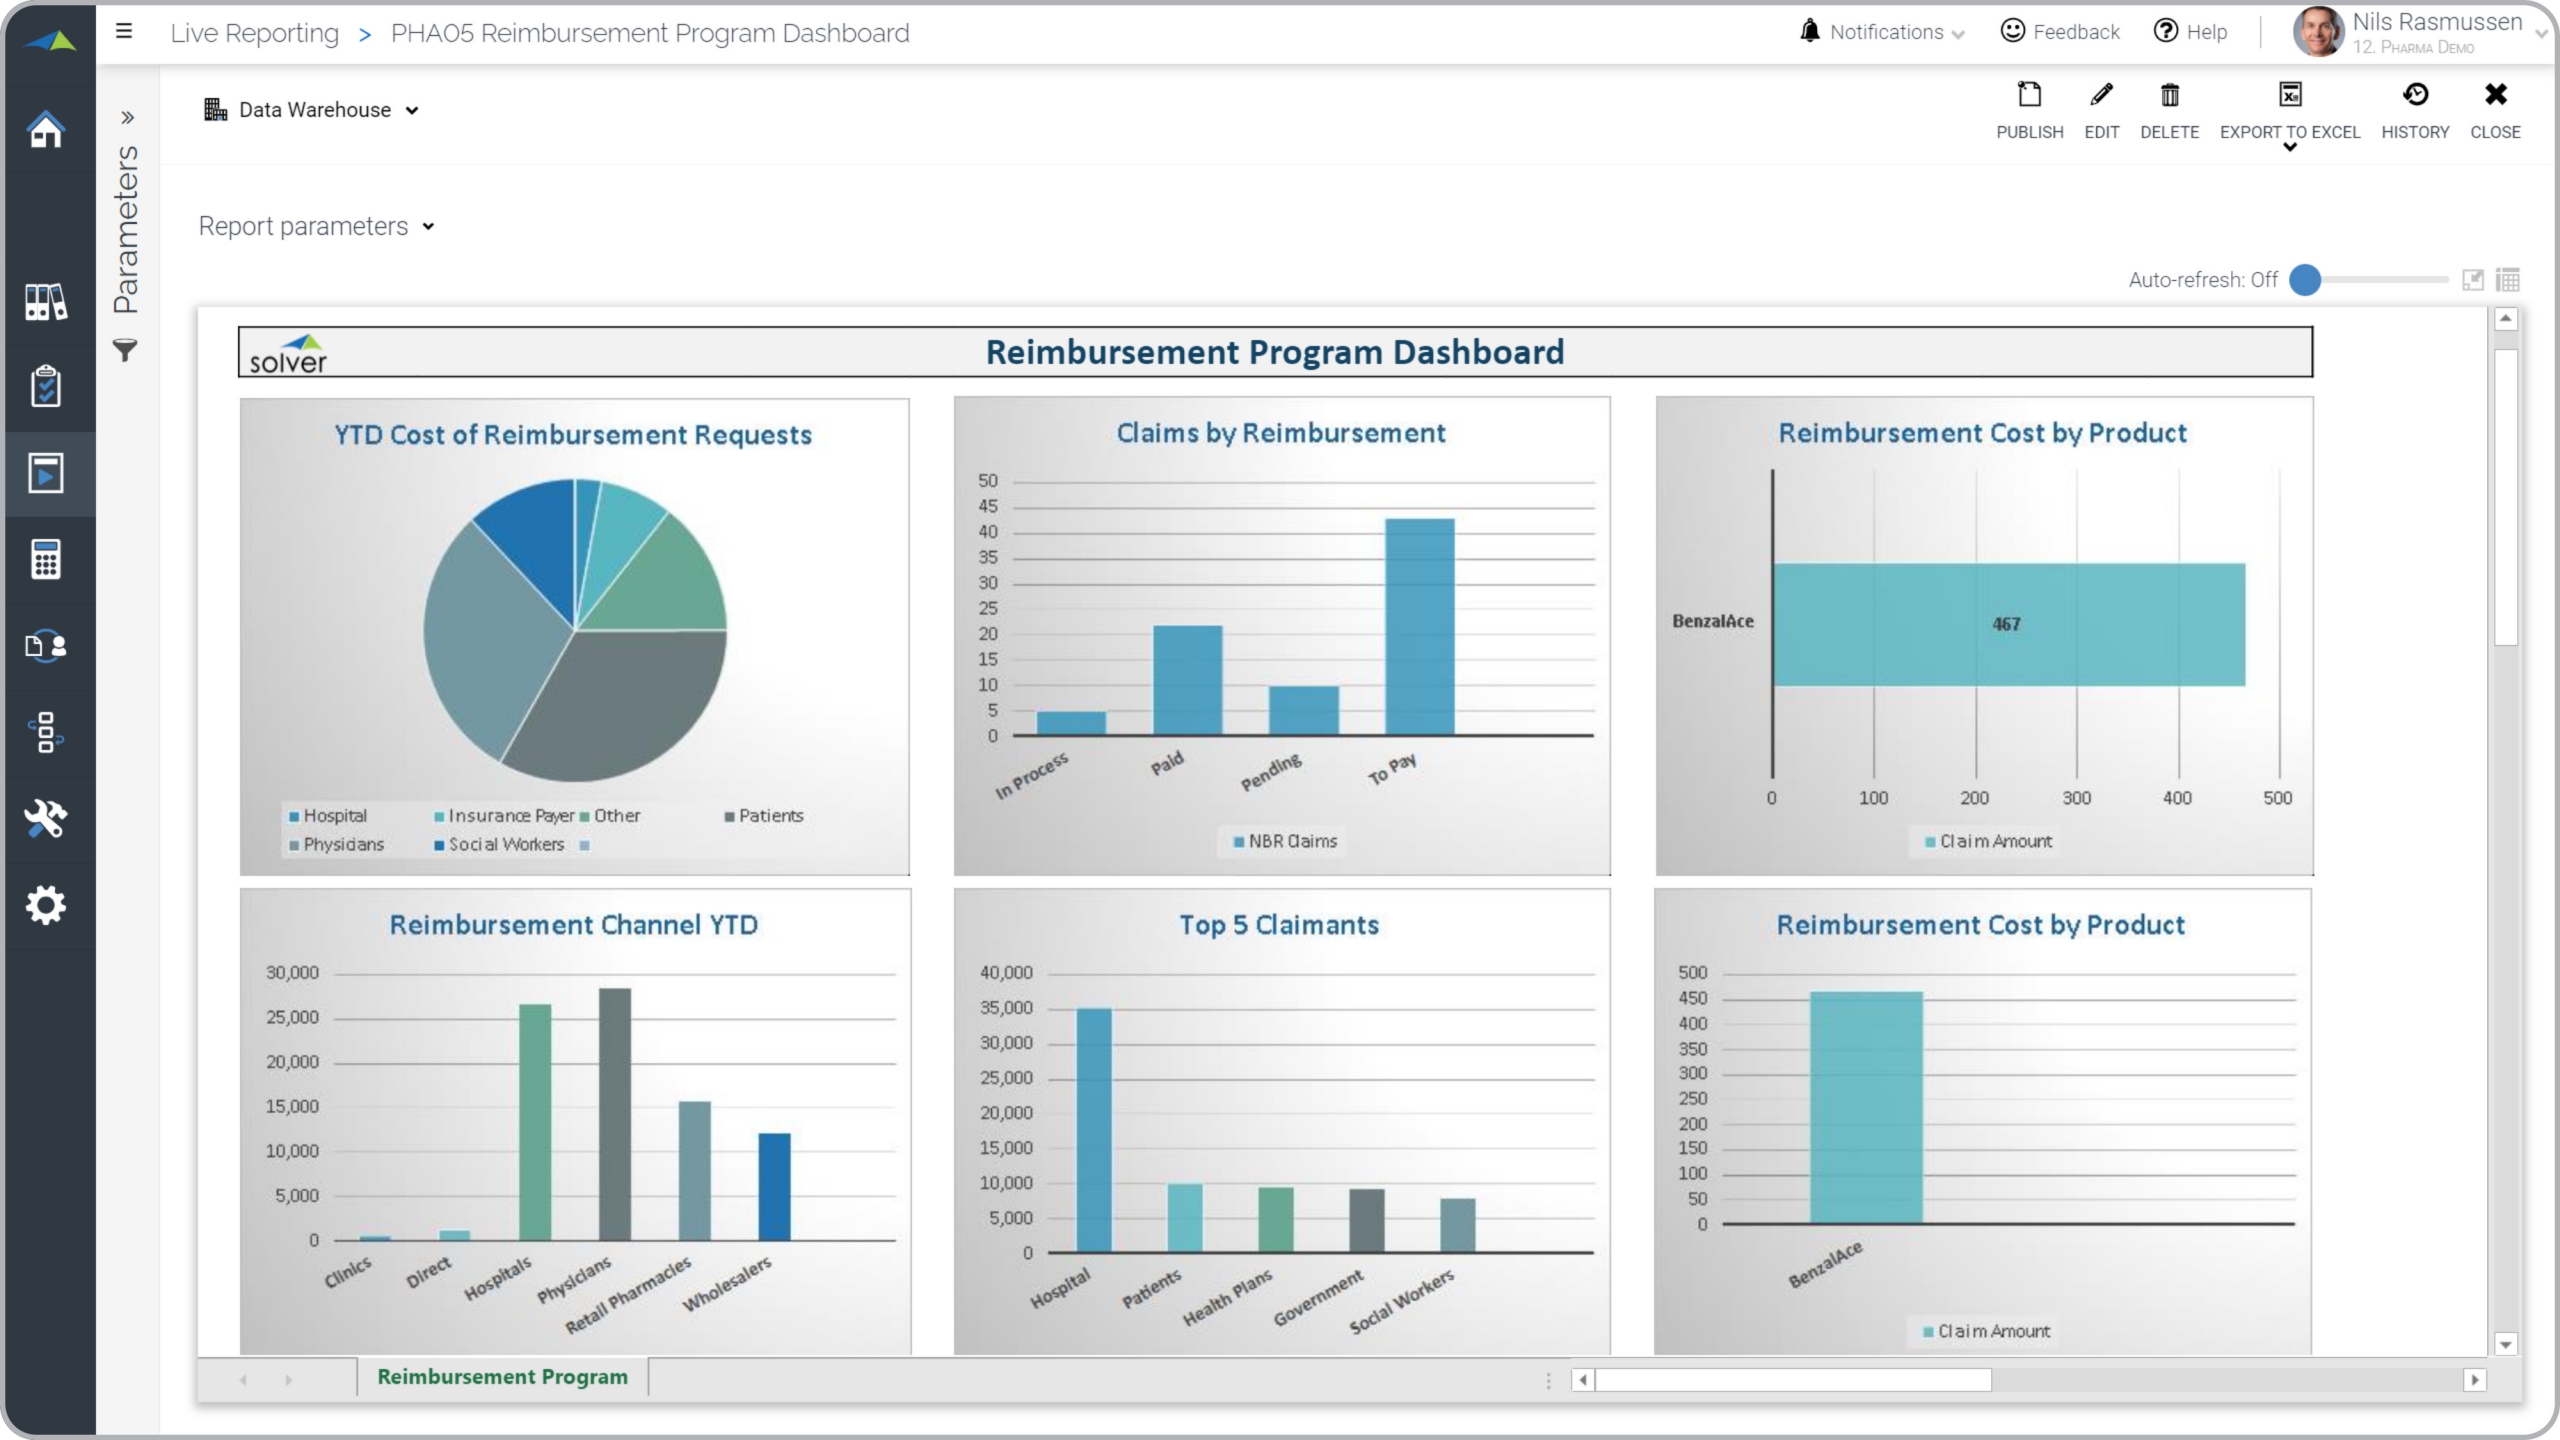
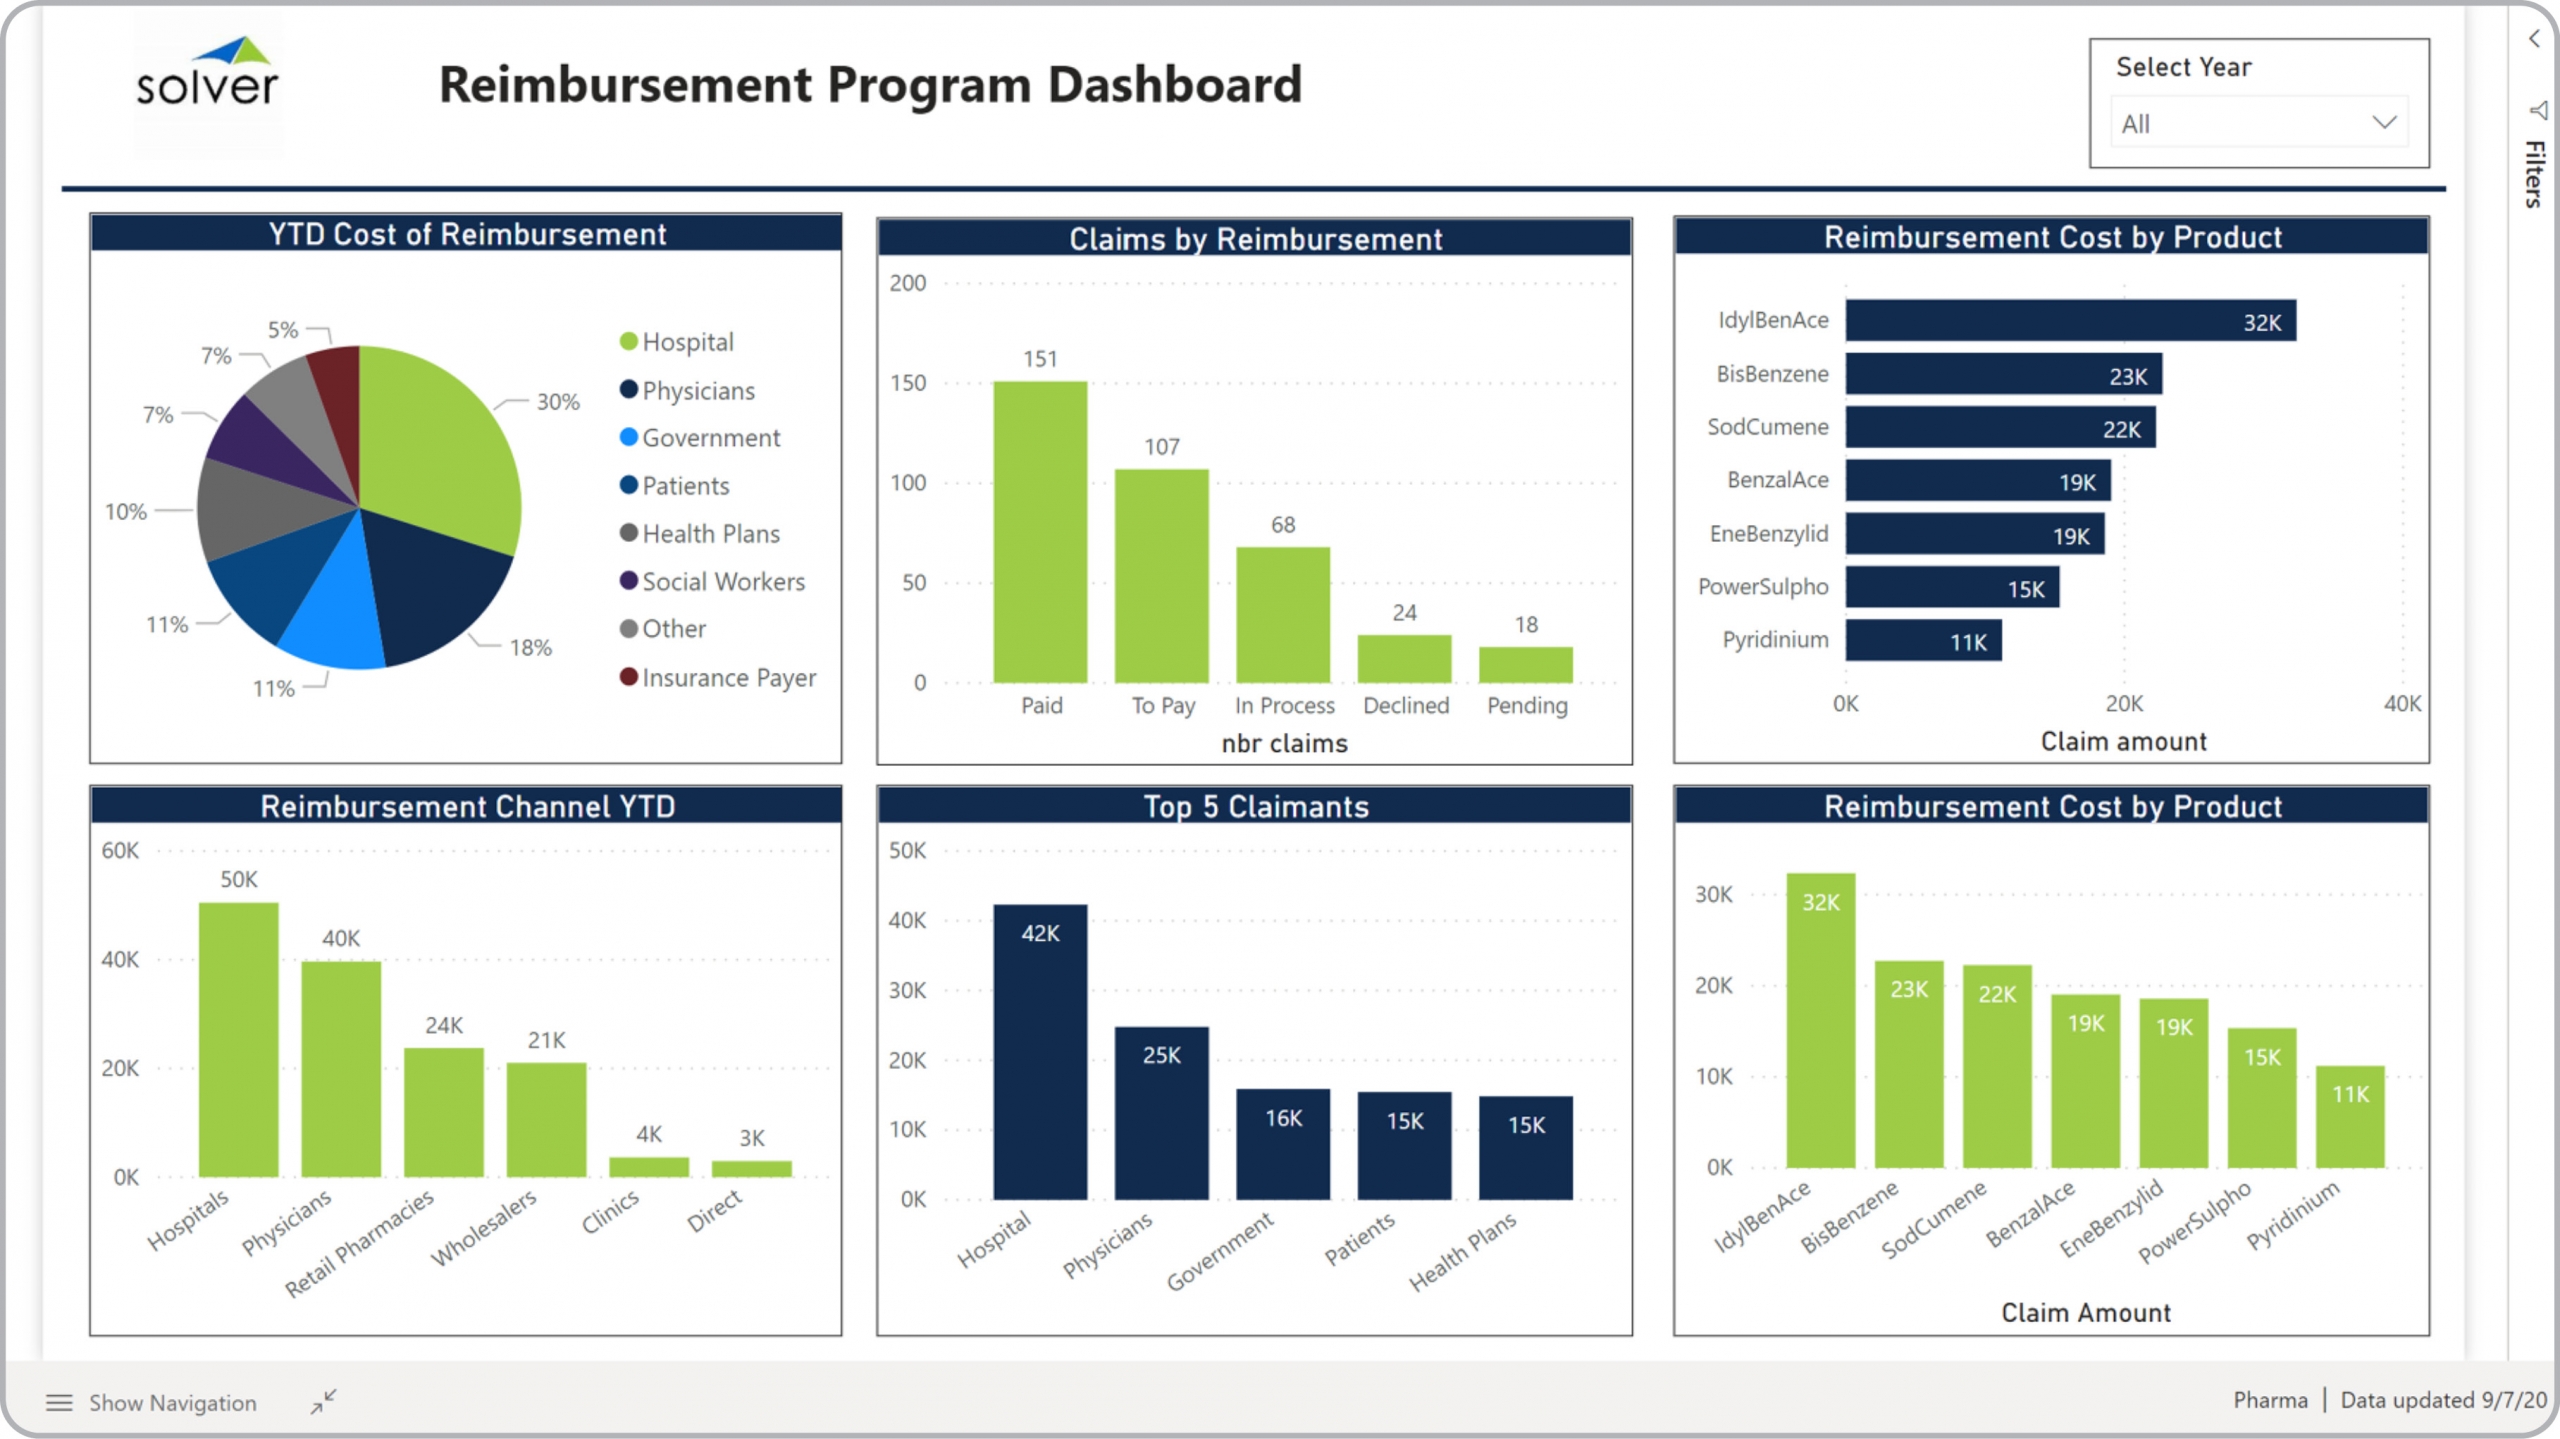
Reimbursement Program Dashboard for Pharmaceutical Companies
What is a Reimbursement Program Dashboard ? Reimbursement Program Dashboards are considered patient ...
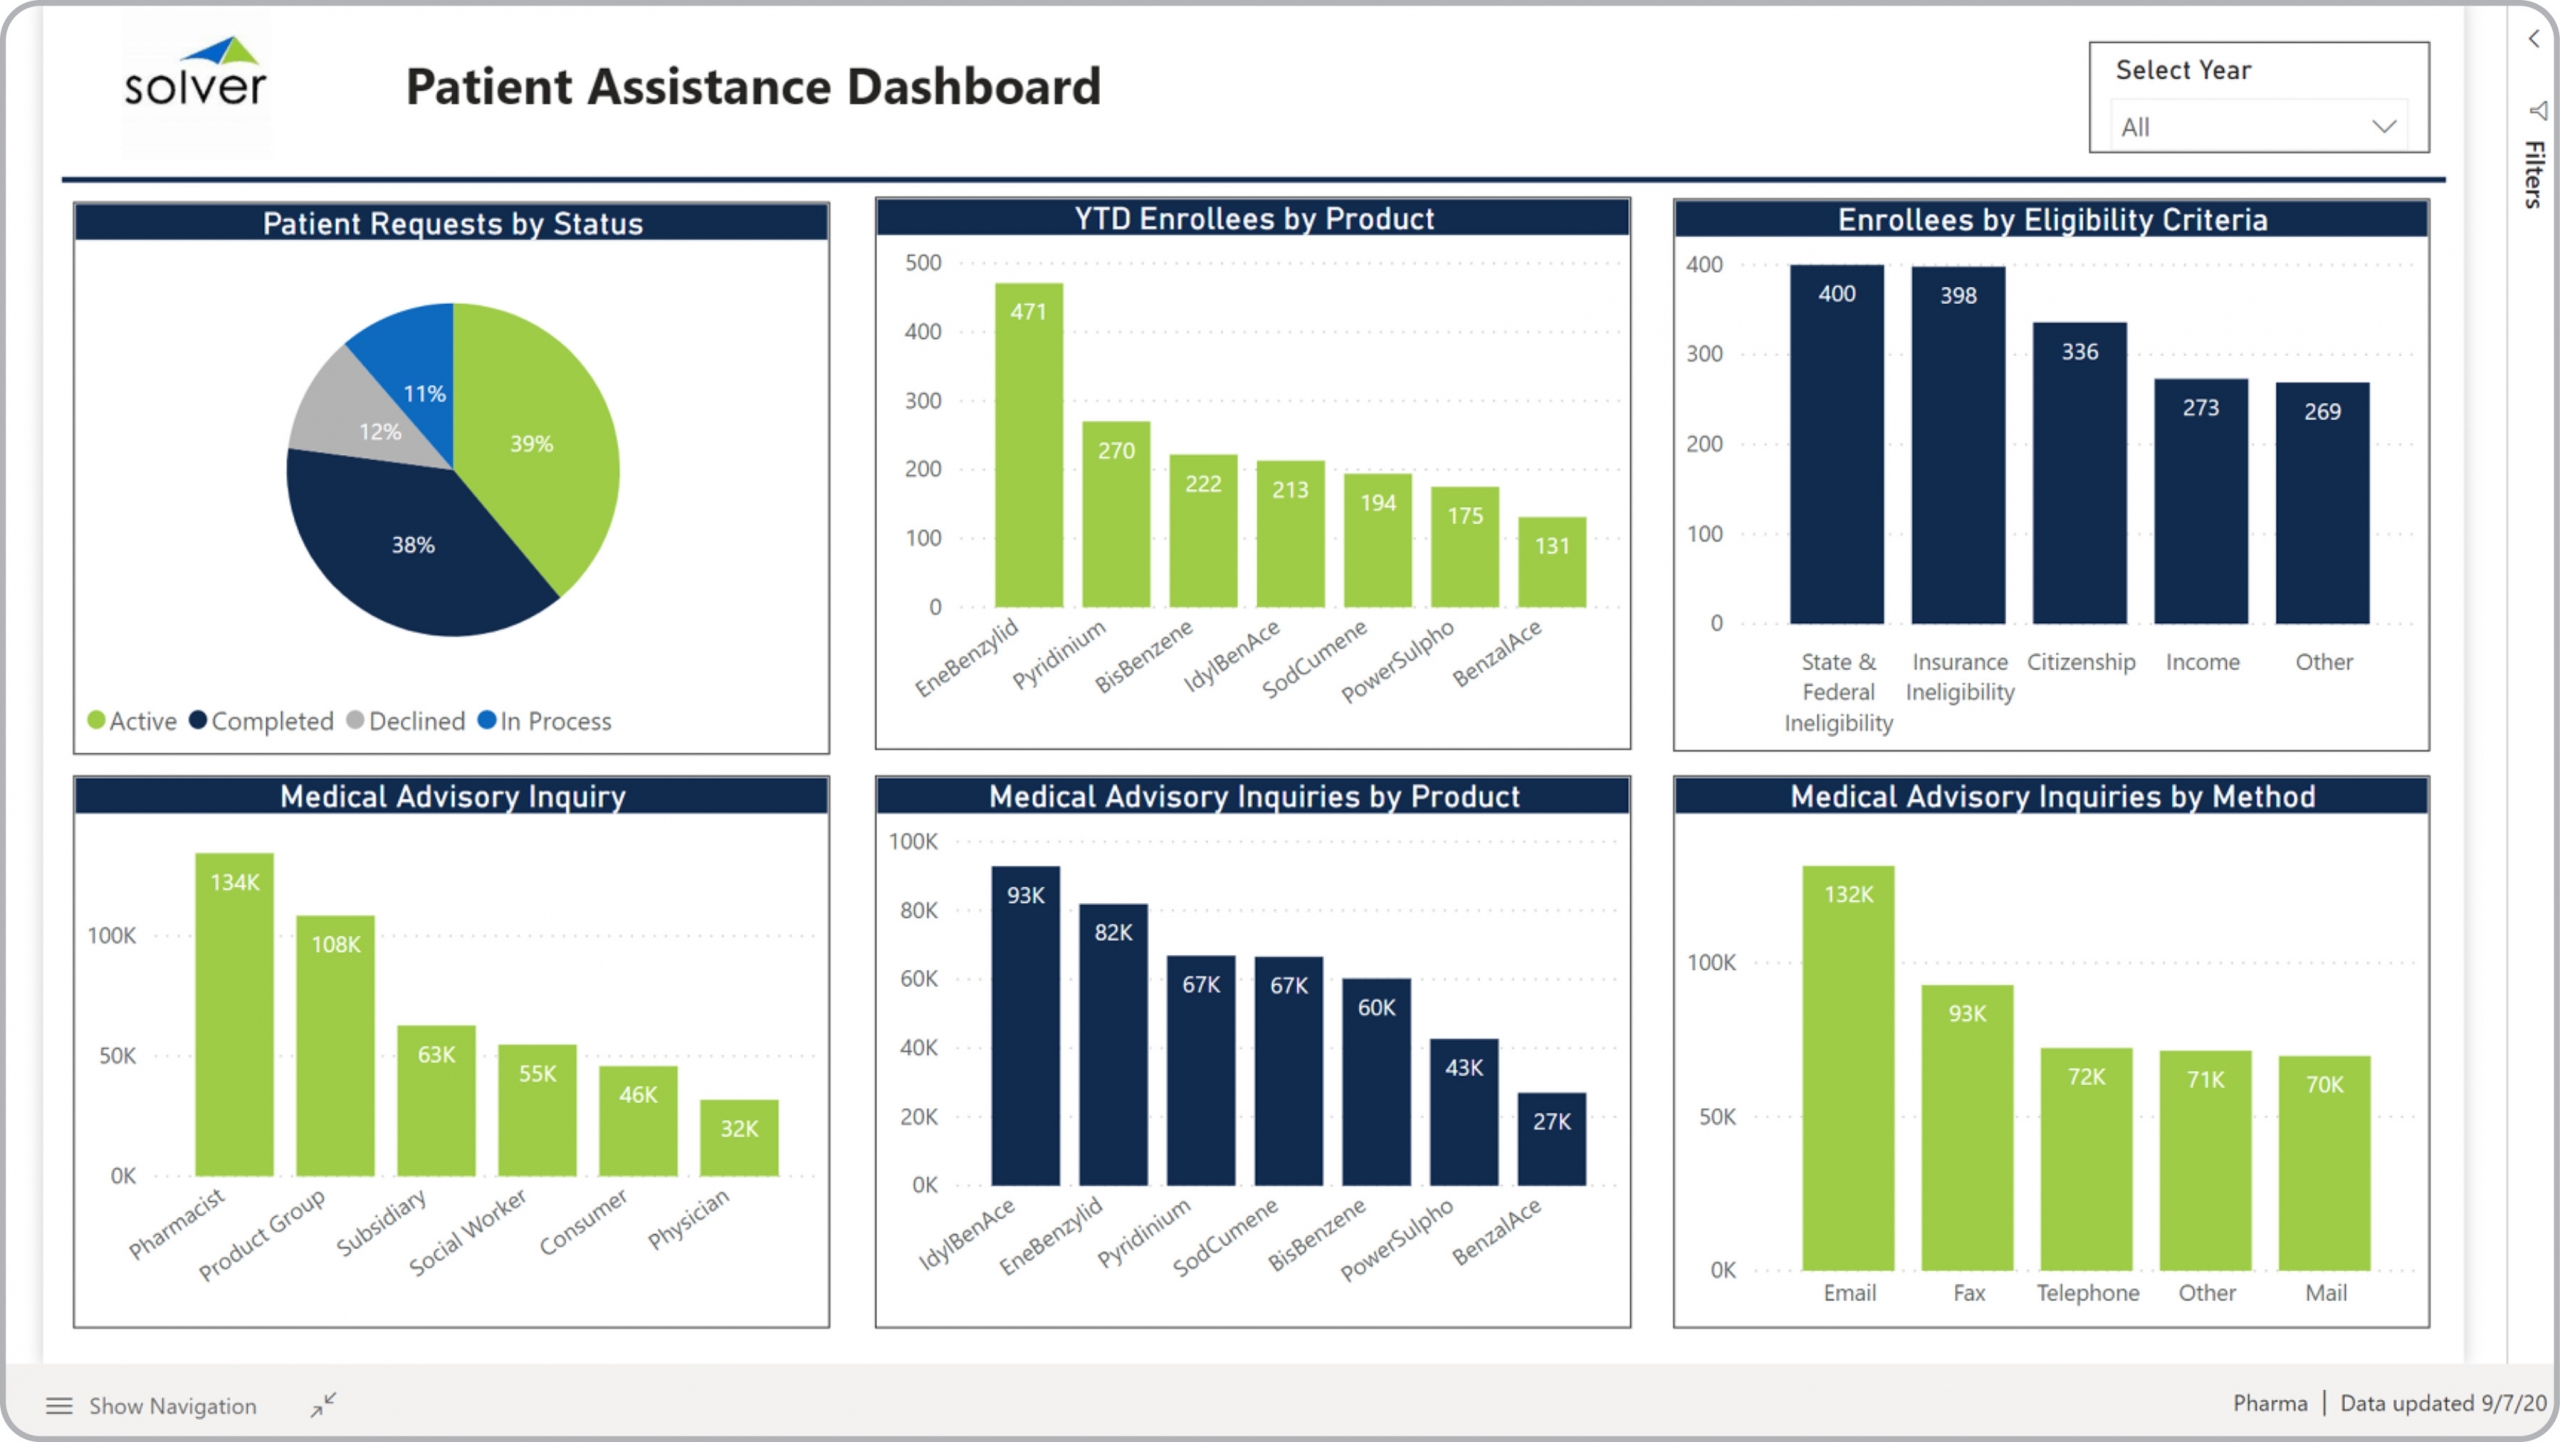
Patient Assistance Dashboard for Pharmaceutical Companies
What is a Patient Assistance Dashboard ? Patient Assistant Dashboards are considered program ...
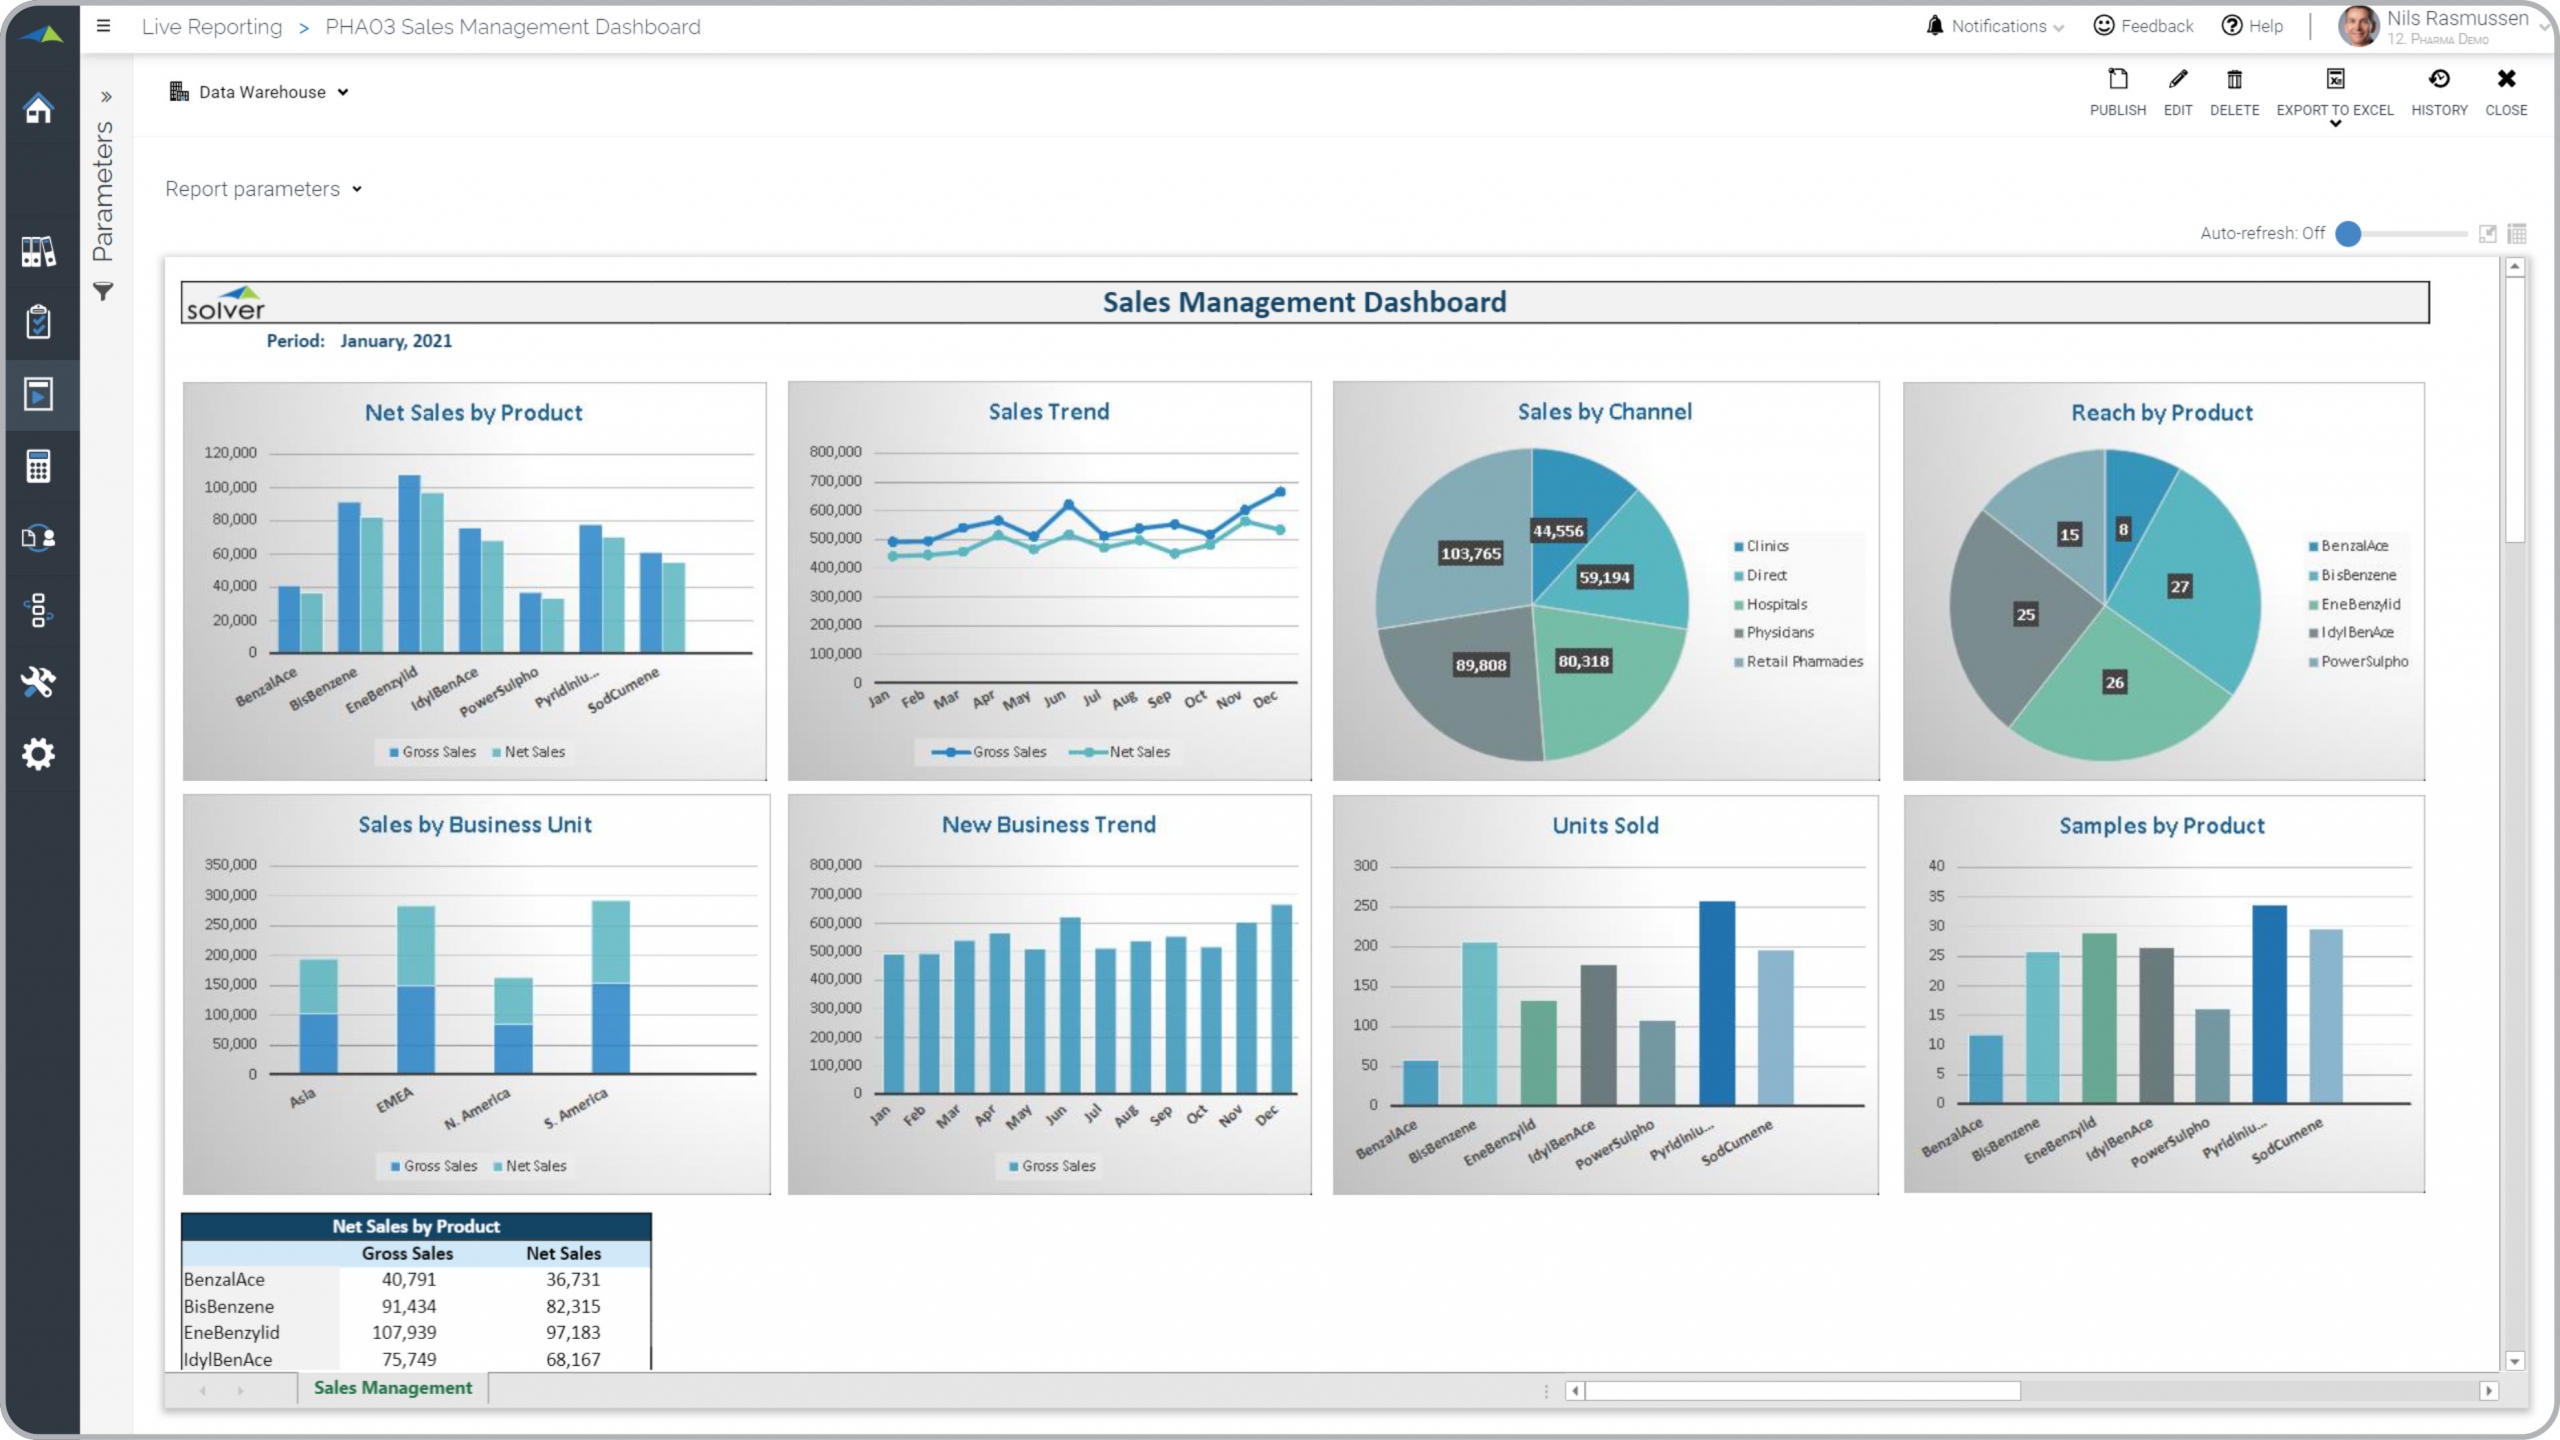
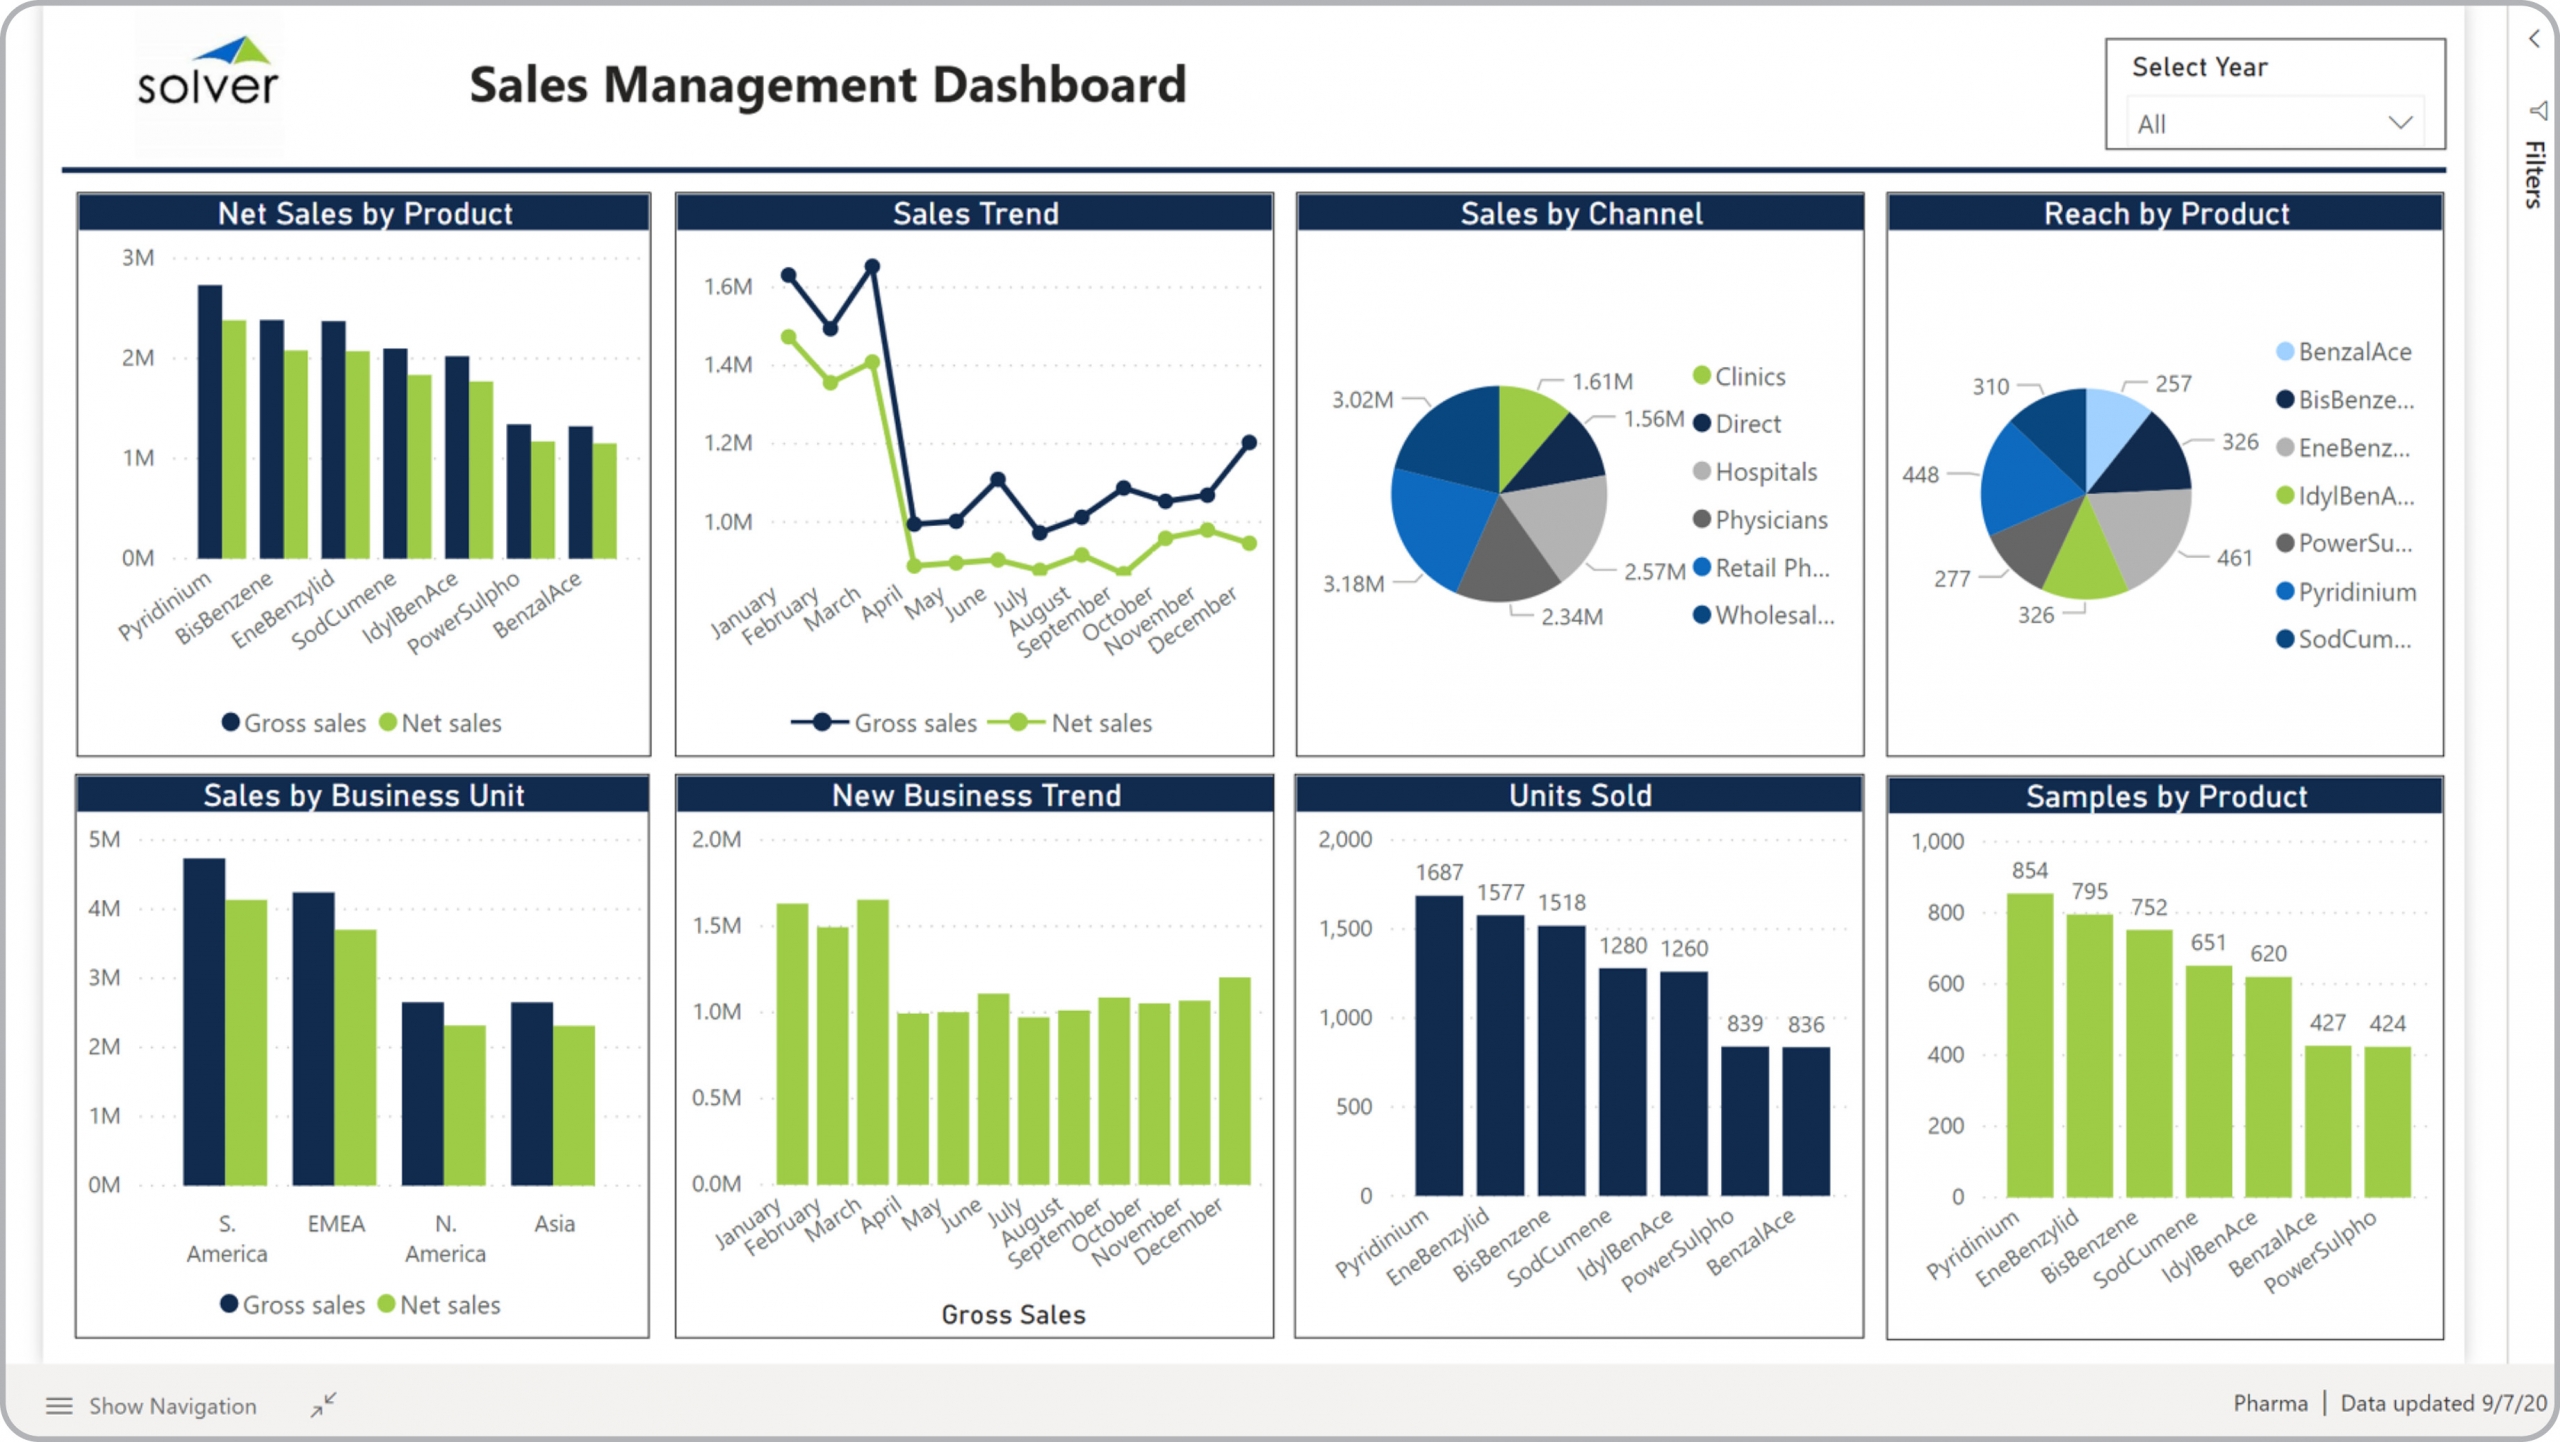
Sales Manager Dashboard for Pharmaceutical Companies
What is a Sales Manager Dashboard ? Sales Manager Dashboards are considered revenue analysis tools ...
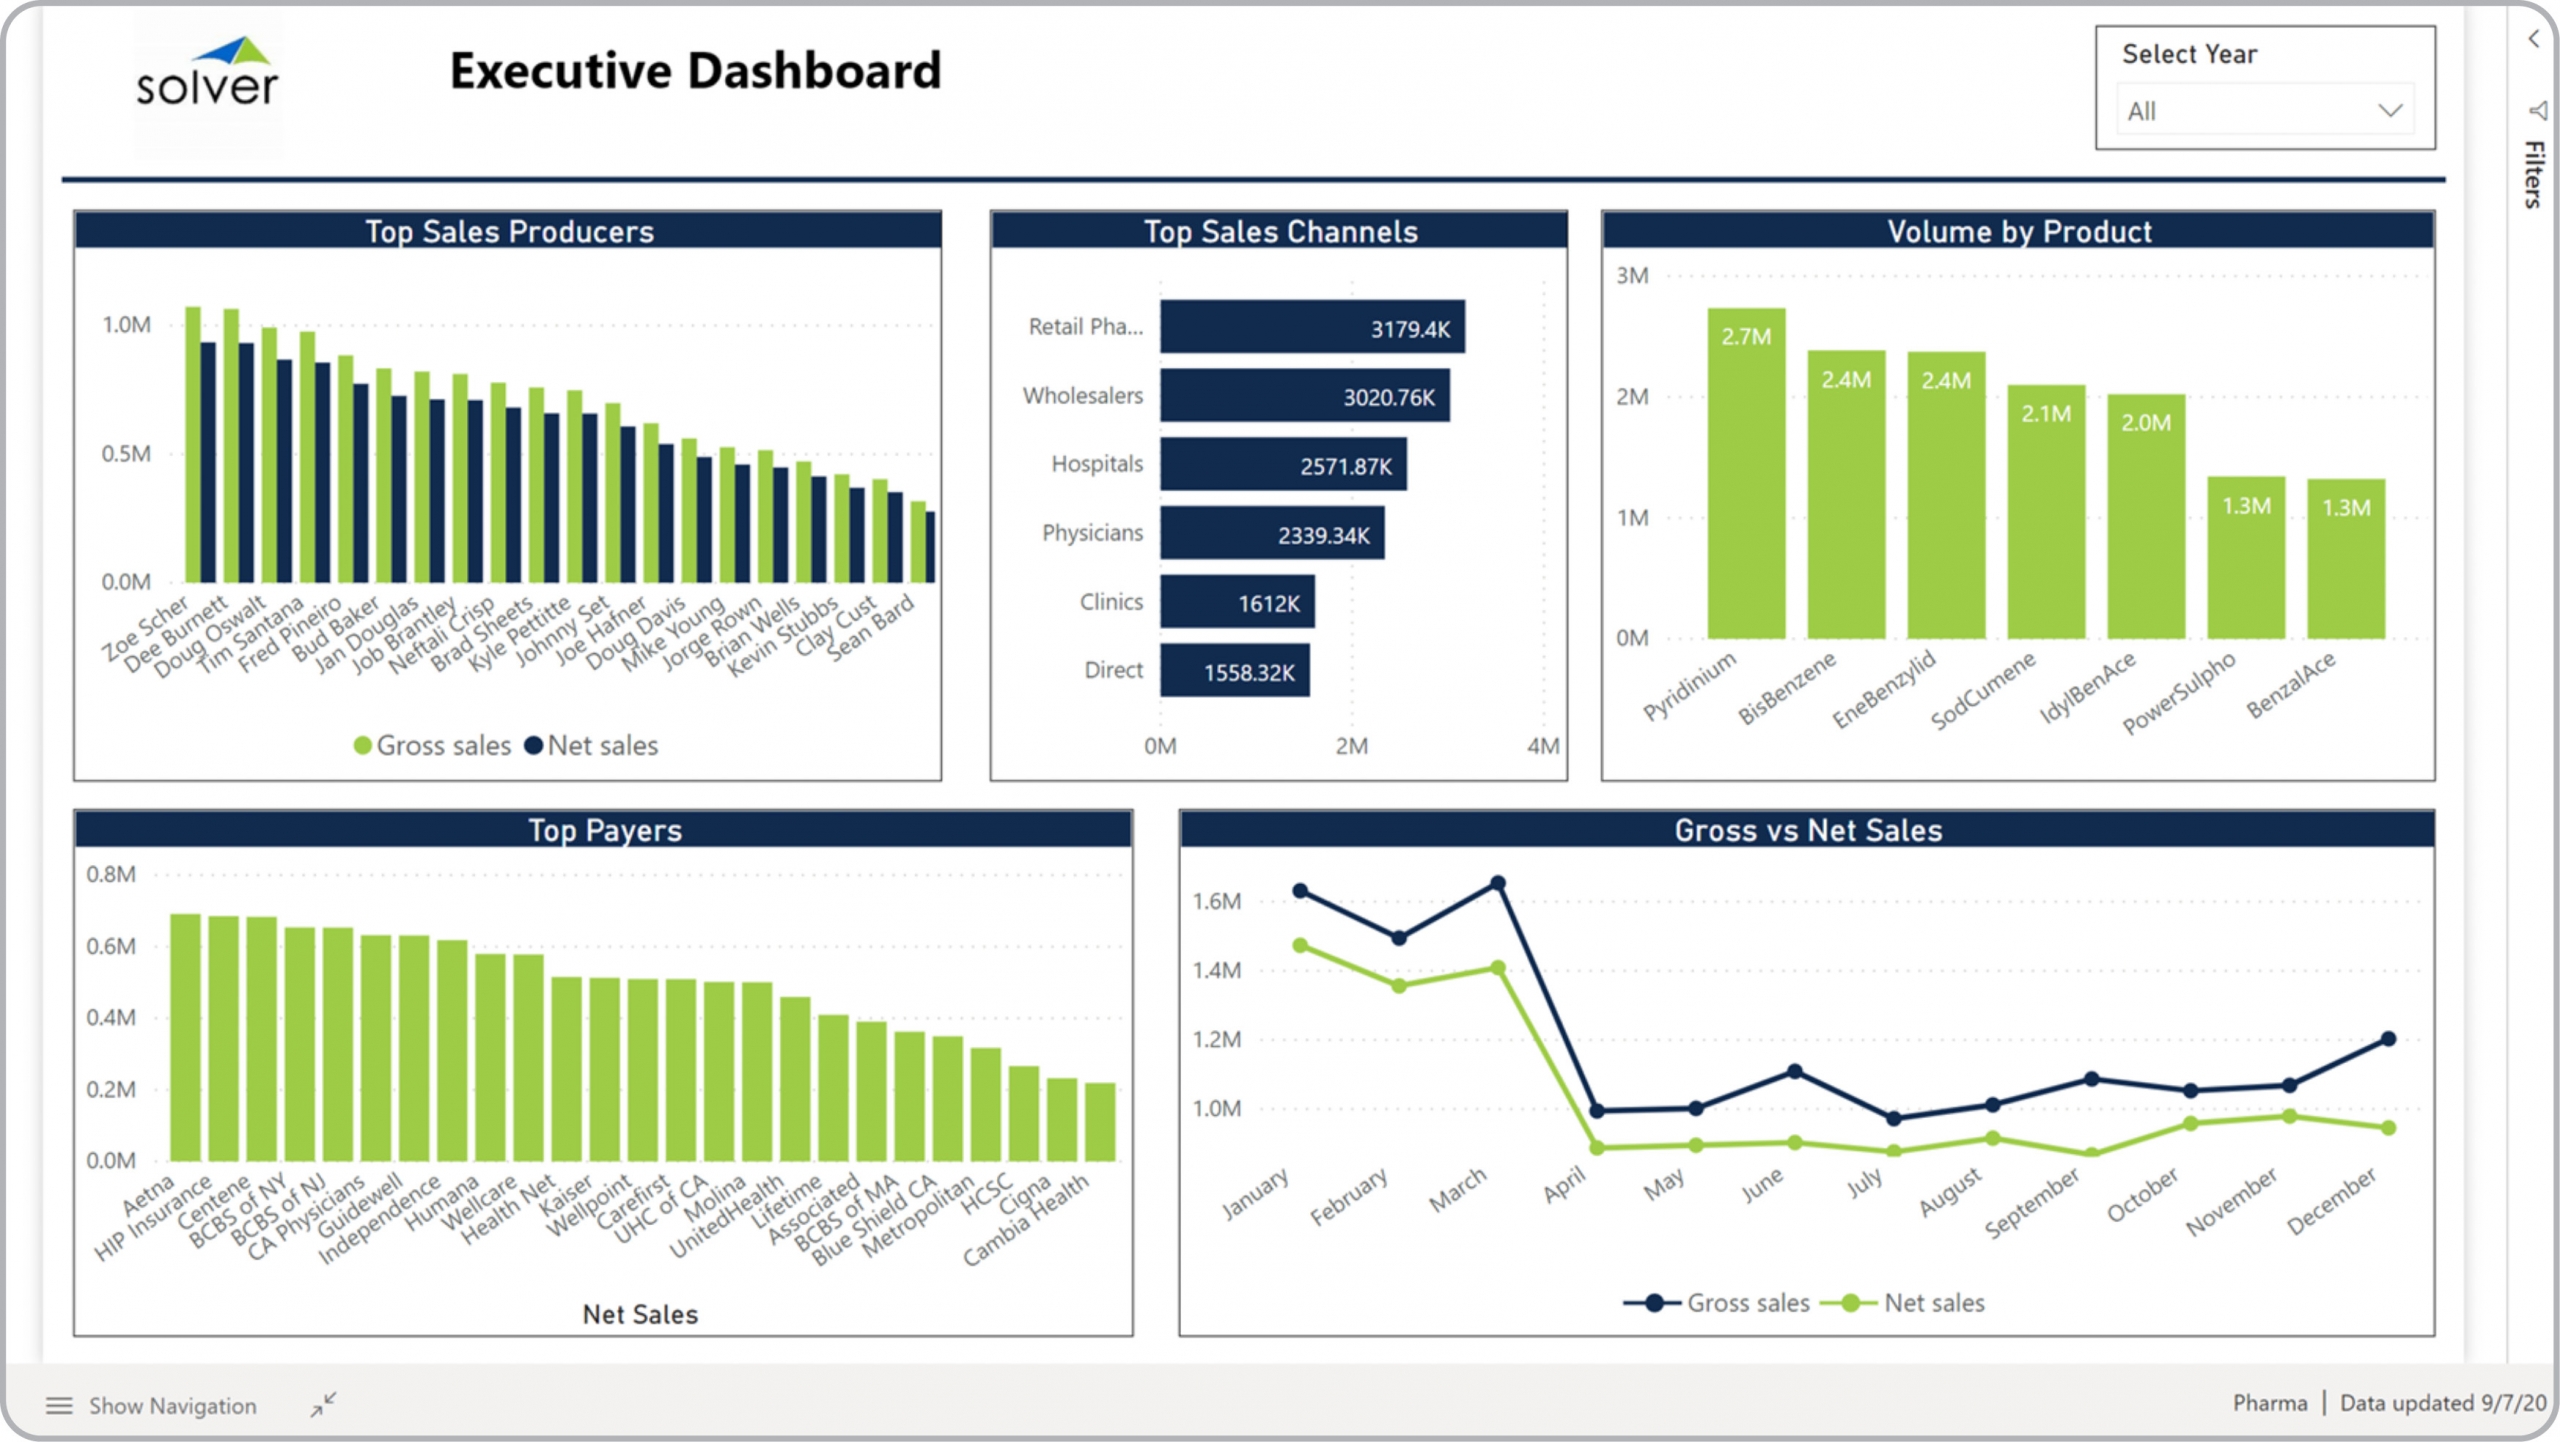
Executive Dashboard for Pharmaceutical Companies
What is an Executive Dashboard ? Executive dashboard are considered business monitoring tools and ...
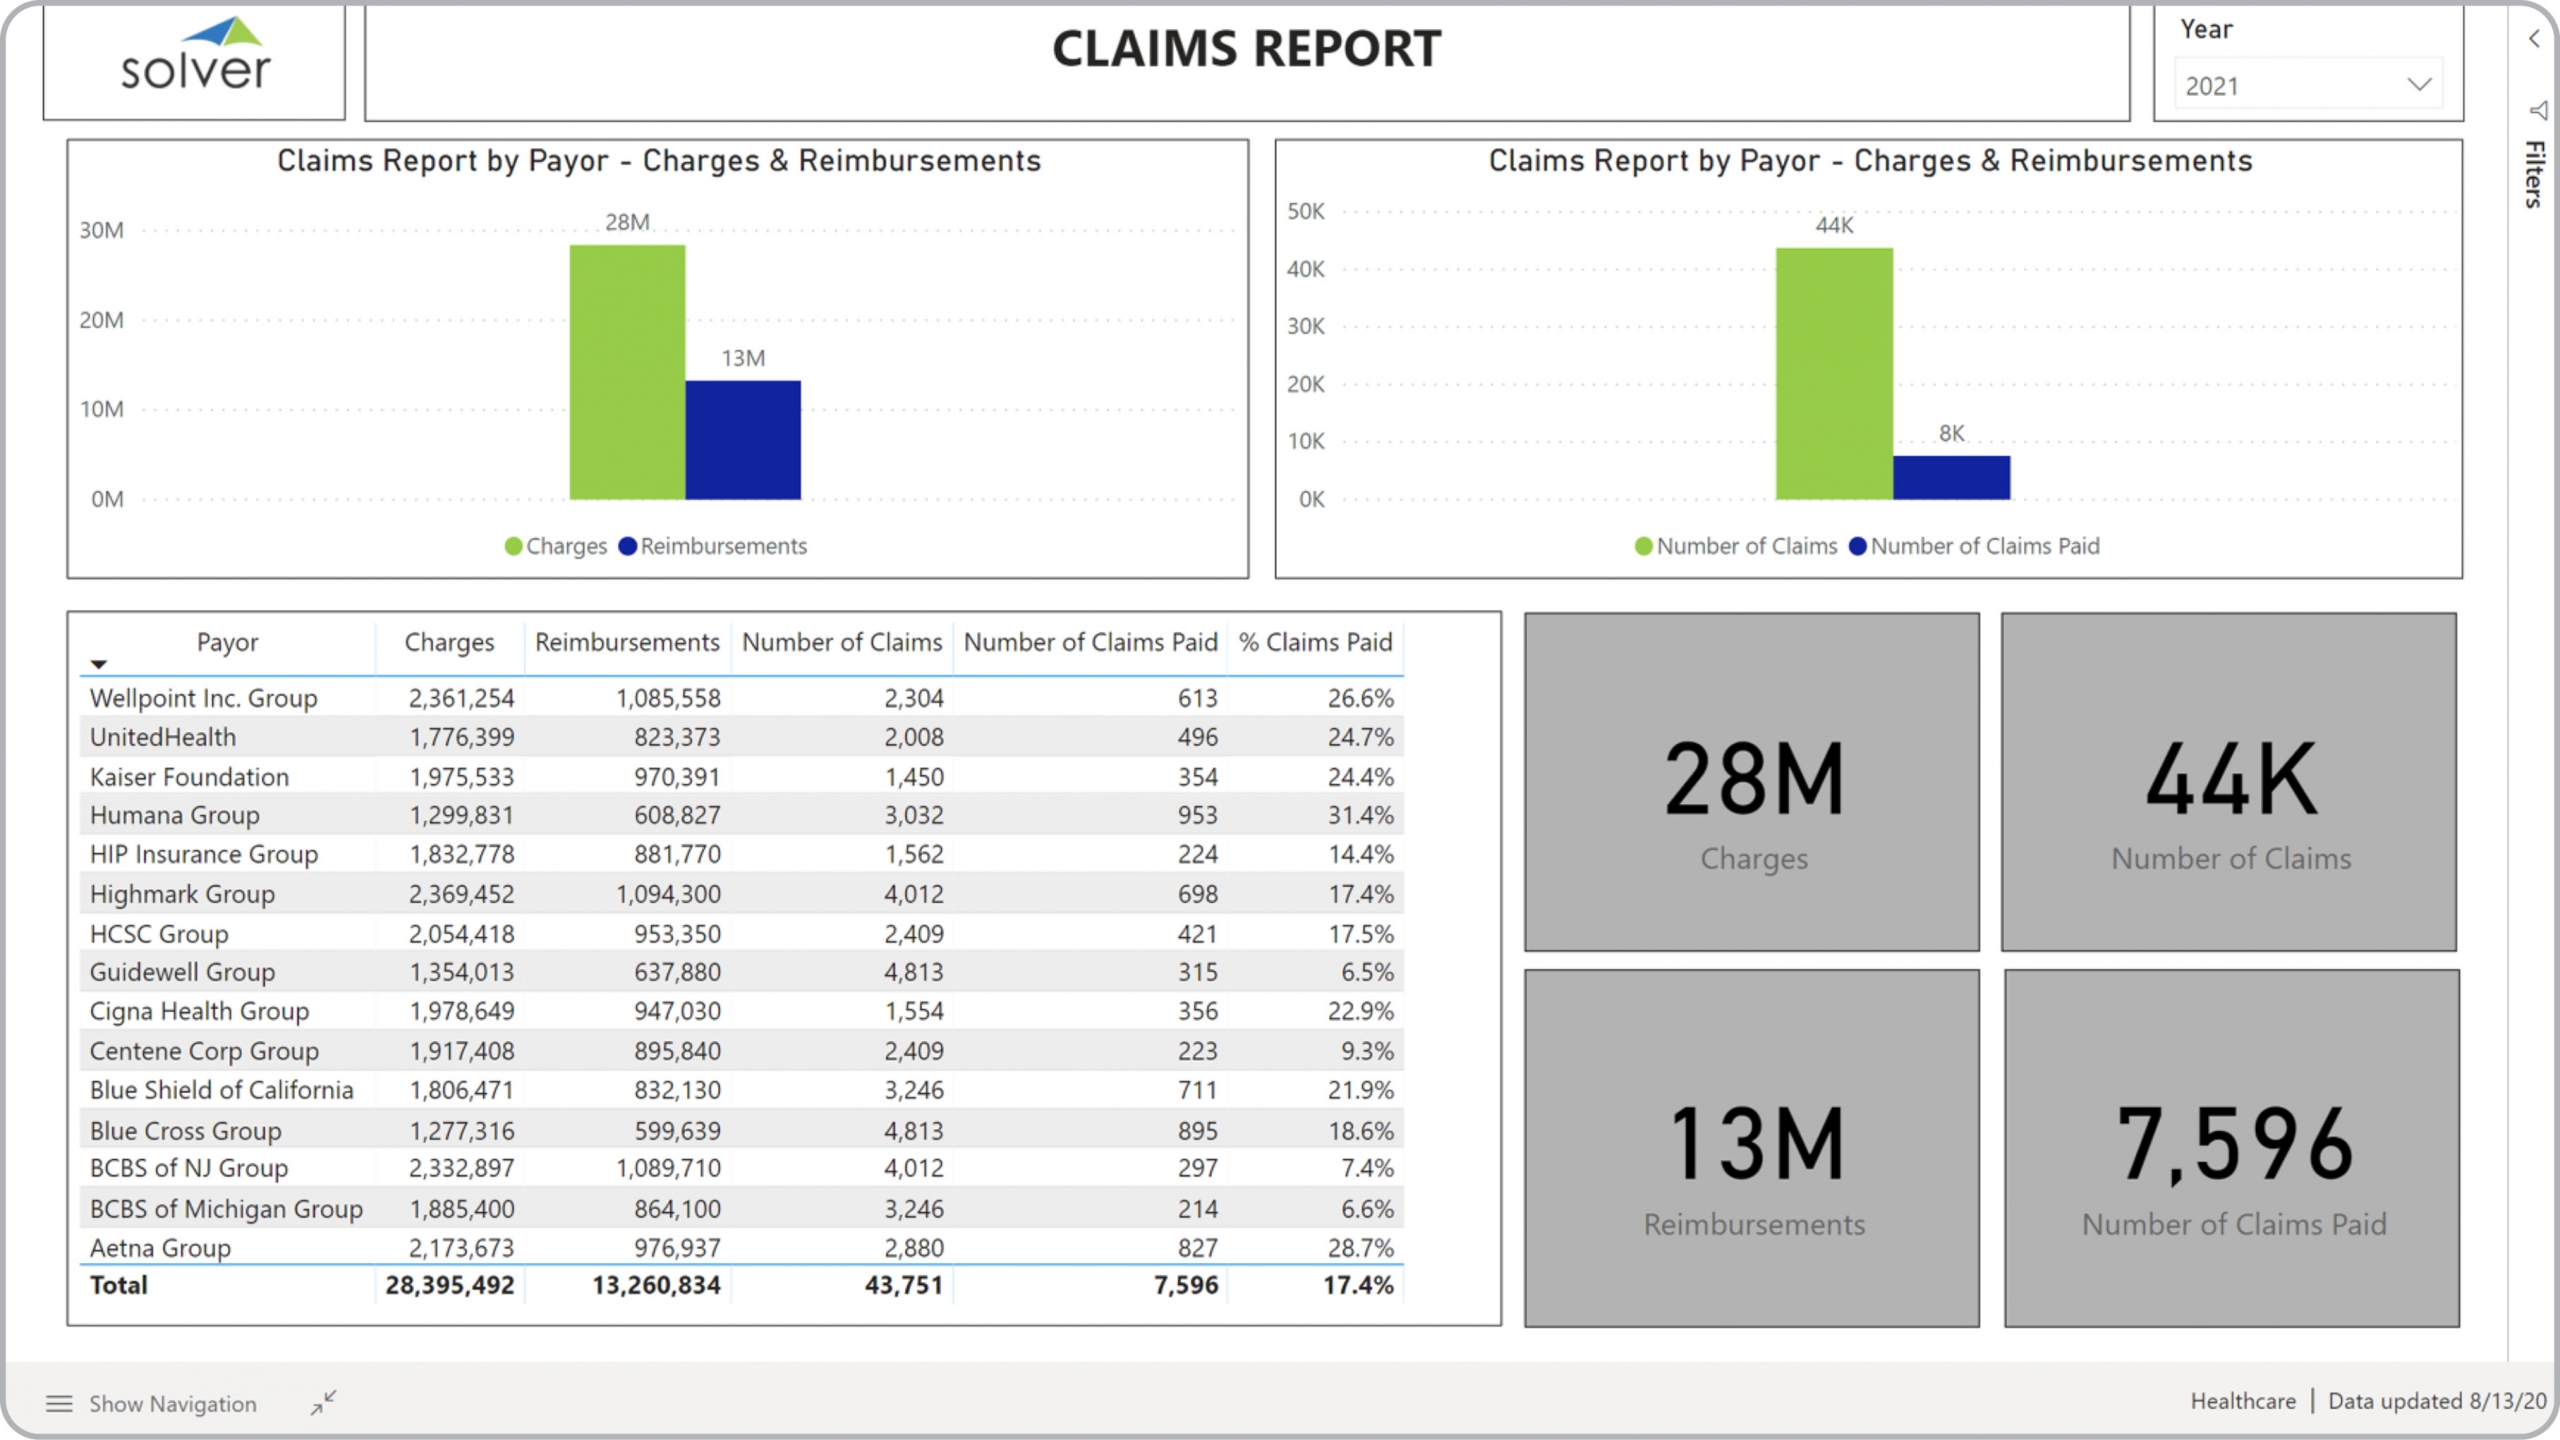
Claims Analysis Dashboard for Healthcare Providers
What is a Claims Analysis Dashboard ? Claims Dashboards are considered payor and reimbursement ...
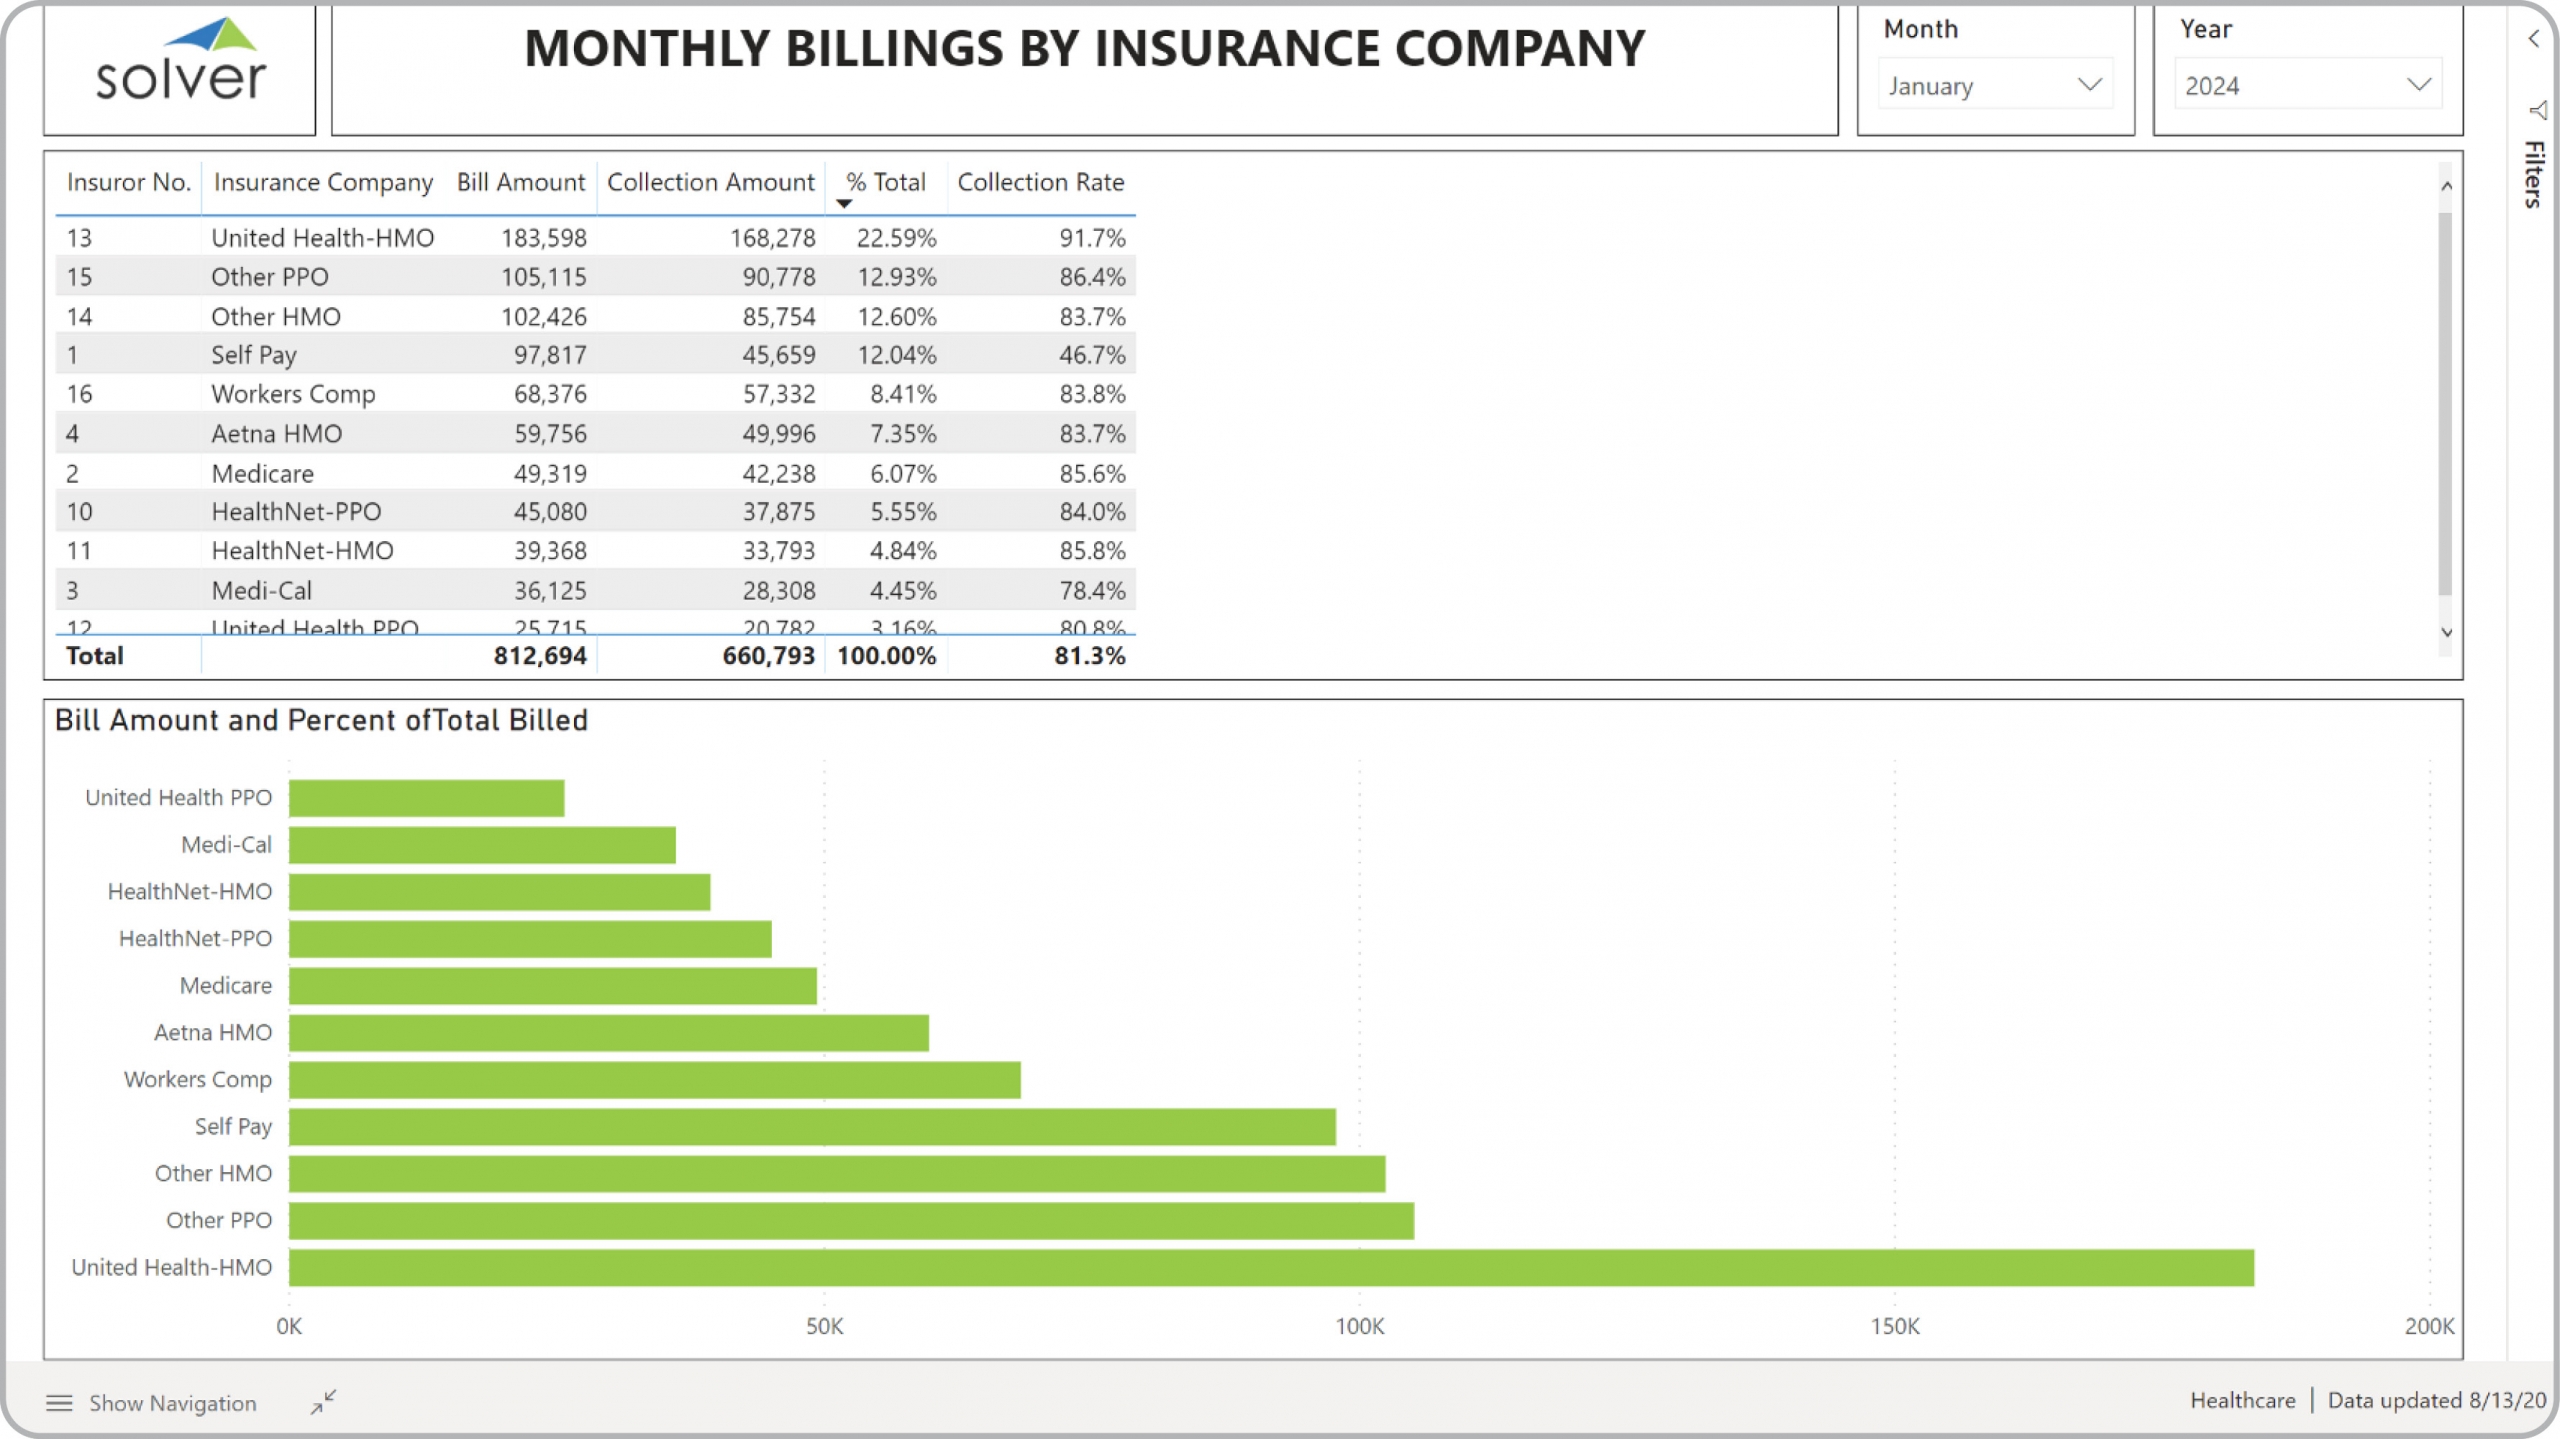
Monthly Billings by Insurance Company Dashboard for Healthcare Providers
What is a Monthly Billings by Insurance Company Dashboard ? Billings by Insurance Company ...
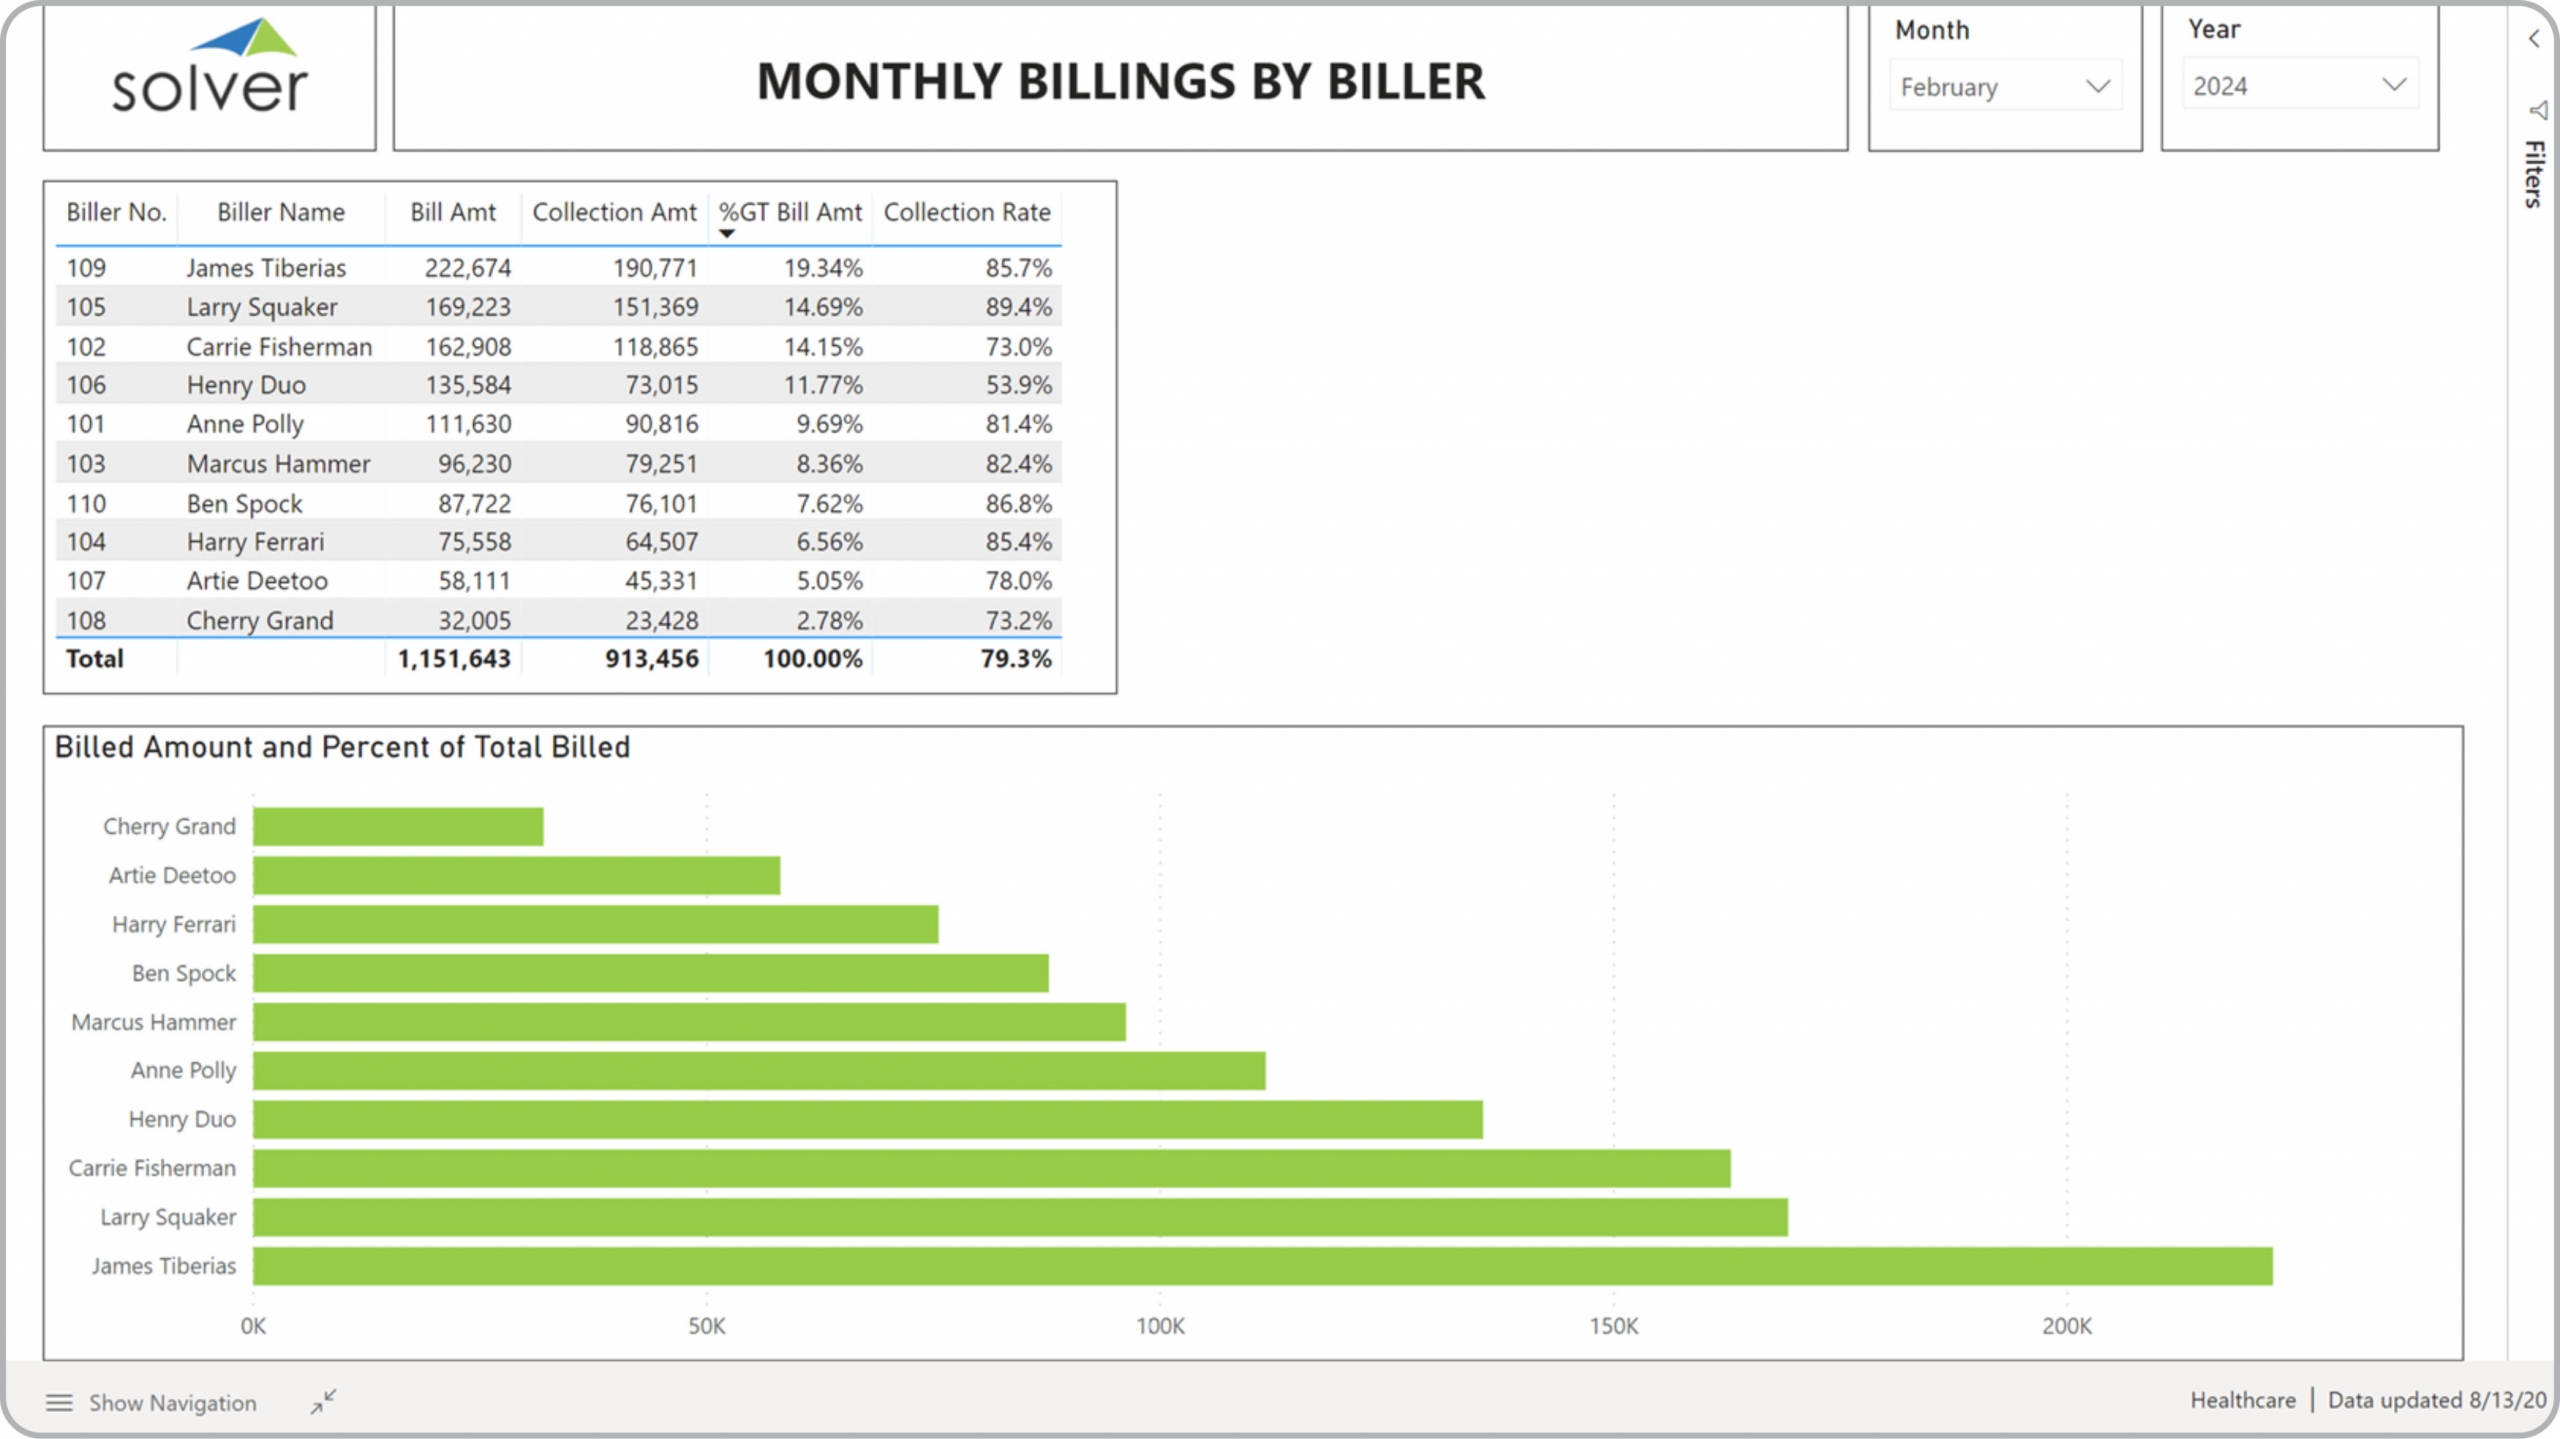
Billings by Biller Dashboard for Healthcare Providers
What is a Billings by Biller Dashboard? Billings by Biller Dashboards are considered billing ...
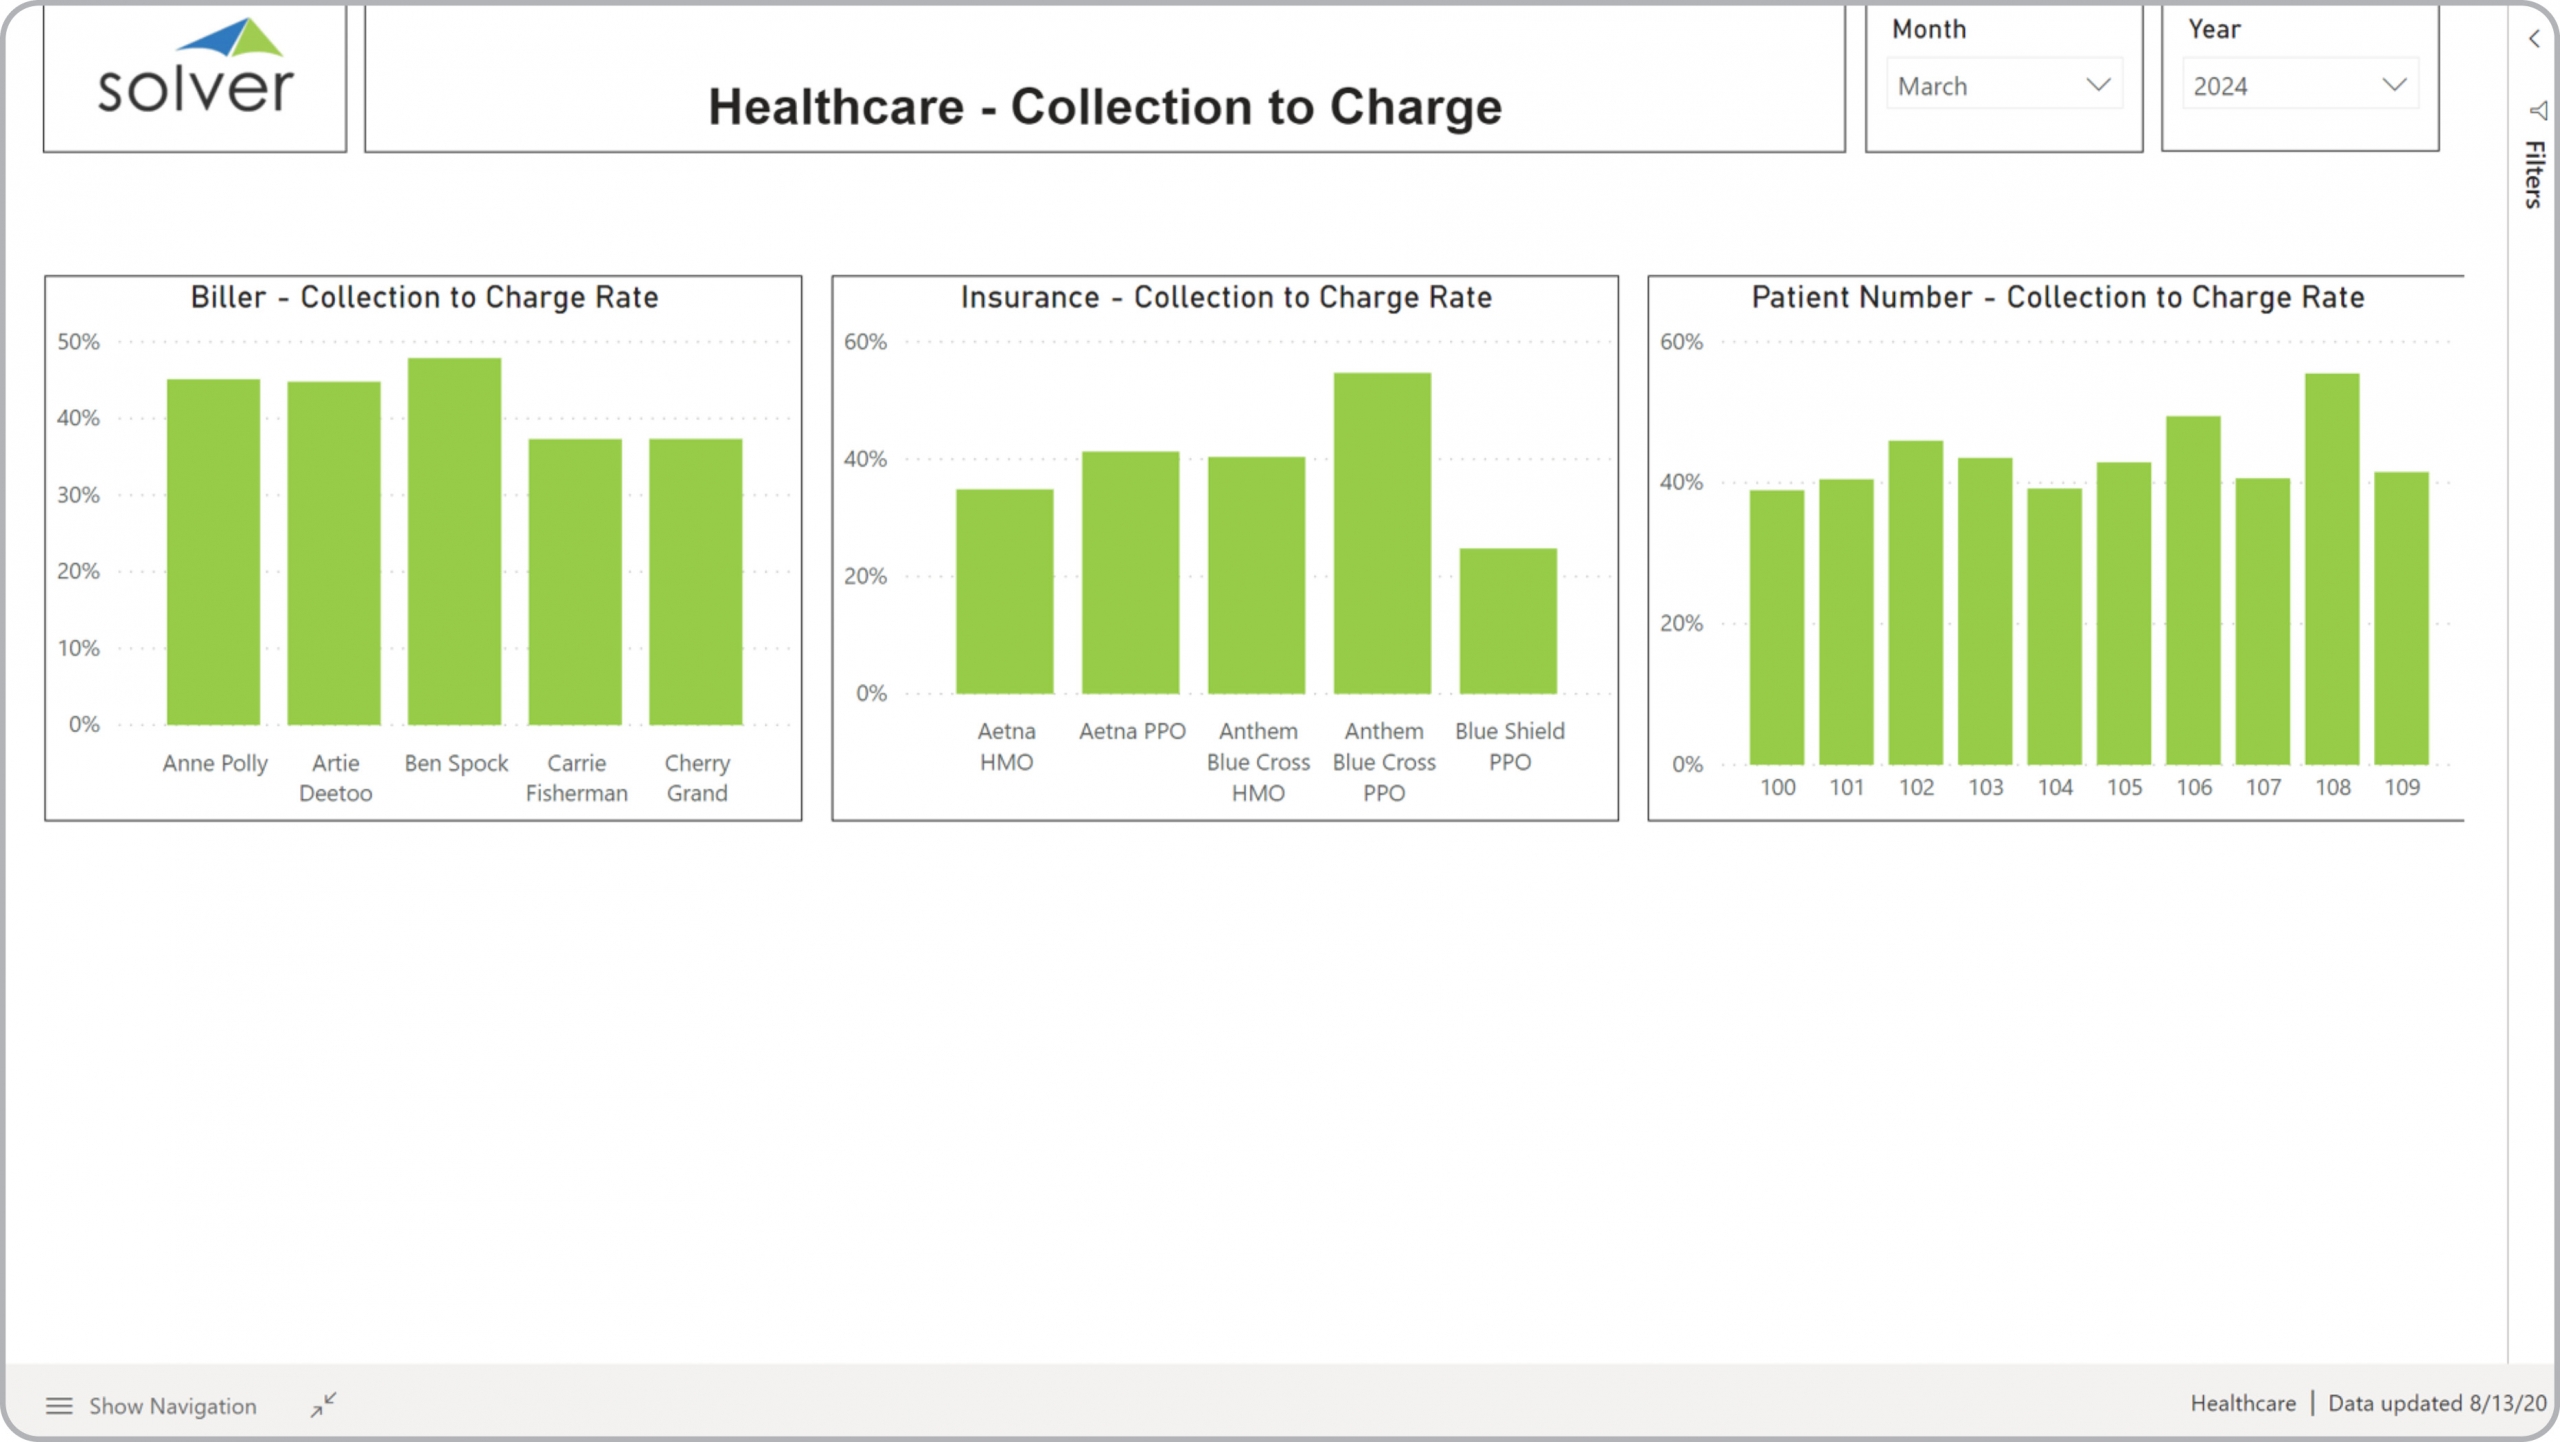
Collections to Charge Rate Dashboard for Healthcare Providers
What is a Collections to Charge Rate Dashboard ? Collections to Charge Rate Dashboards are ...
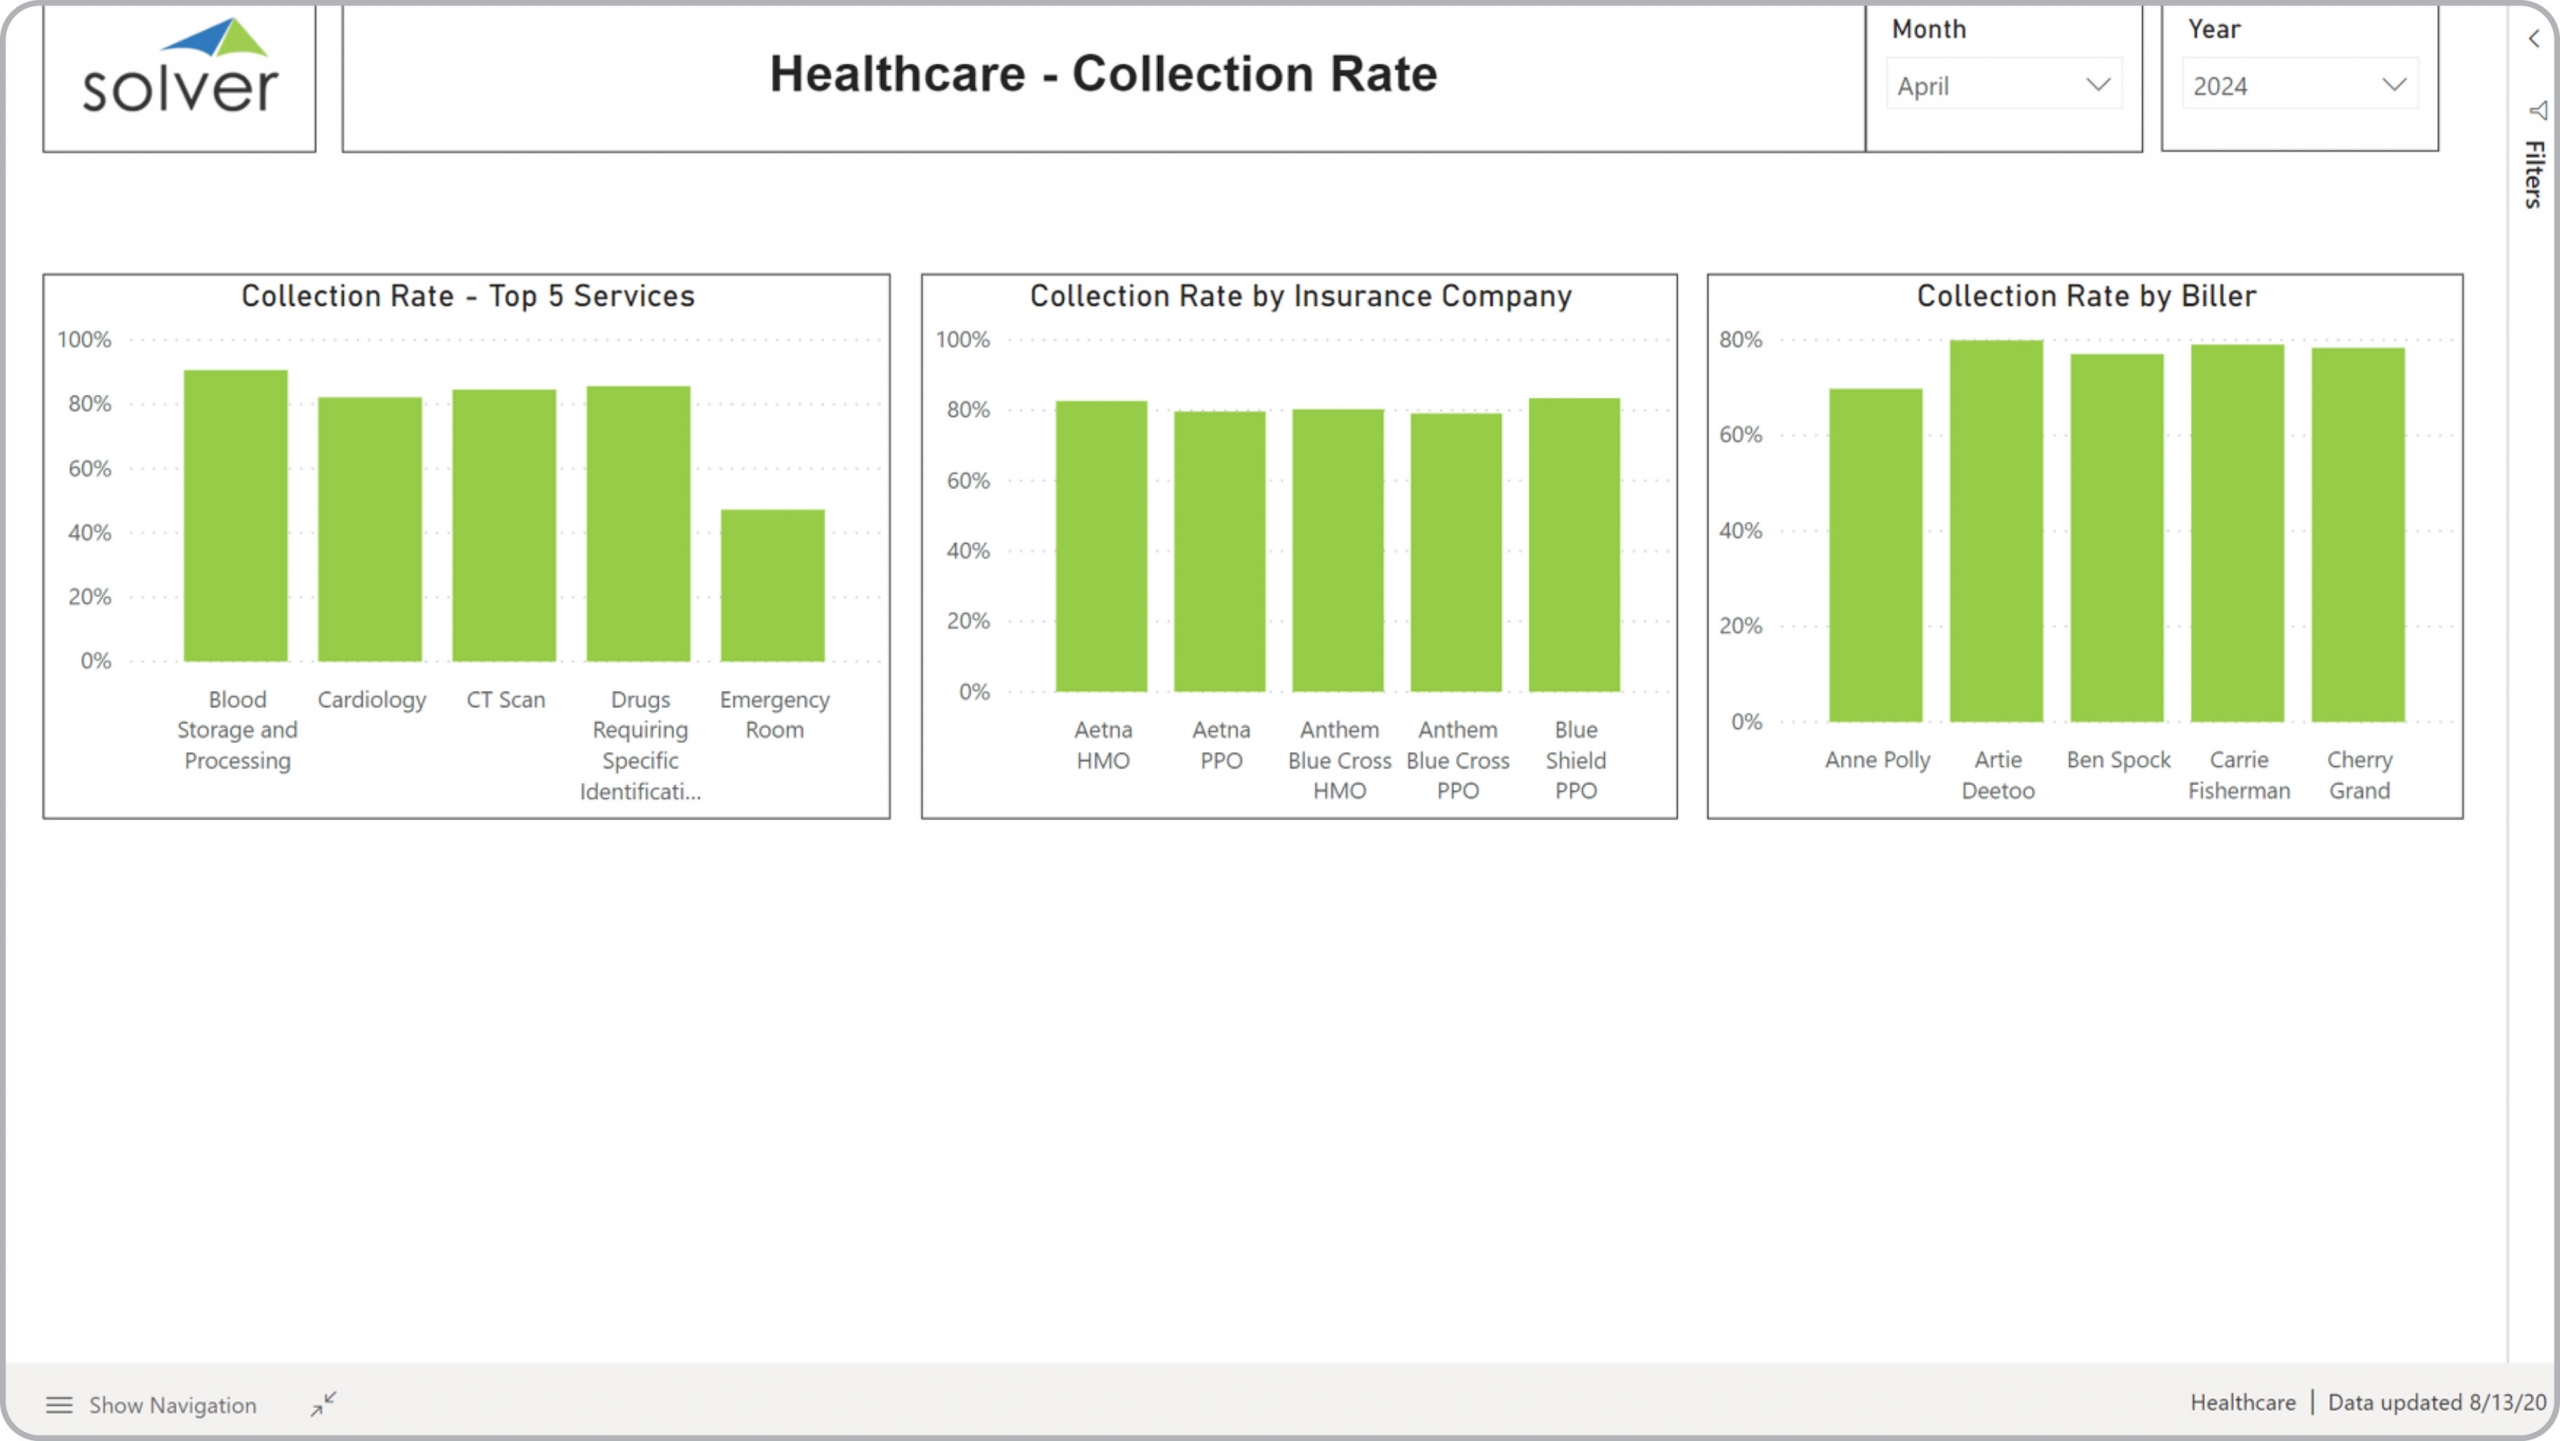
Collections Rate Dashboard for Healthcare Providers
What is a Collections Rate Dashboard ? Collections Dashboards are considered operational analysis ...
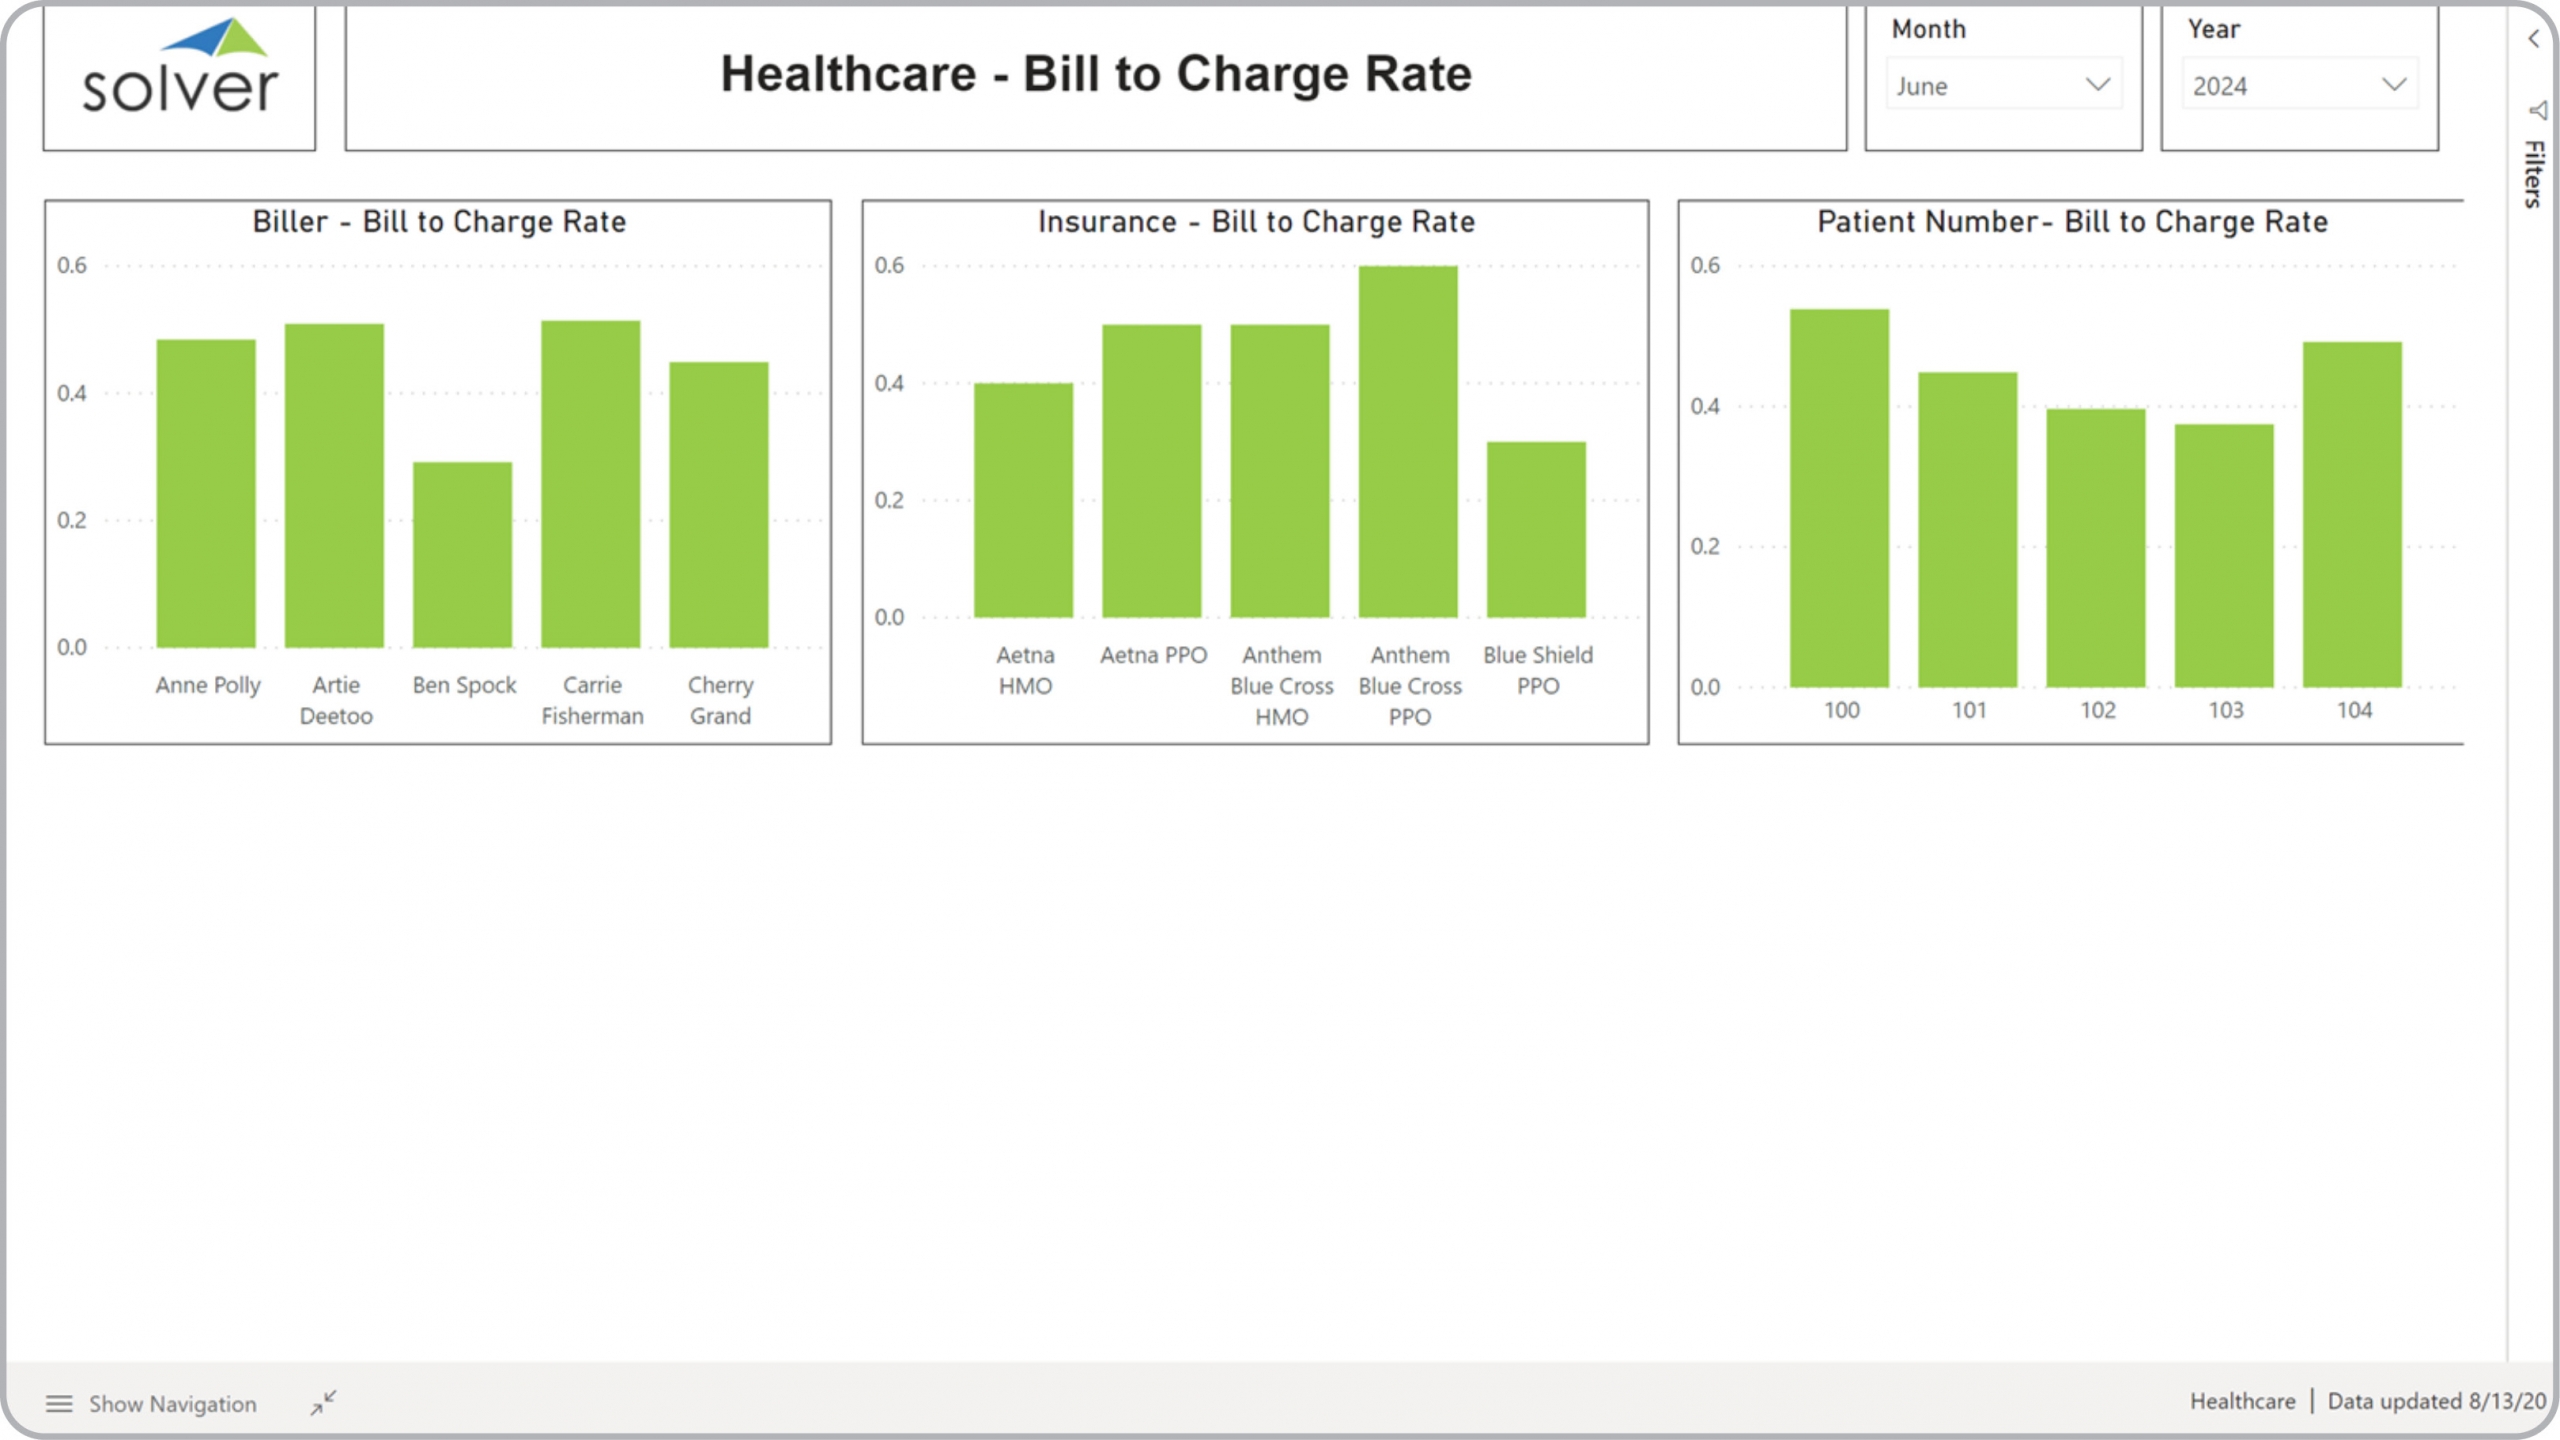
Bill to Charge Rate Dashboard for Healthcare Providers
What is a Bill to Charge Rate Dashboard ? Bill to Charge Rate Dashboards are considered revenue and ...
Charge Summary Dashboard for Healthcare Providers
What is a Charge Summary Dashboard ? Charge Summary Dashboards are considered revenue analysis ...
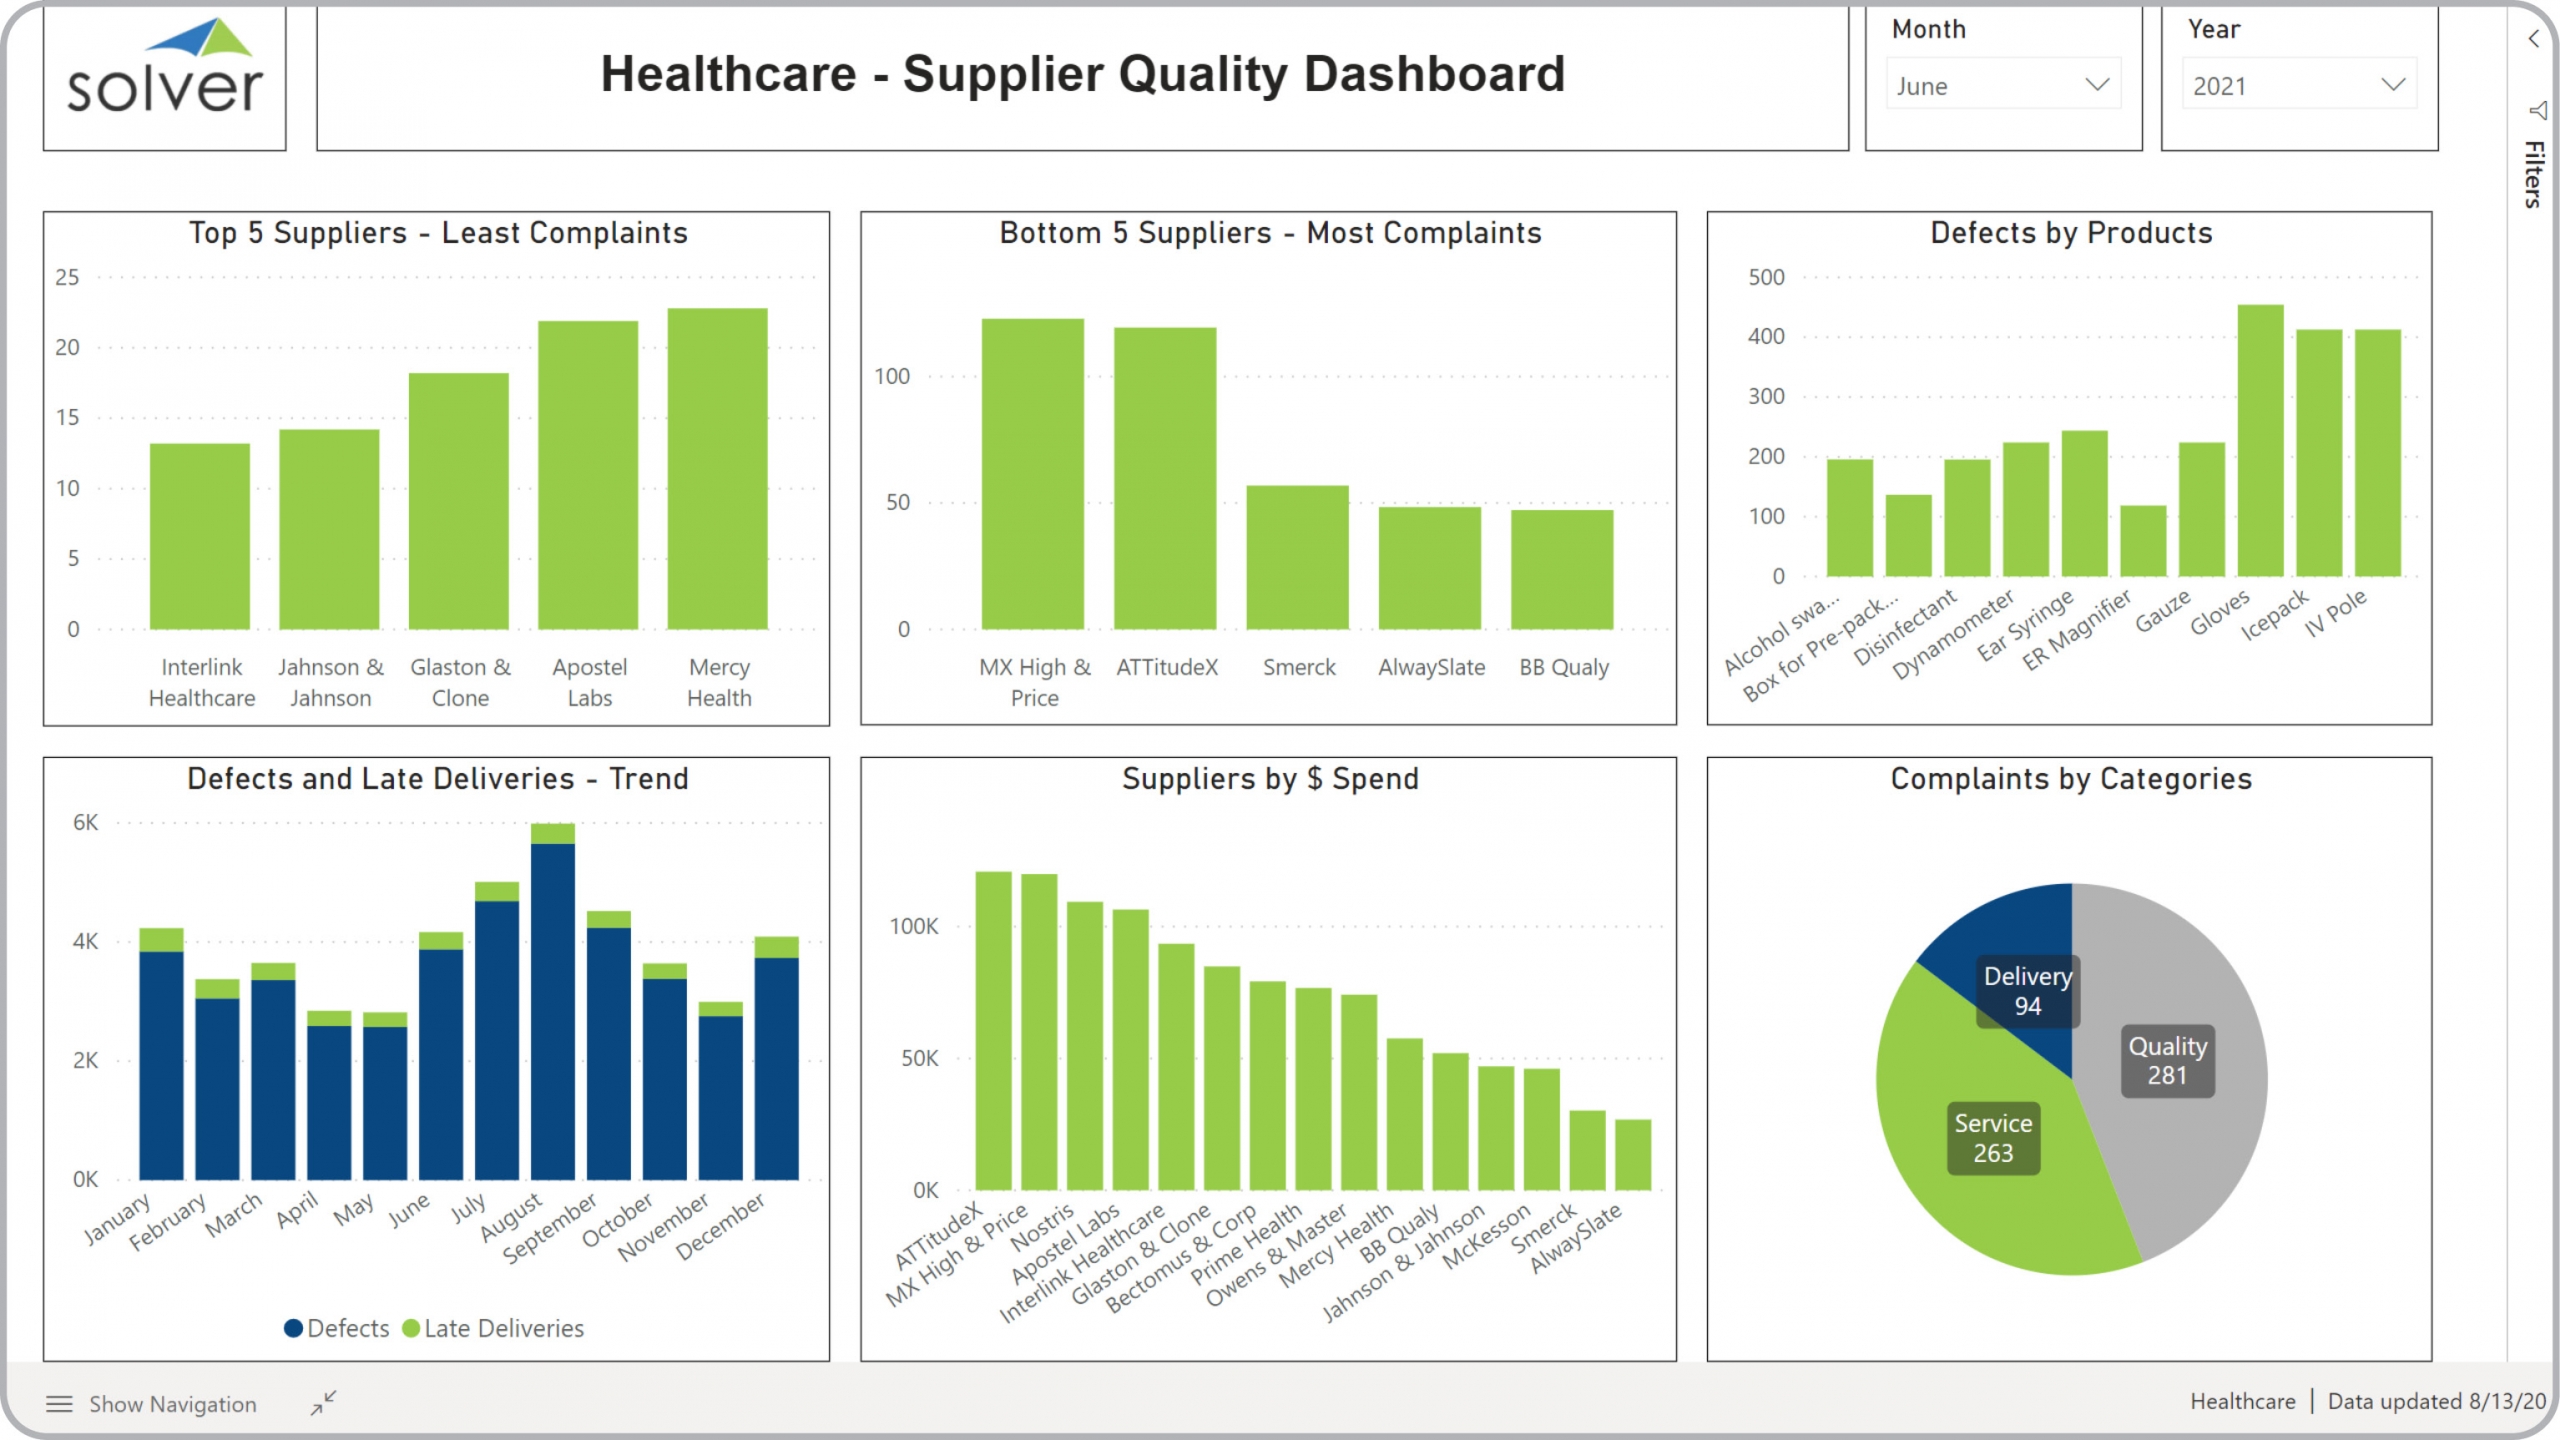
Supplier Quality Dashboard for Healthcare Providers
What is a Supplier Quality Dashboard ? Supplier Quality Dashboards are considered operational ...
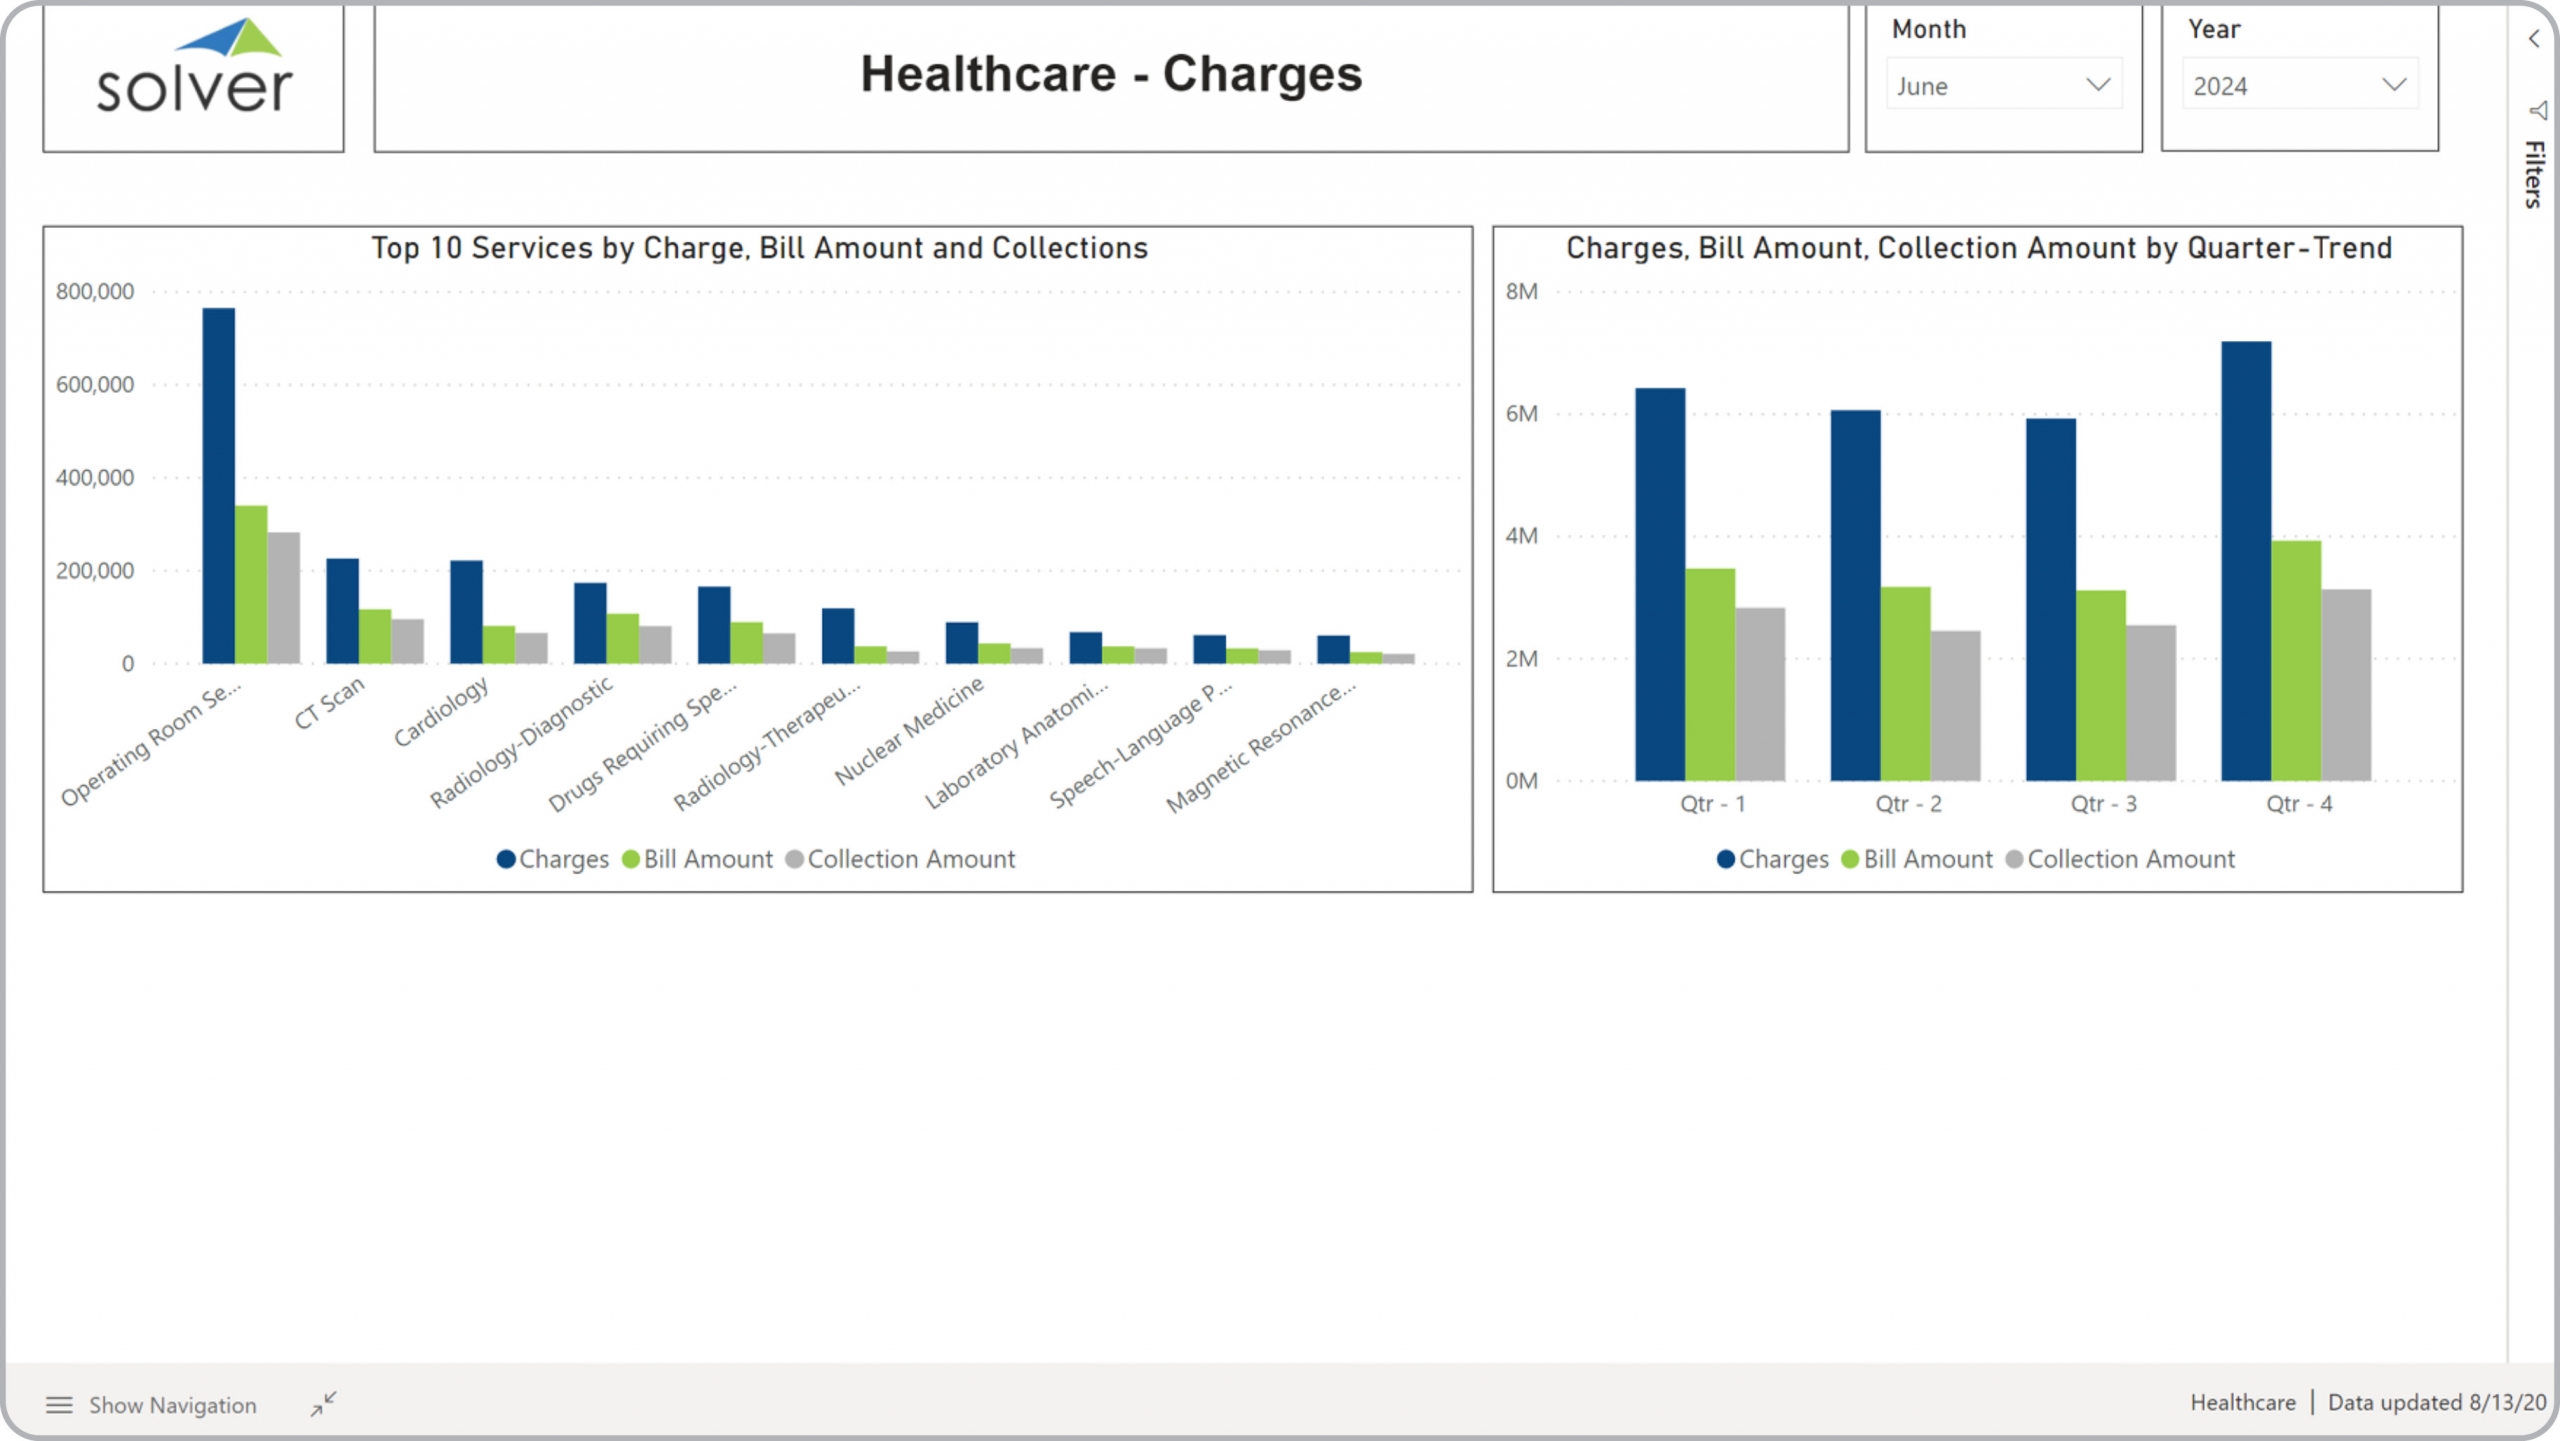
Top Service Charges Dashboard for Healthcare Providers
What is a Top Services by Charges Dashboard ? Service Charges Dashboards are considered revenue ...
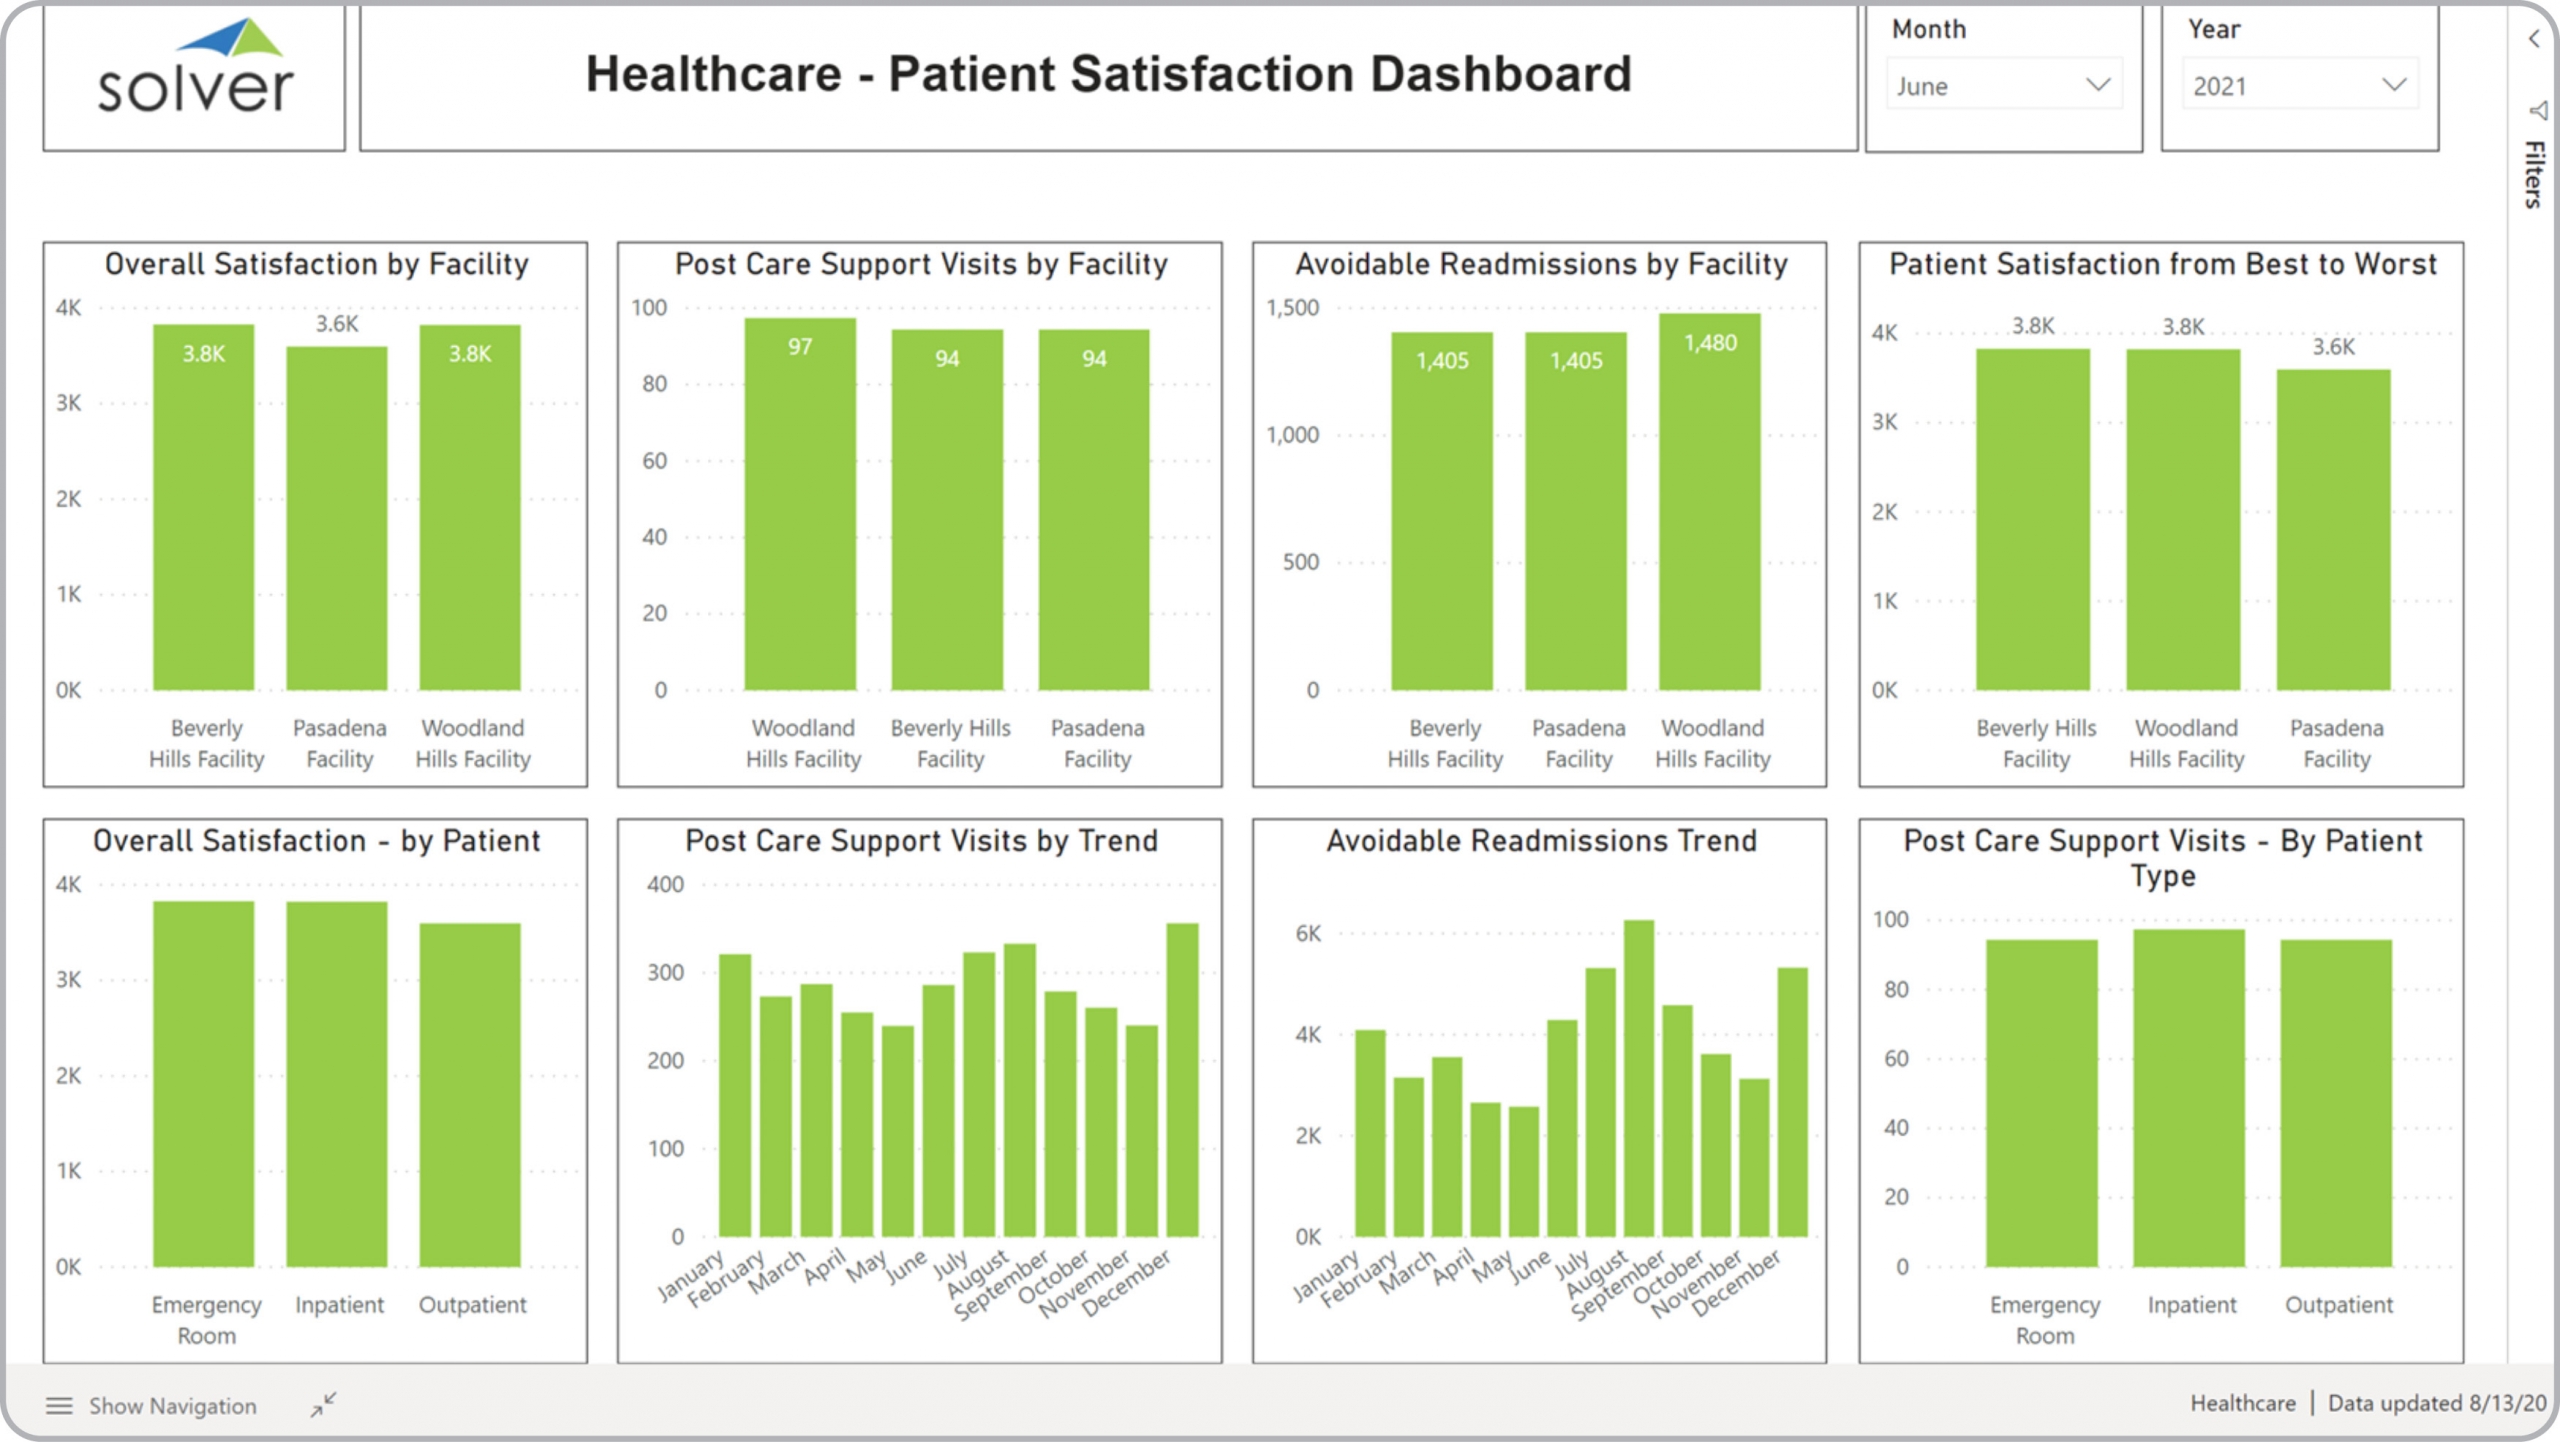
Patient Satisfaction Dashboard for Healthcare Providers
What is a Patient Satisfaction Dashboard ? Patient Satisfaction Dashboards are considered ...
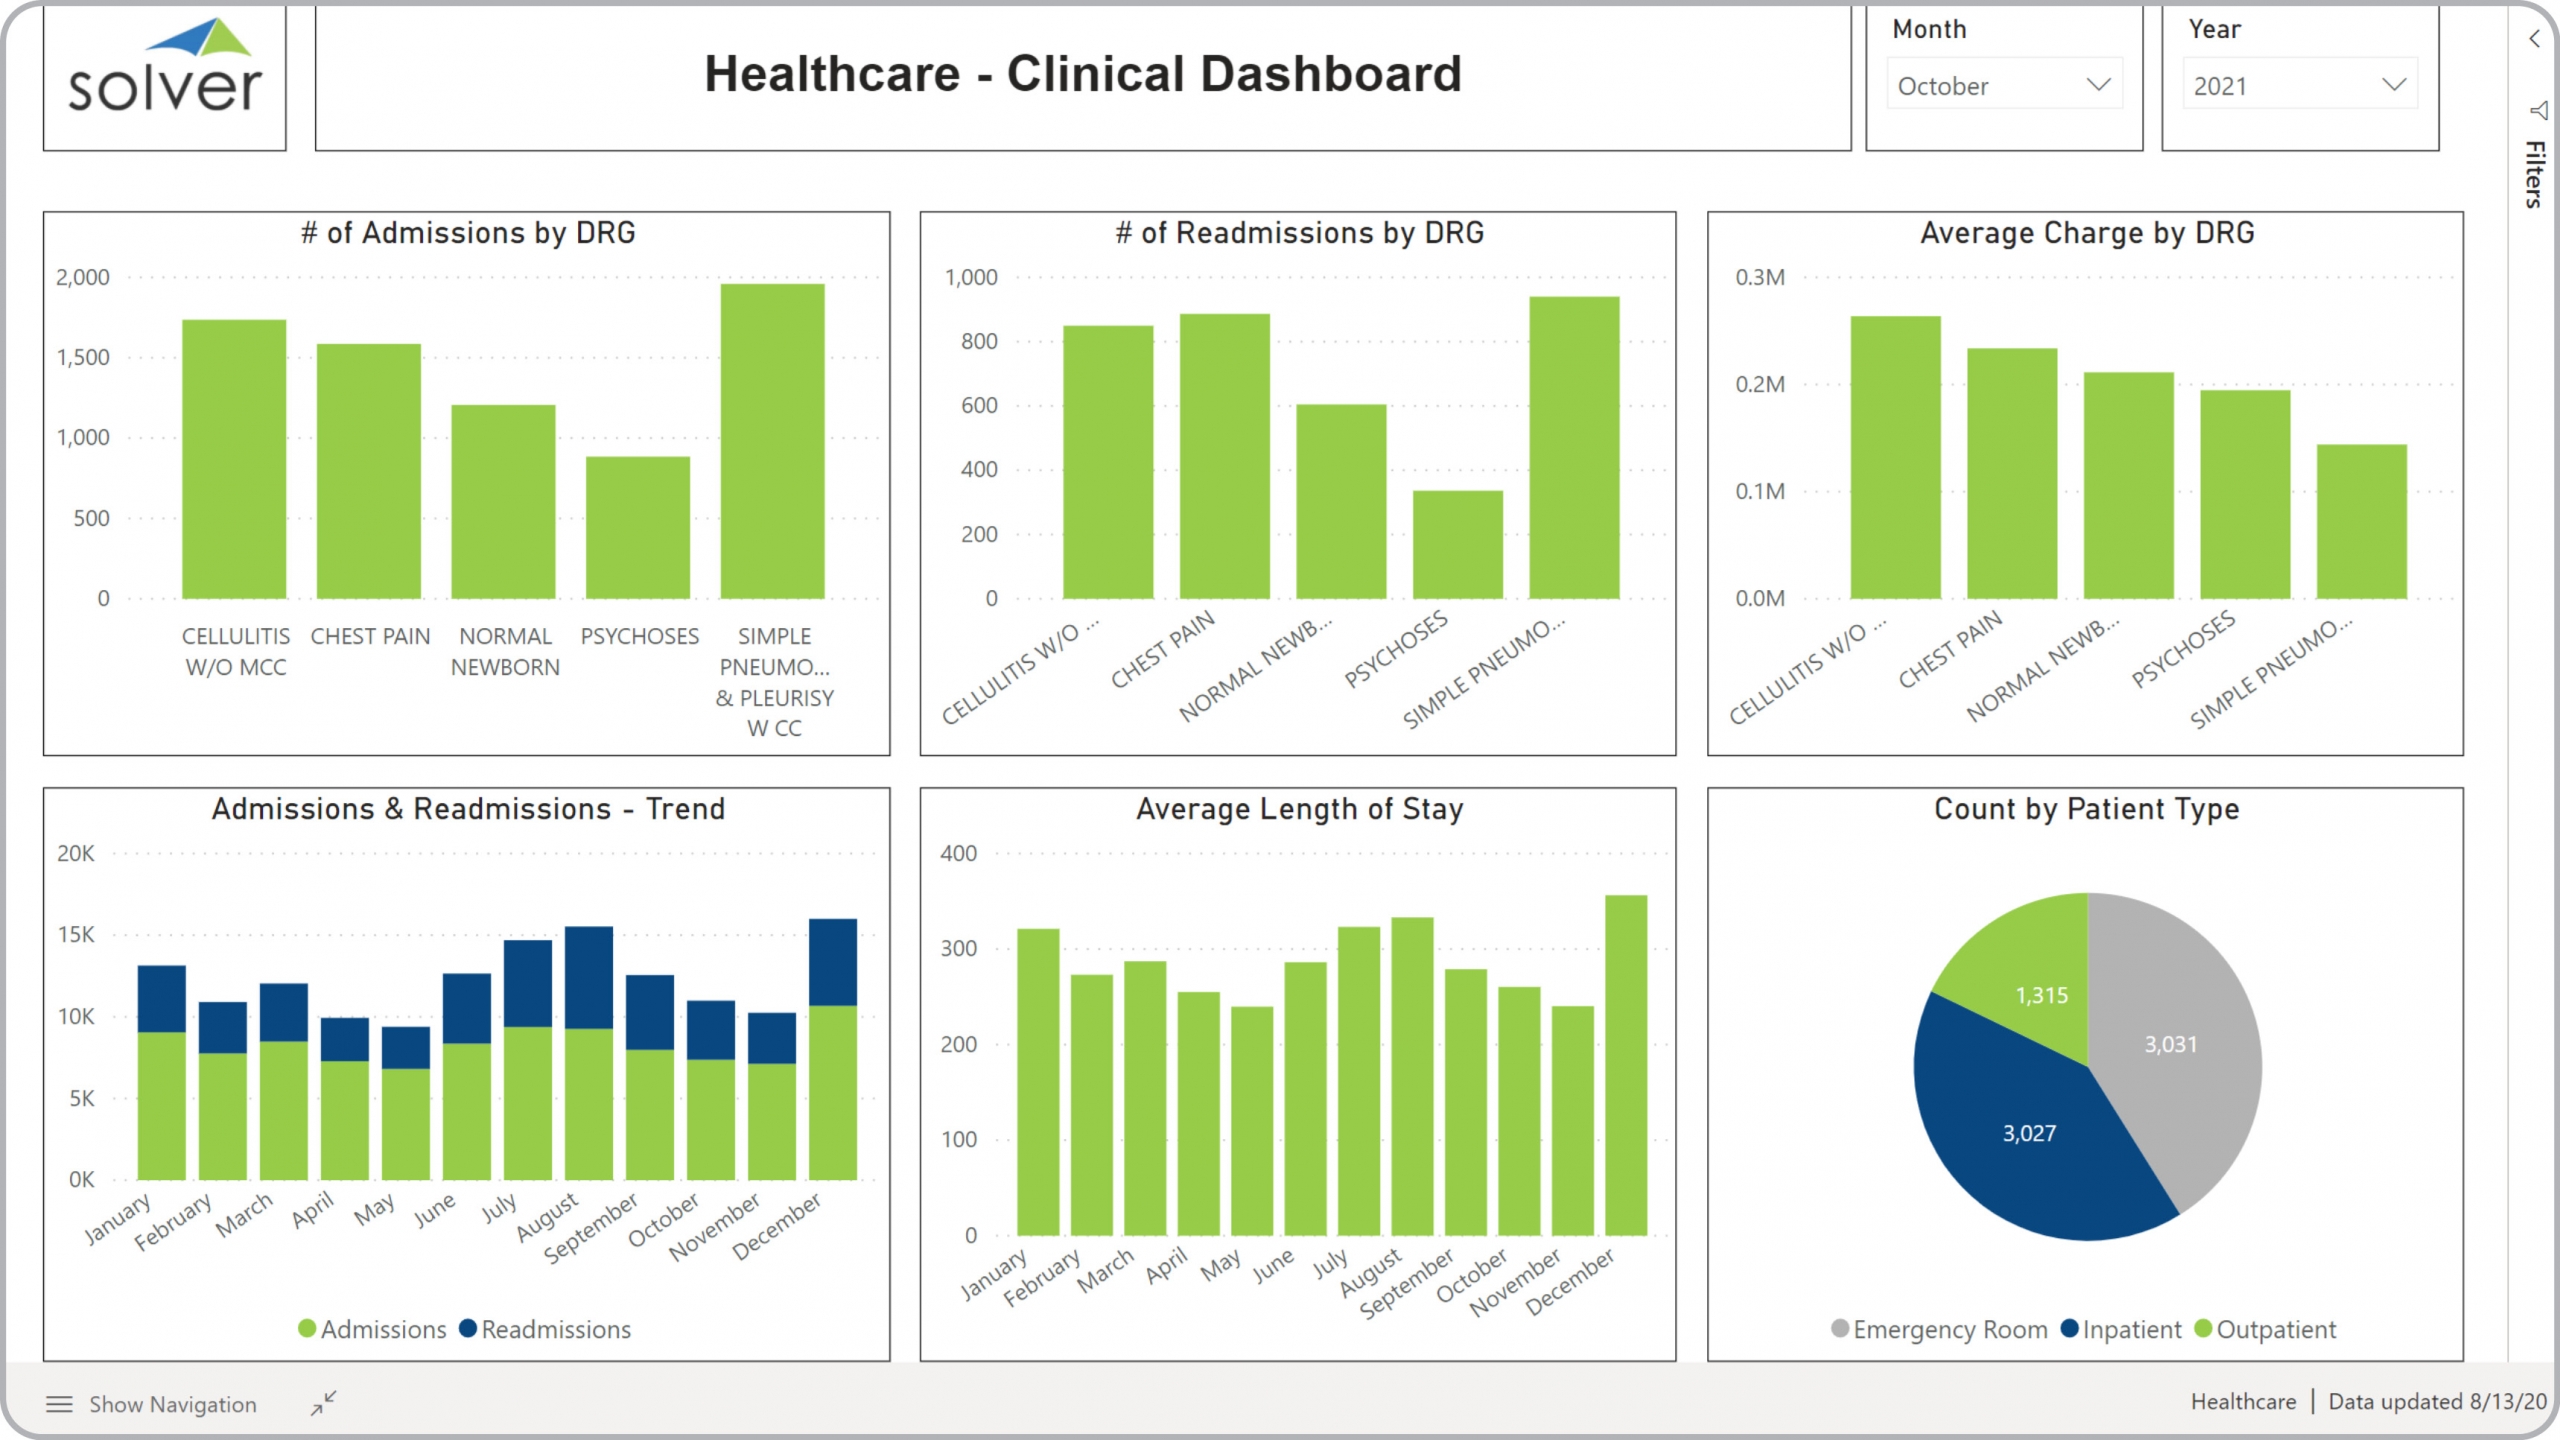
Clinical KPI Dashboard for Healthcare Providers
What is a Clinical KPI Dashboard ? Clinical Dashboards are considered operational analysis tools ...
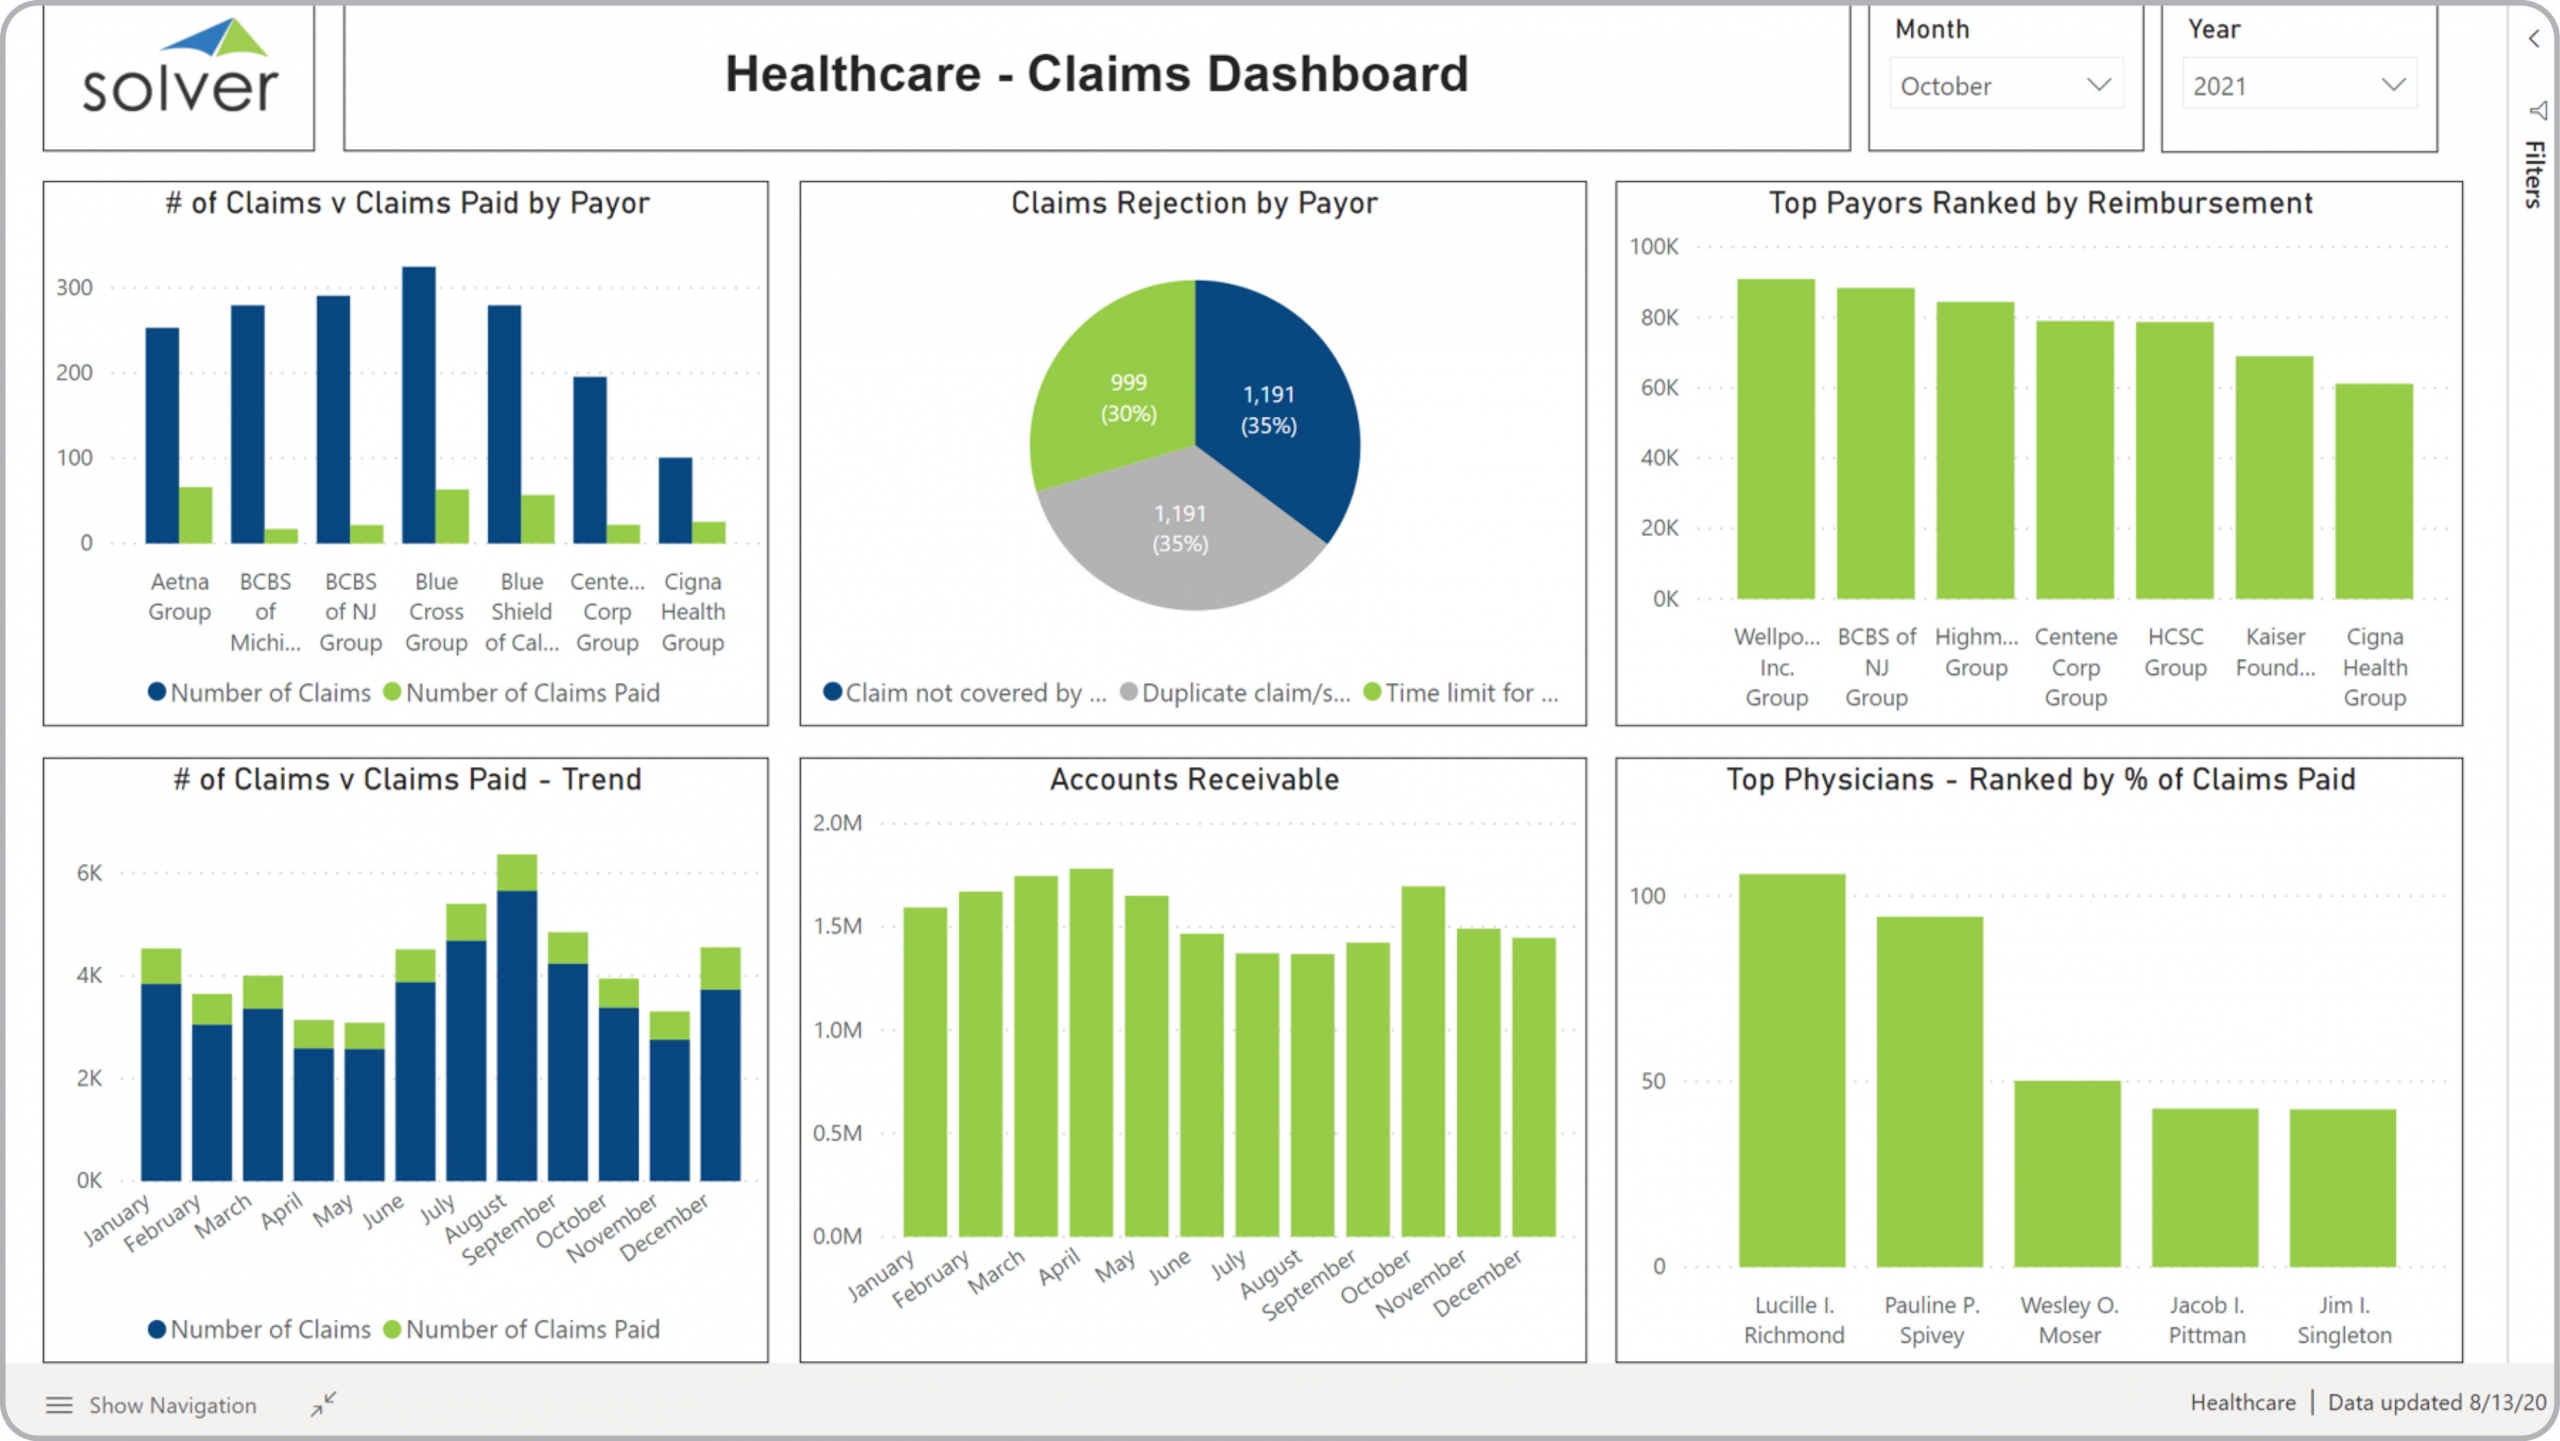
Claims Dashboard for Healthcare Providers
What is a Claims Dashboard ? Claims Dashboards are considered operational analysis tools and are ...
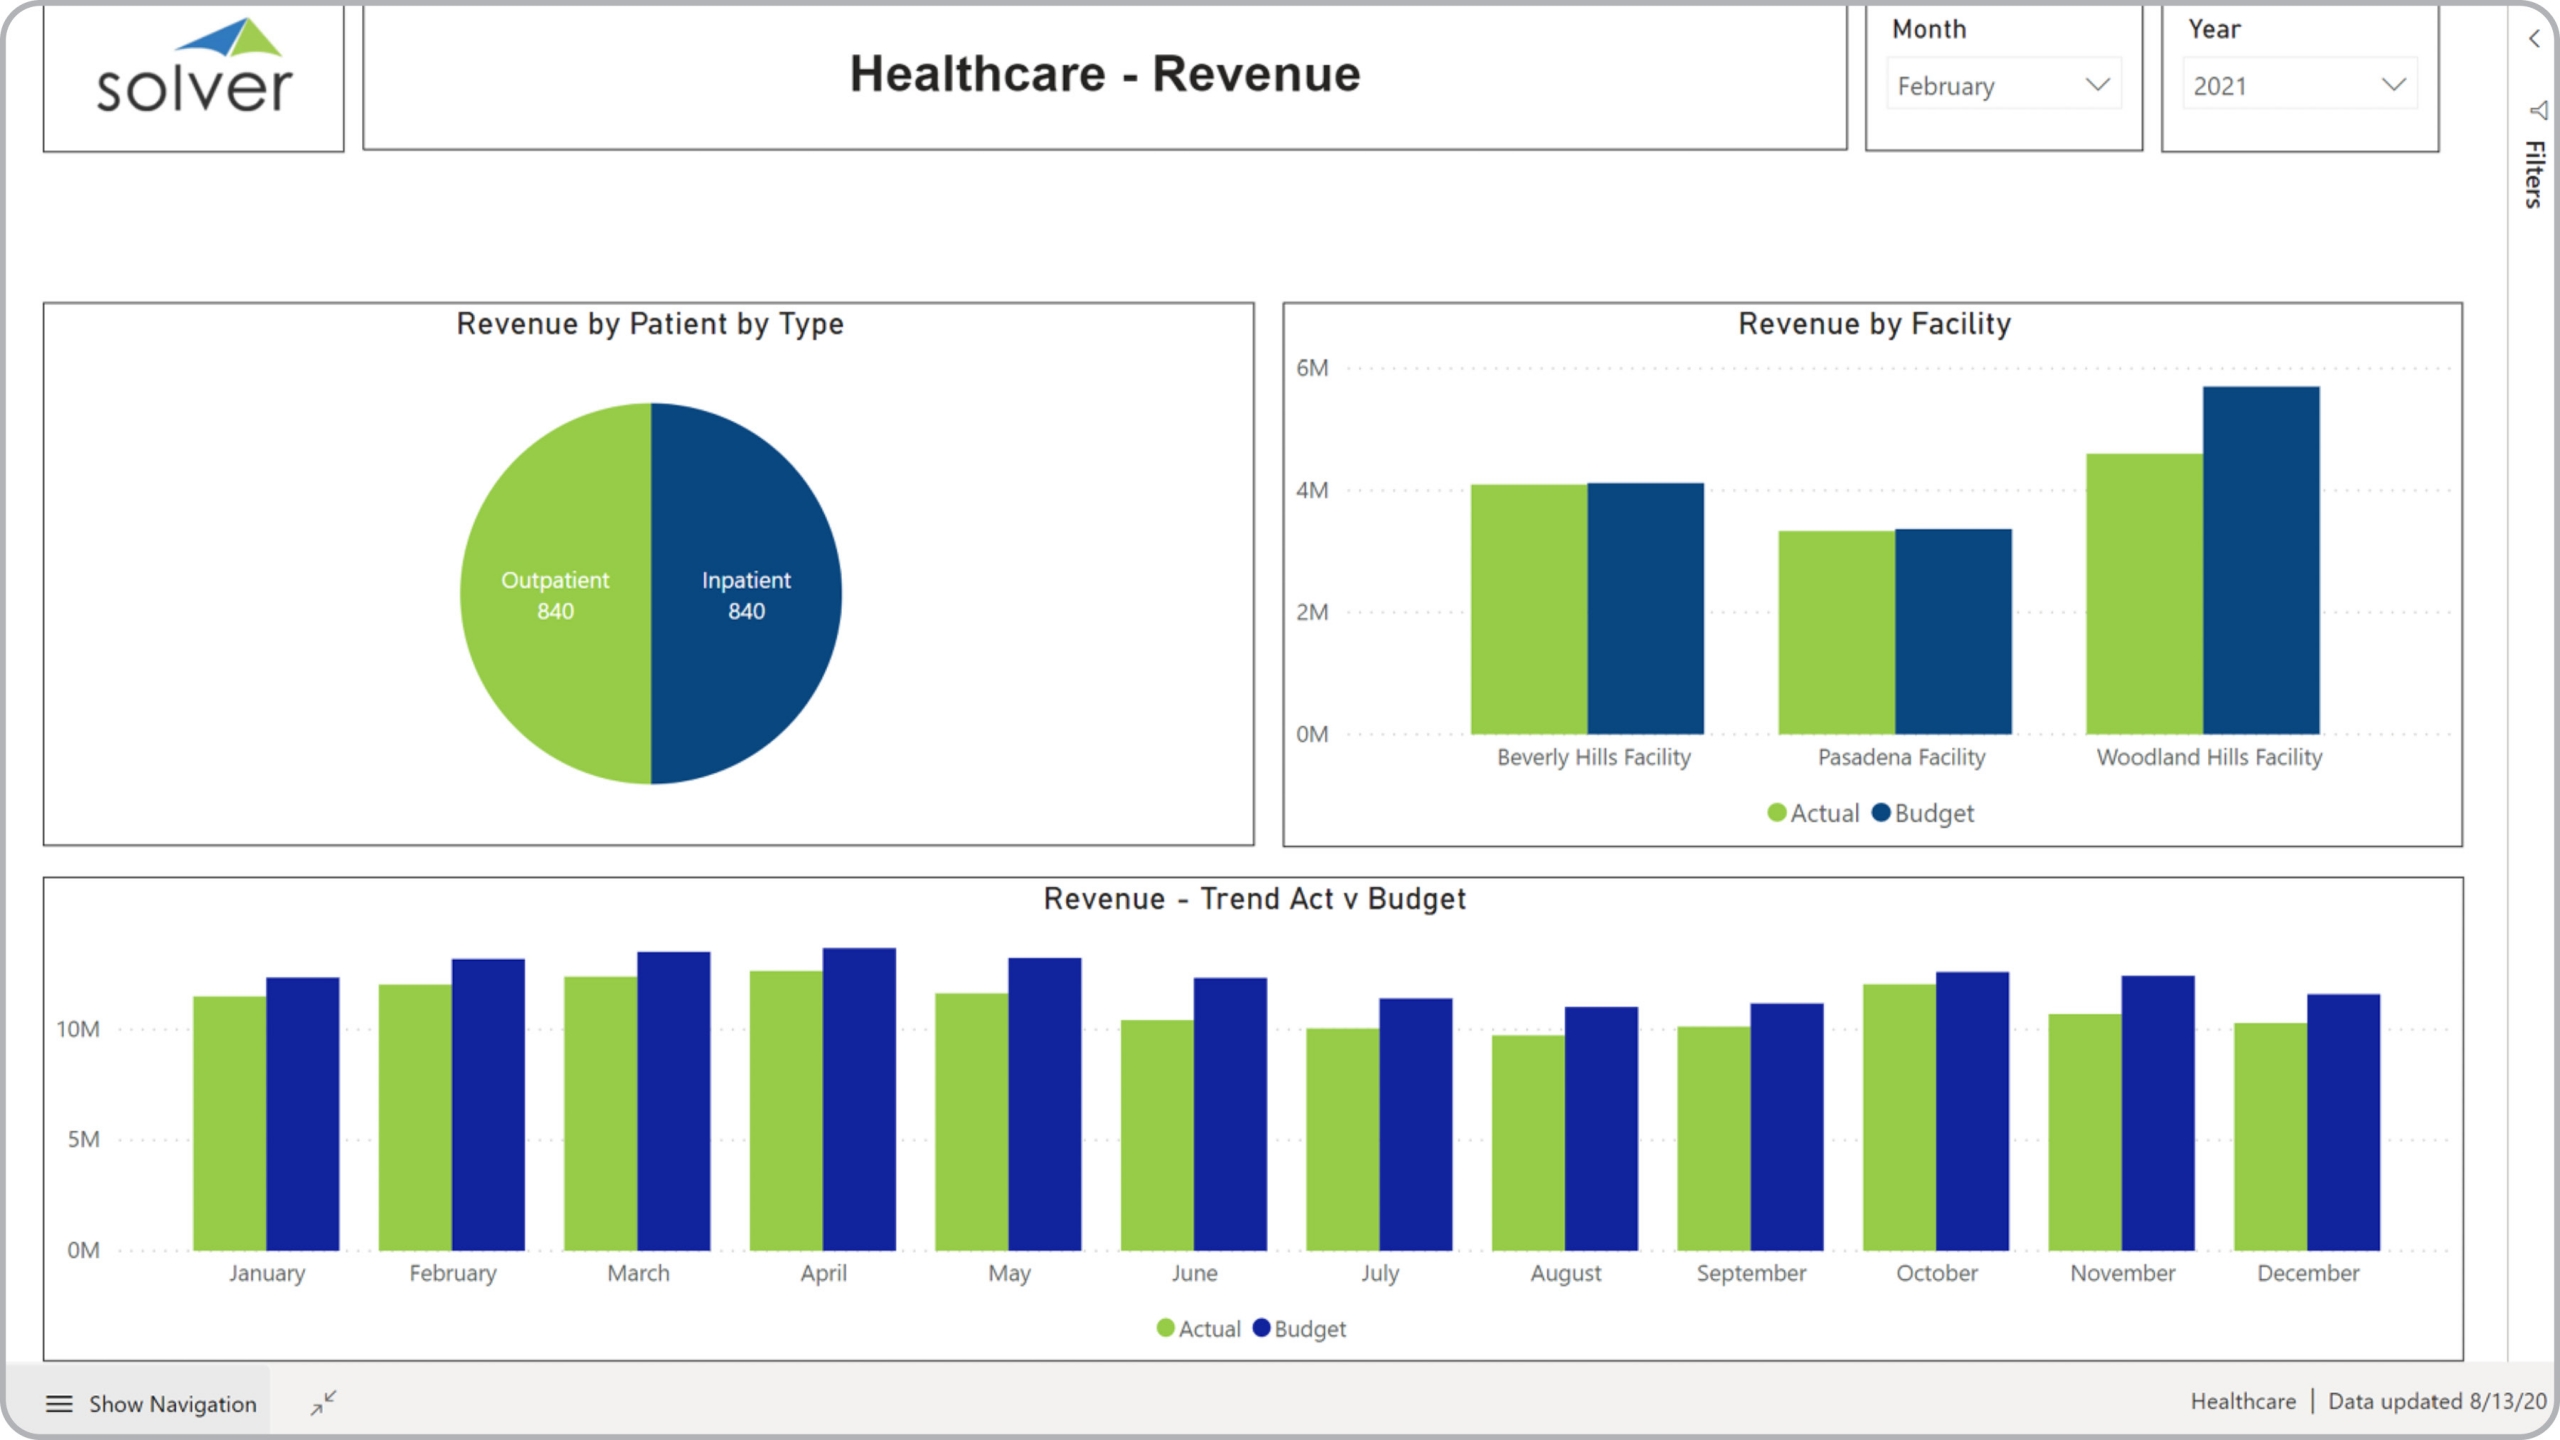
Revenue Dashboard for Healthcare Providers
What is a Revenue Dashboard ? Revenue Dashboards for healthcare providers are considered ...
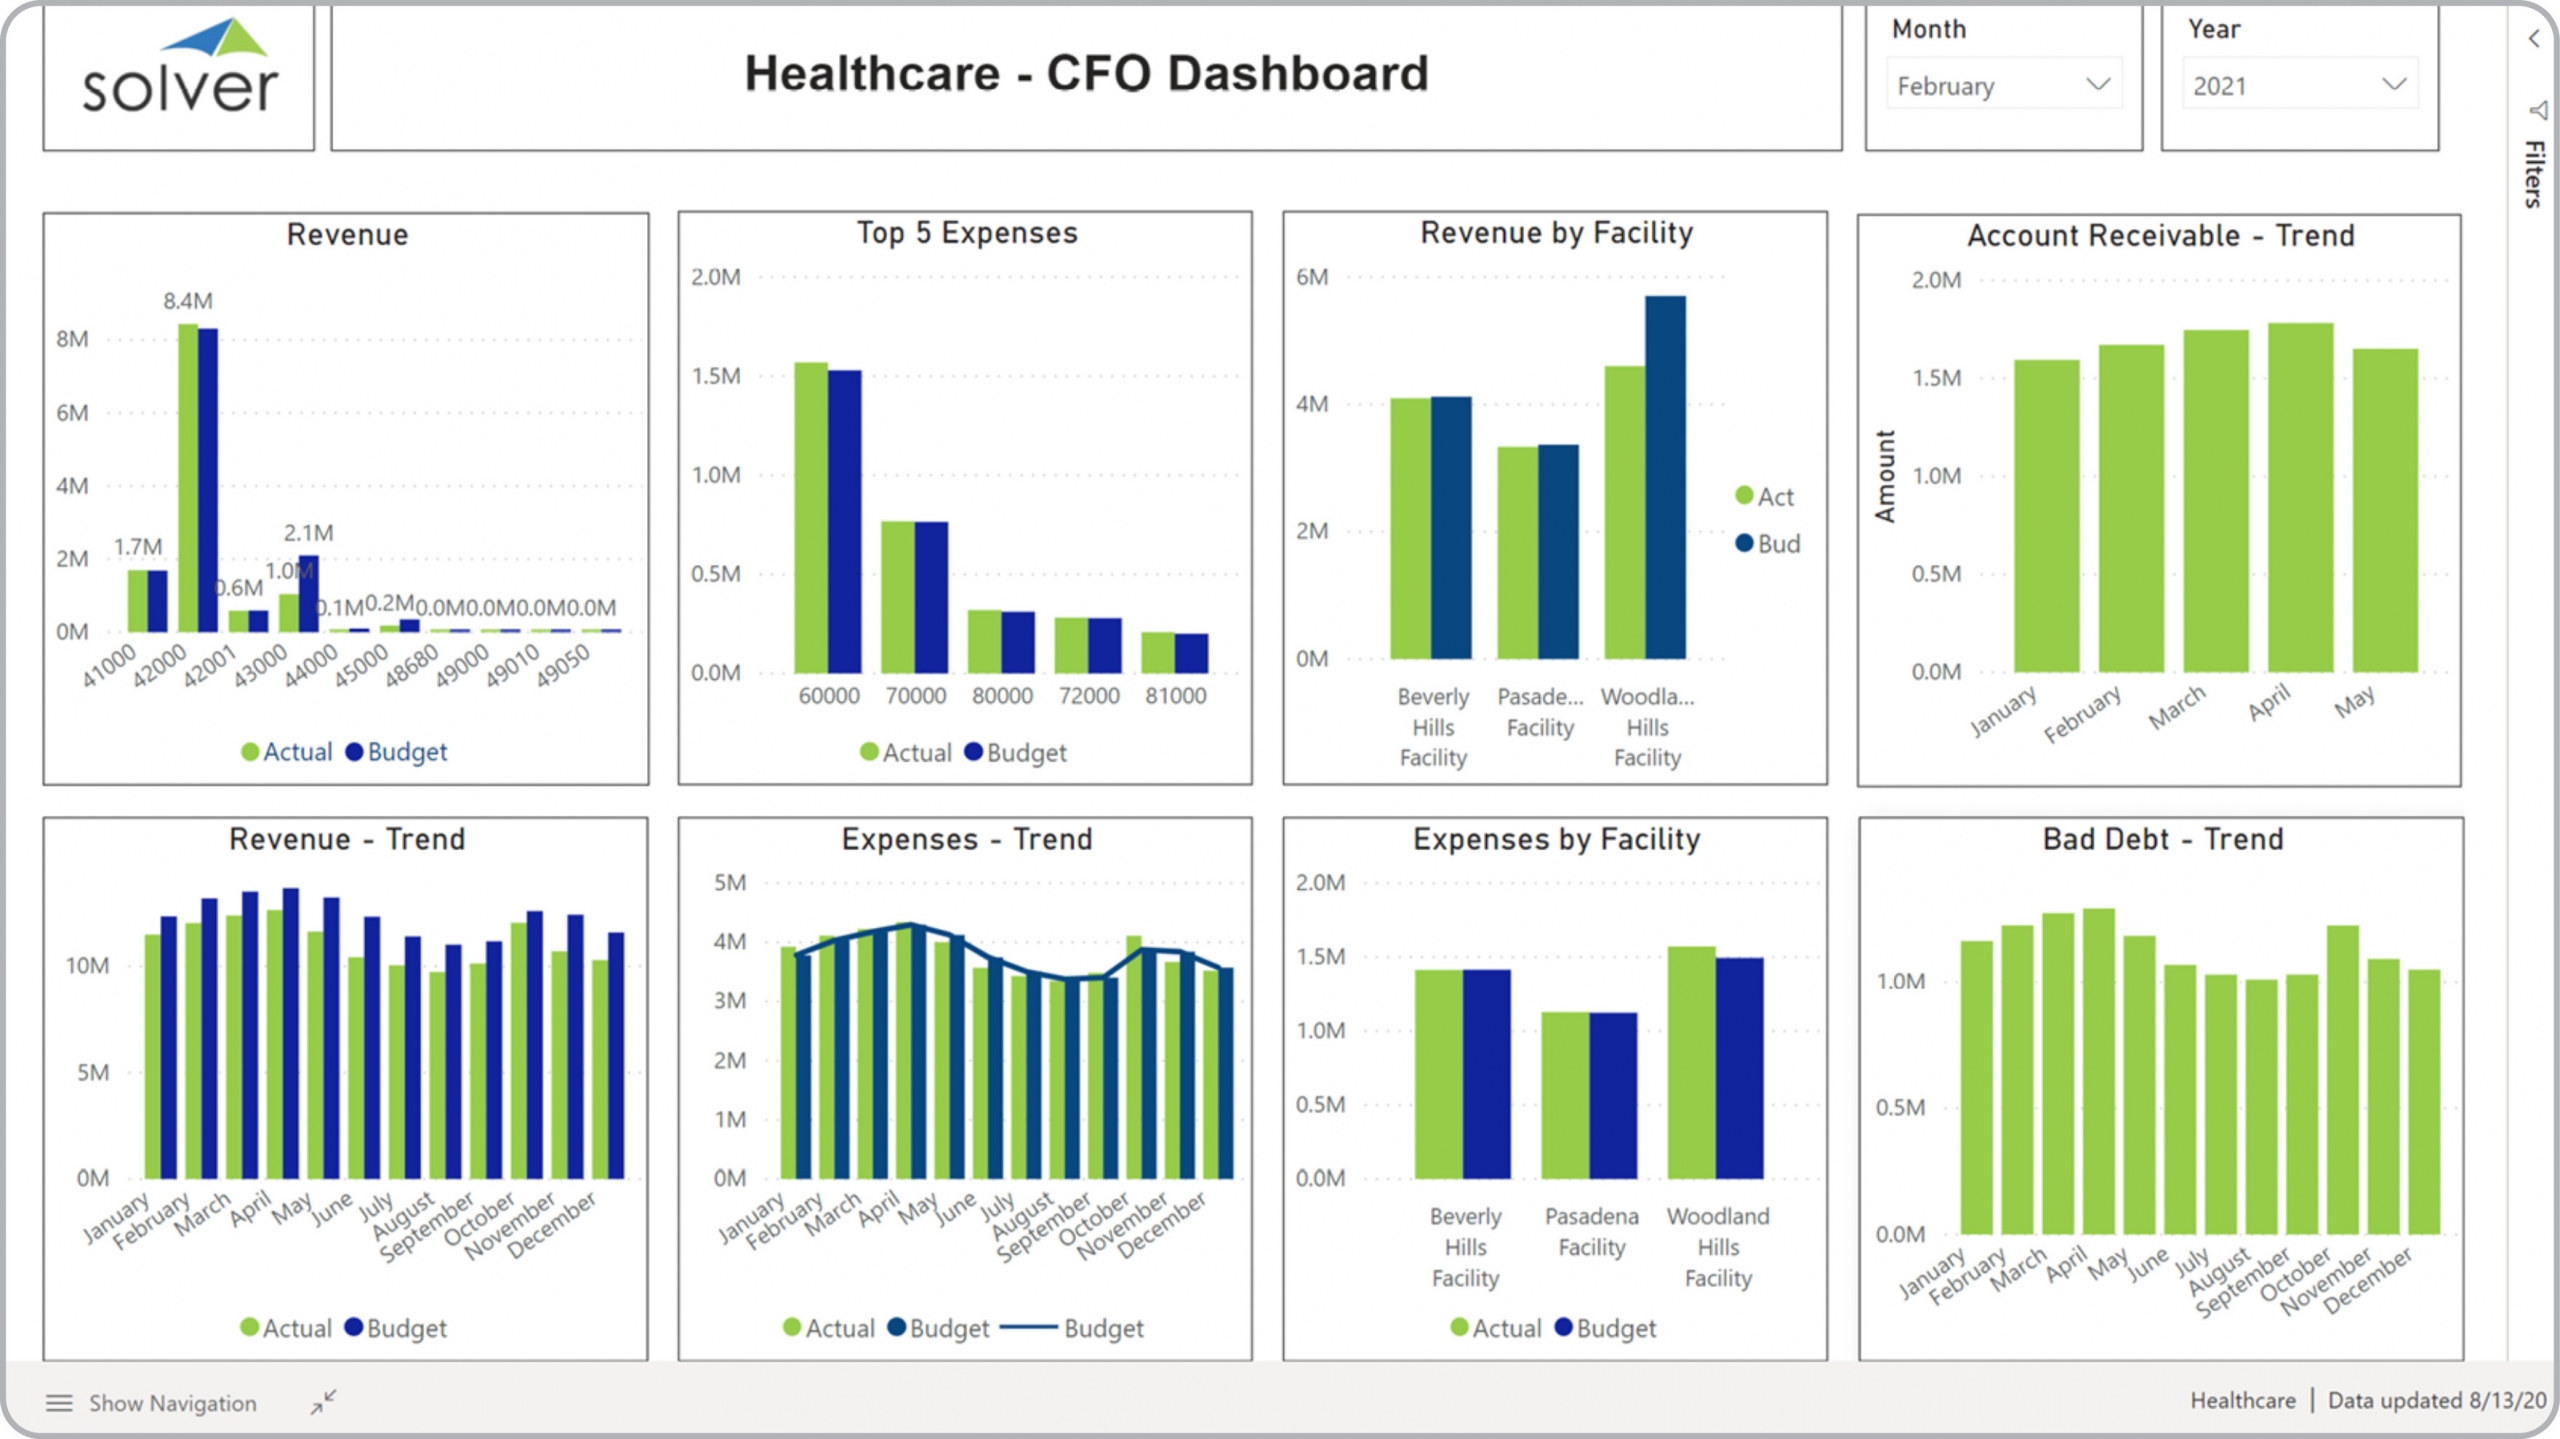
CFO Dashboard for Healthcare Providers
What is a CFO Dashboard for Healthcare Providers ? CFO Dashboards are considered financial analysis ...
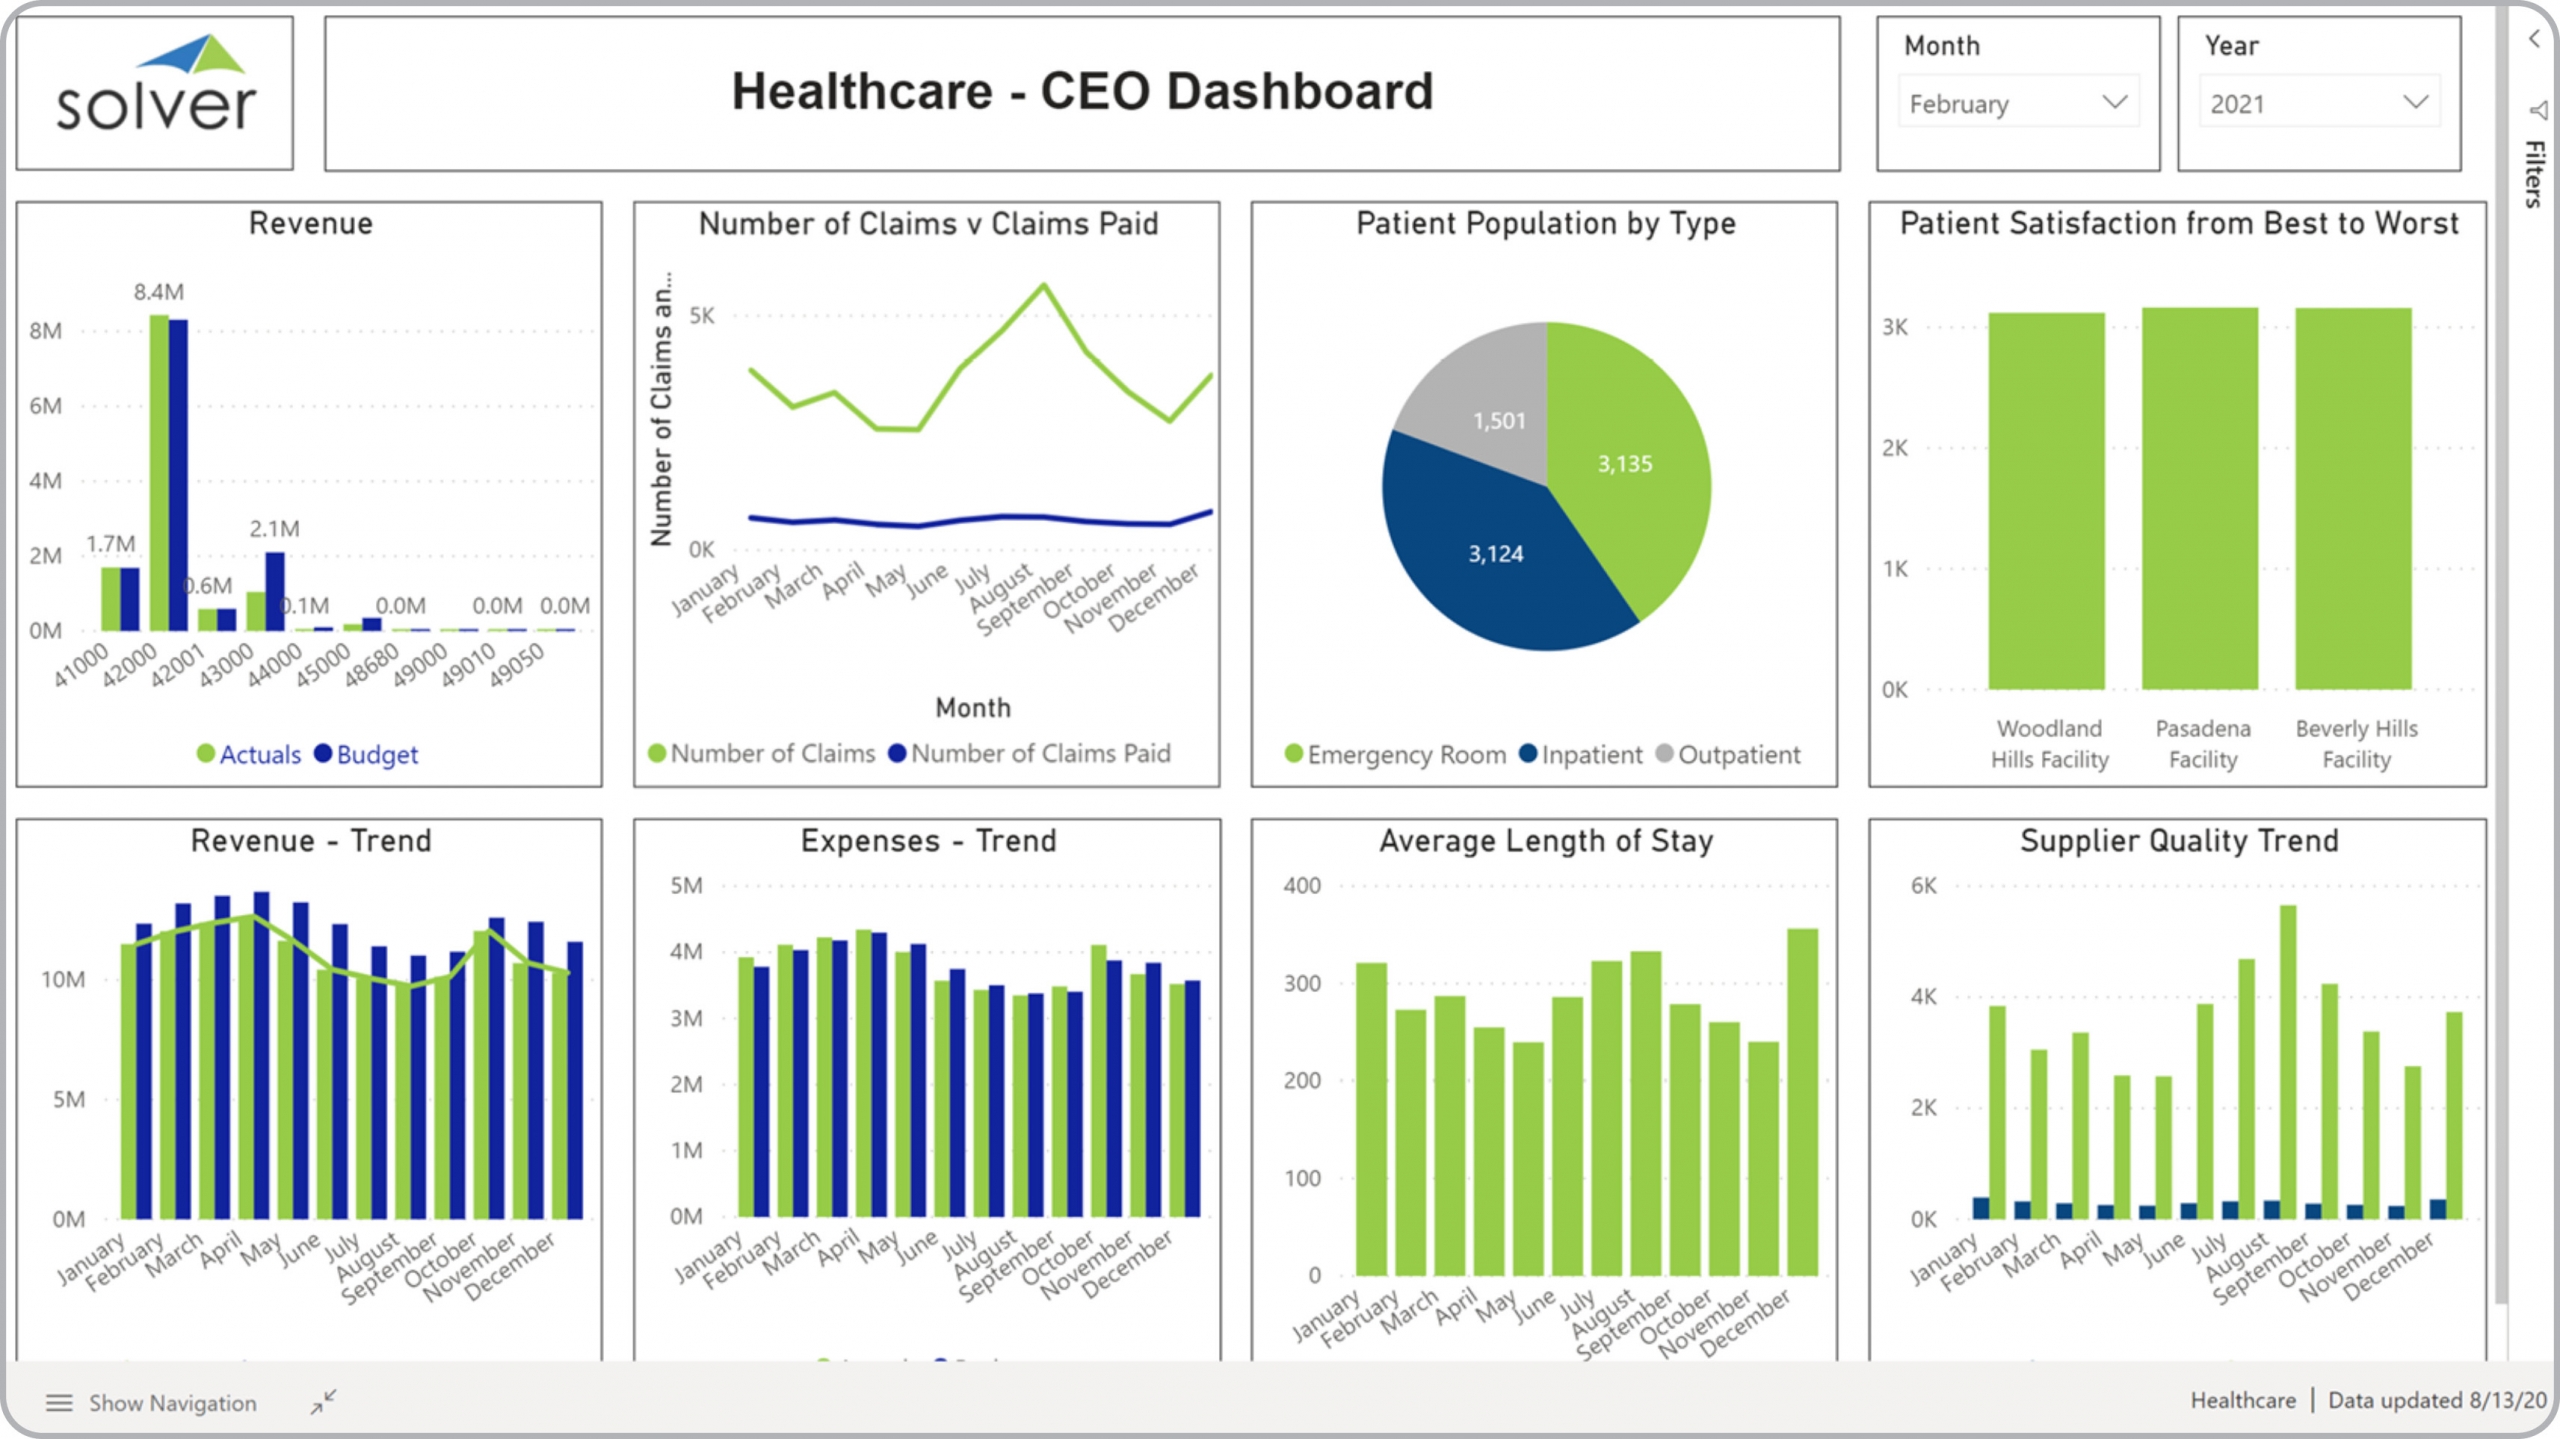
CEO Dashboard for Healthcare Providers
What is a CEO Dashboard for Healthcare Providers ? CEO Dashboards are considered executive business ...
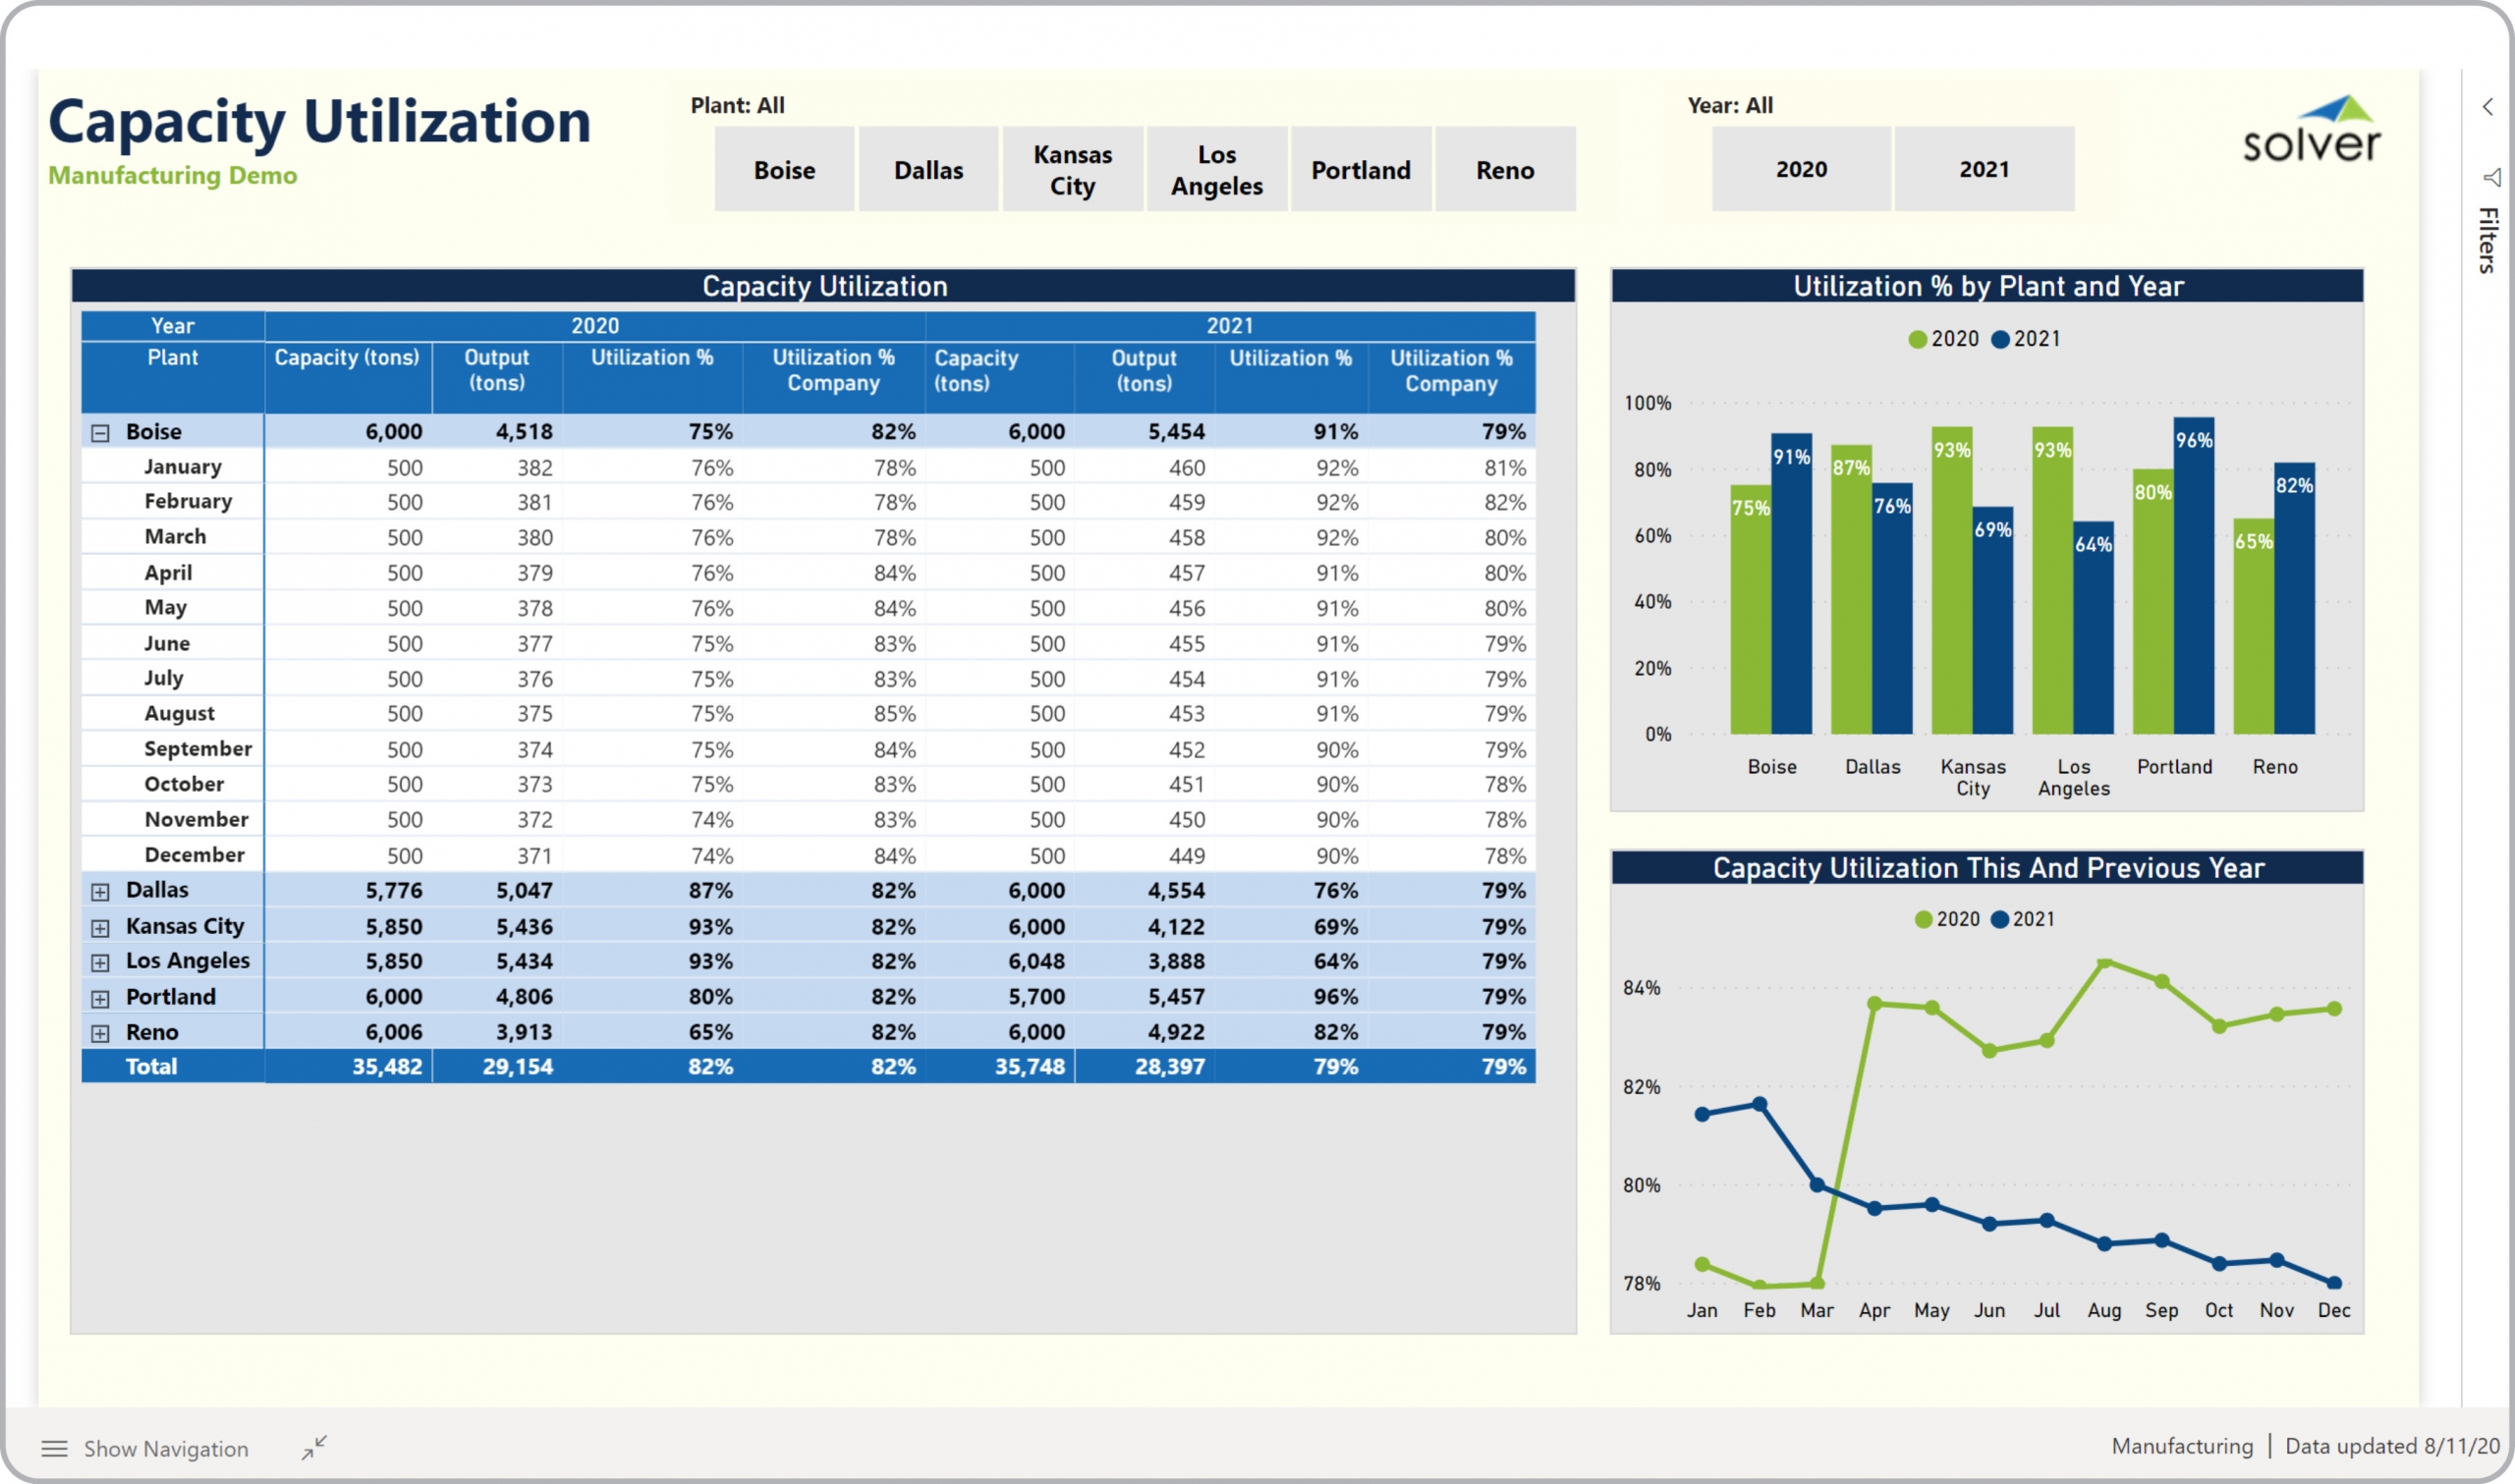
Plant Capacity Utilization Dashboard for a Manufacturing Company
What is a Plant Capacity Utilization Dashboard ? Capacity Utilization Dashboards are considered ...
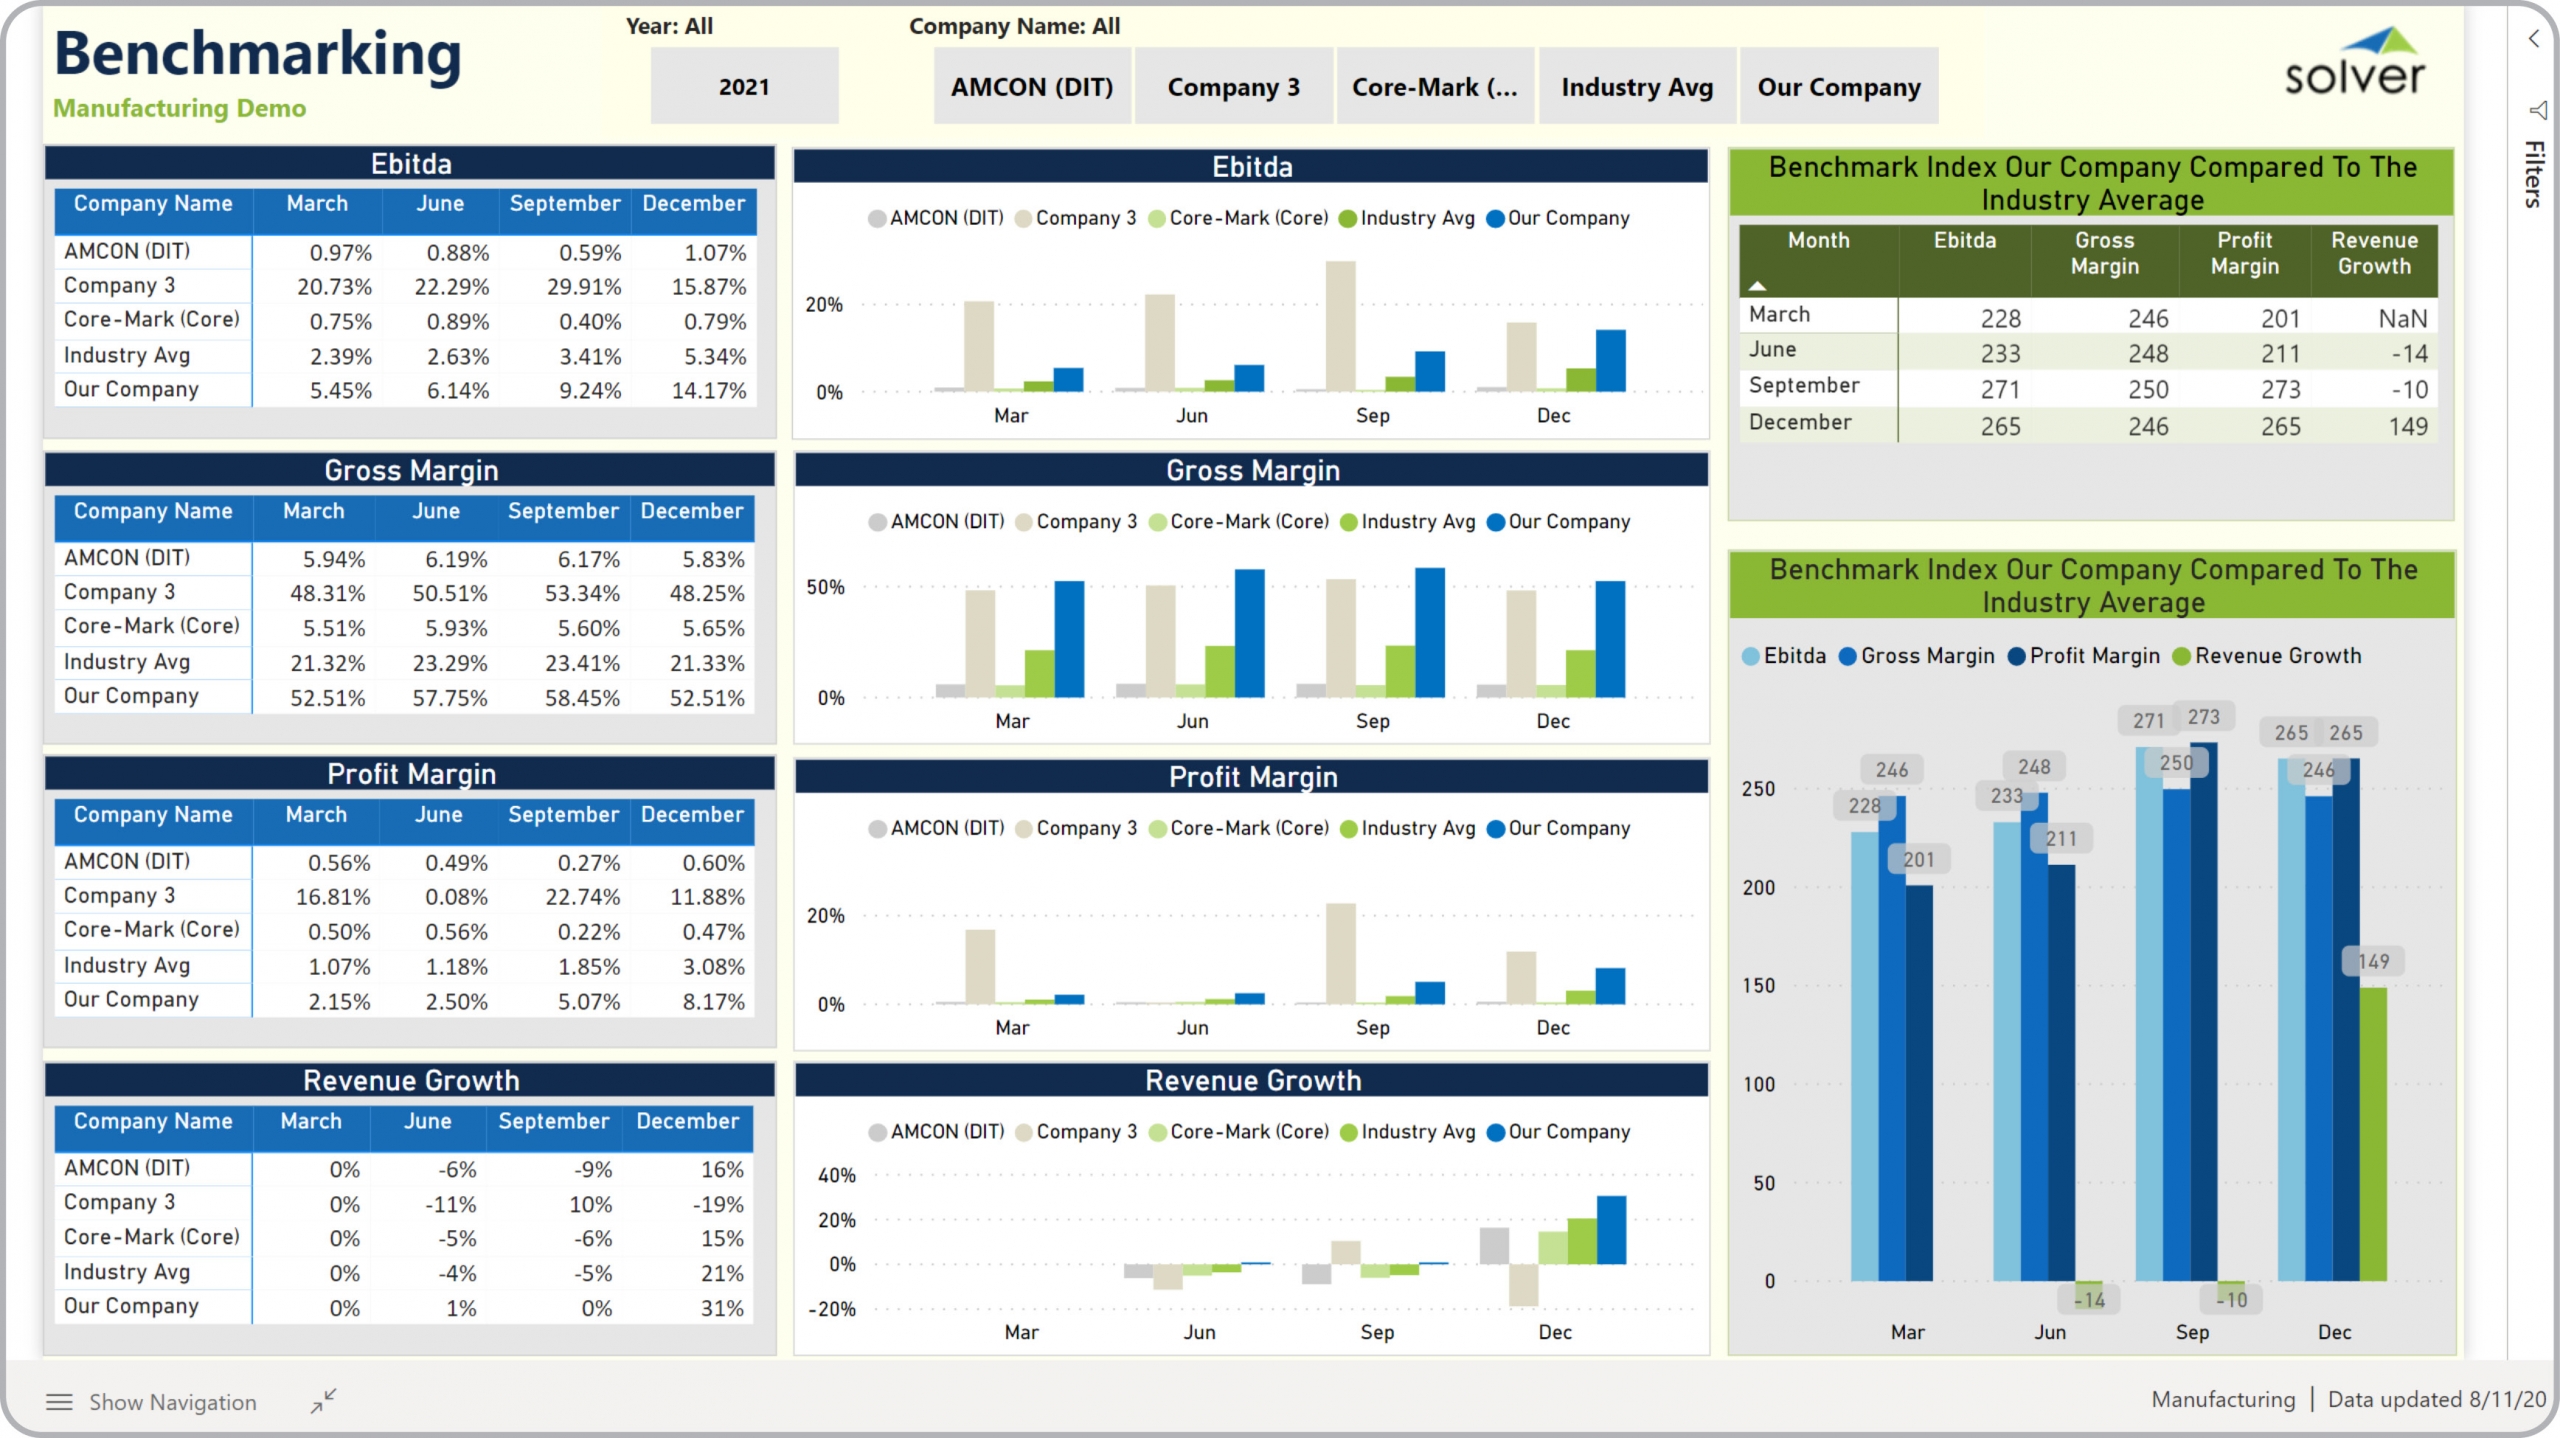
Benchmarking Dashboard for Manufacturing Companies
What is a Benchmarking Dashboard ? Benchmarking dashboards are considered competitive comparison ...
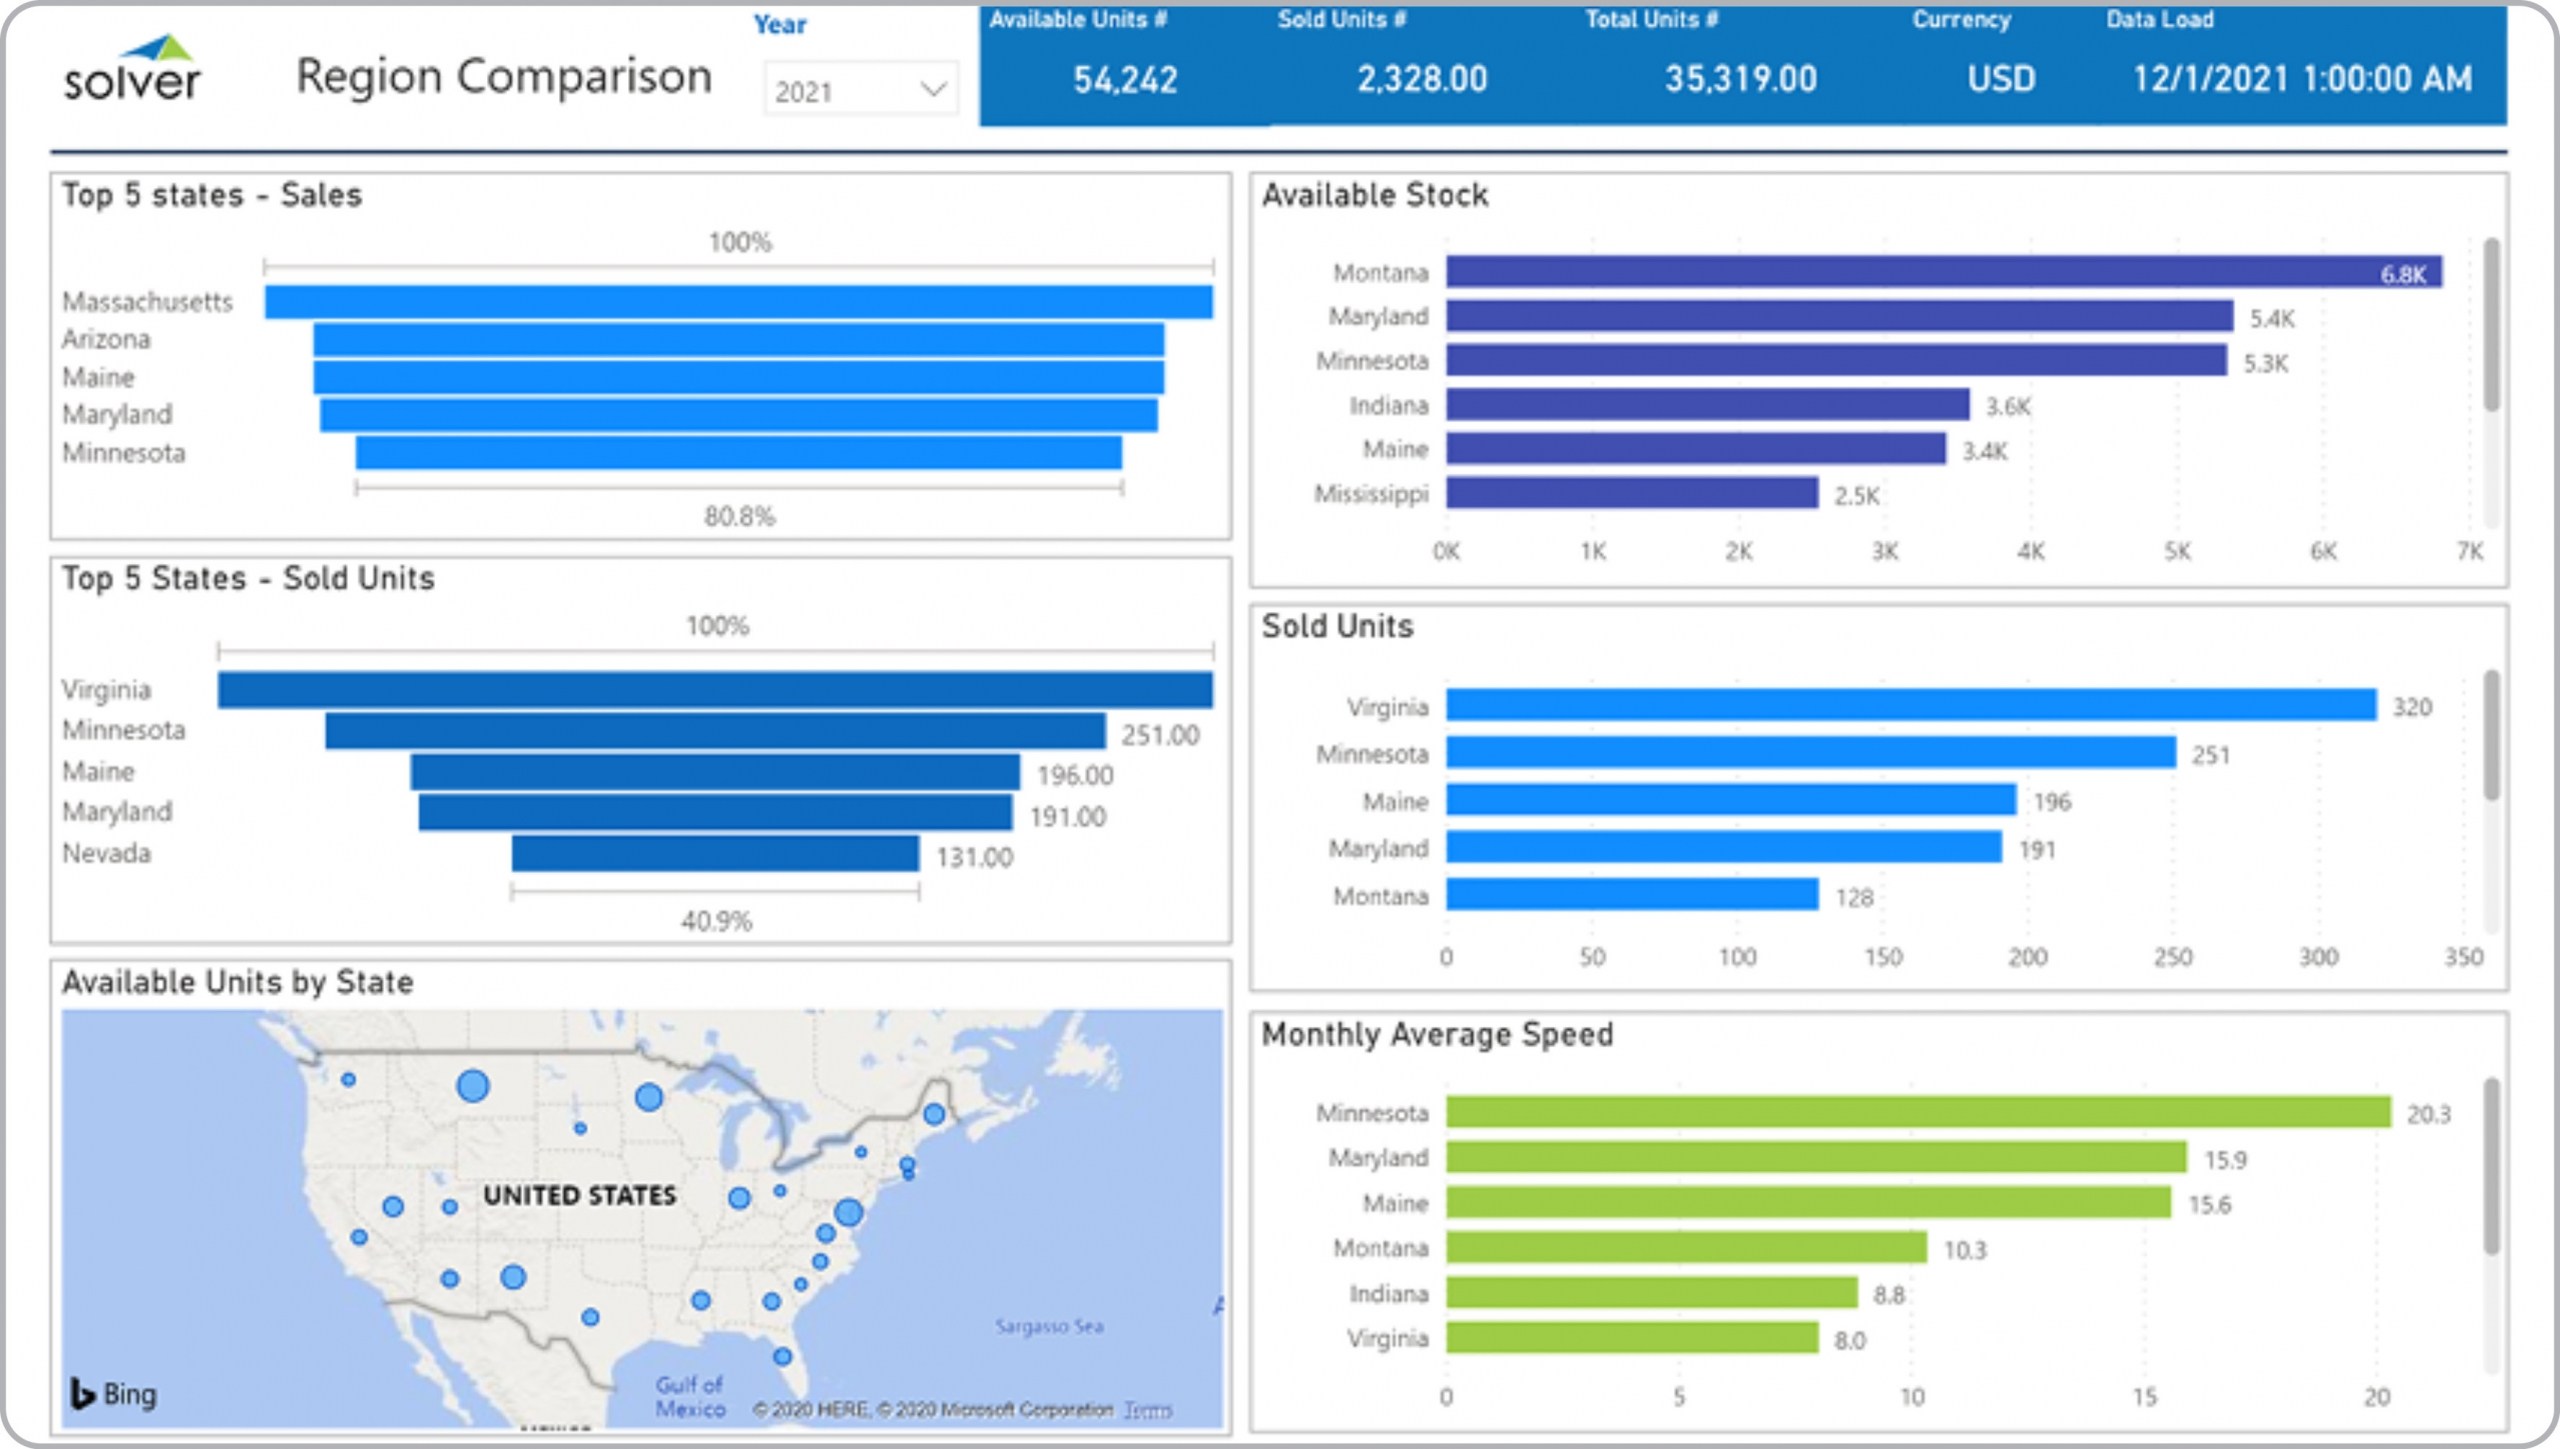
Regional Sales KPI Dashboard for Real Estate Companies
What is a Regional Sales KPI Dashboard ? Geographic focused real estate sales dashboards are ...
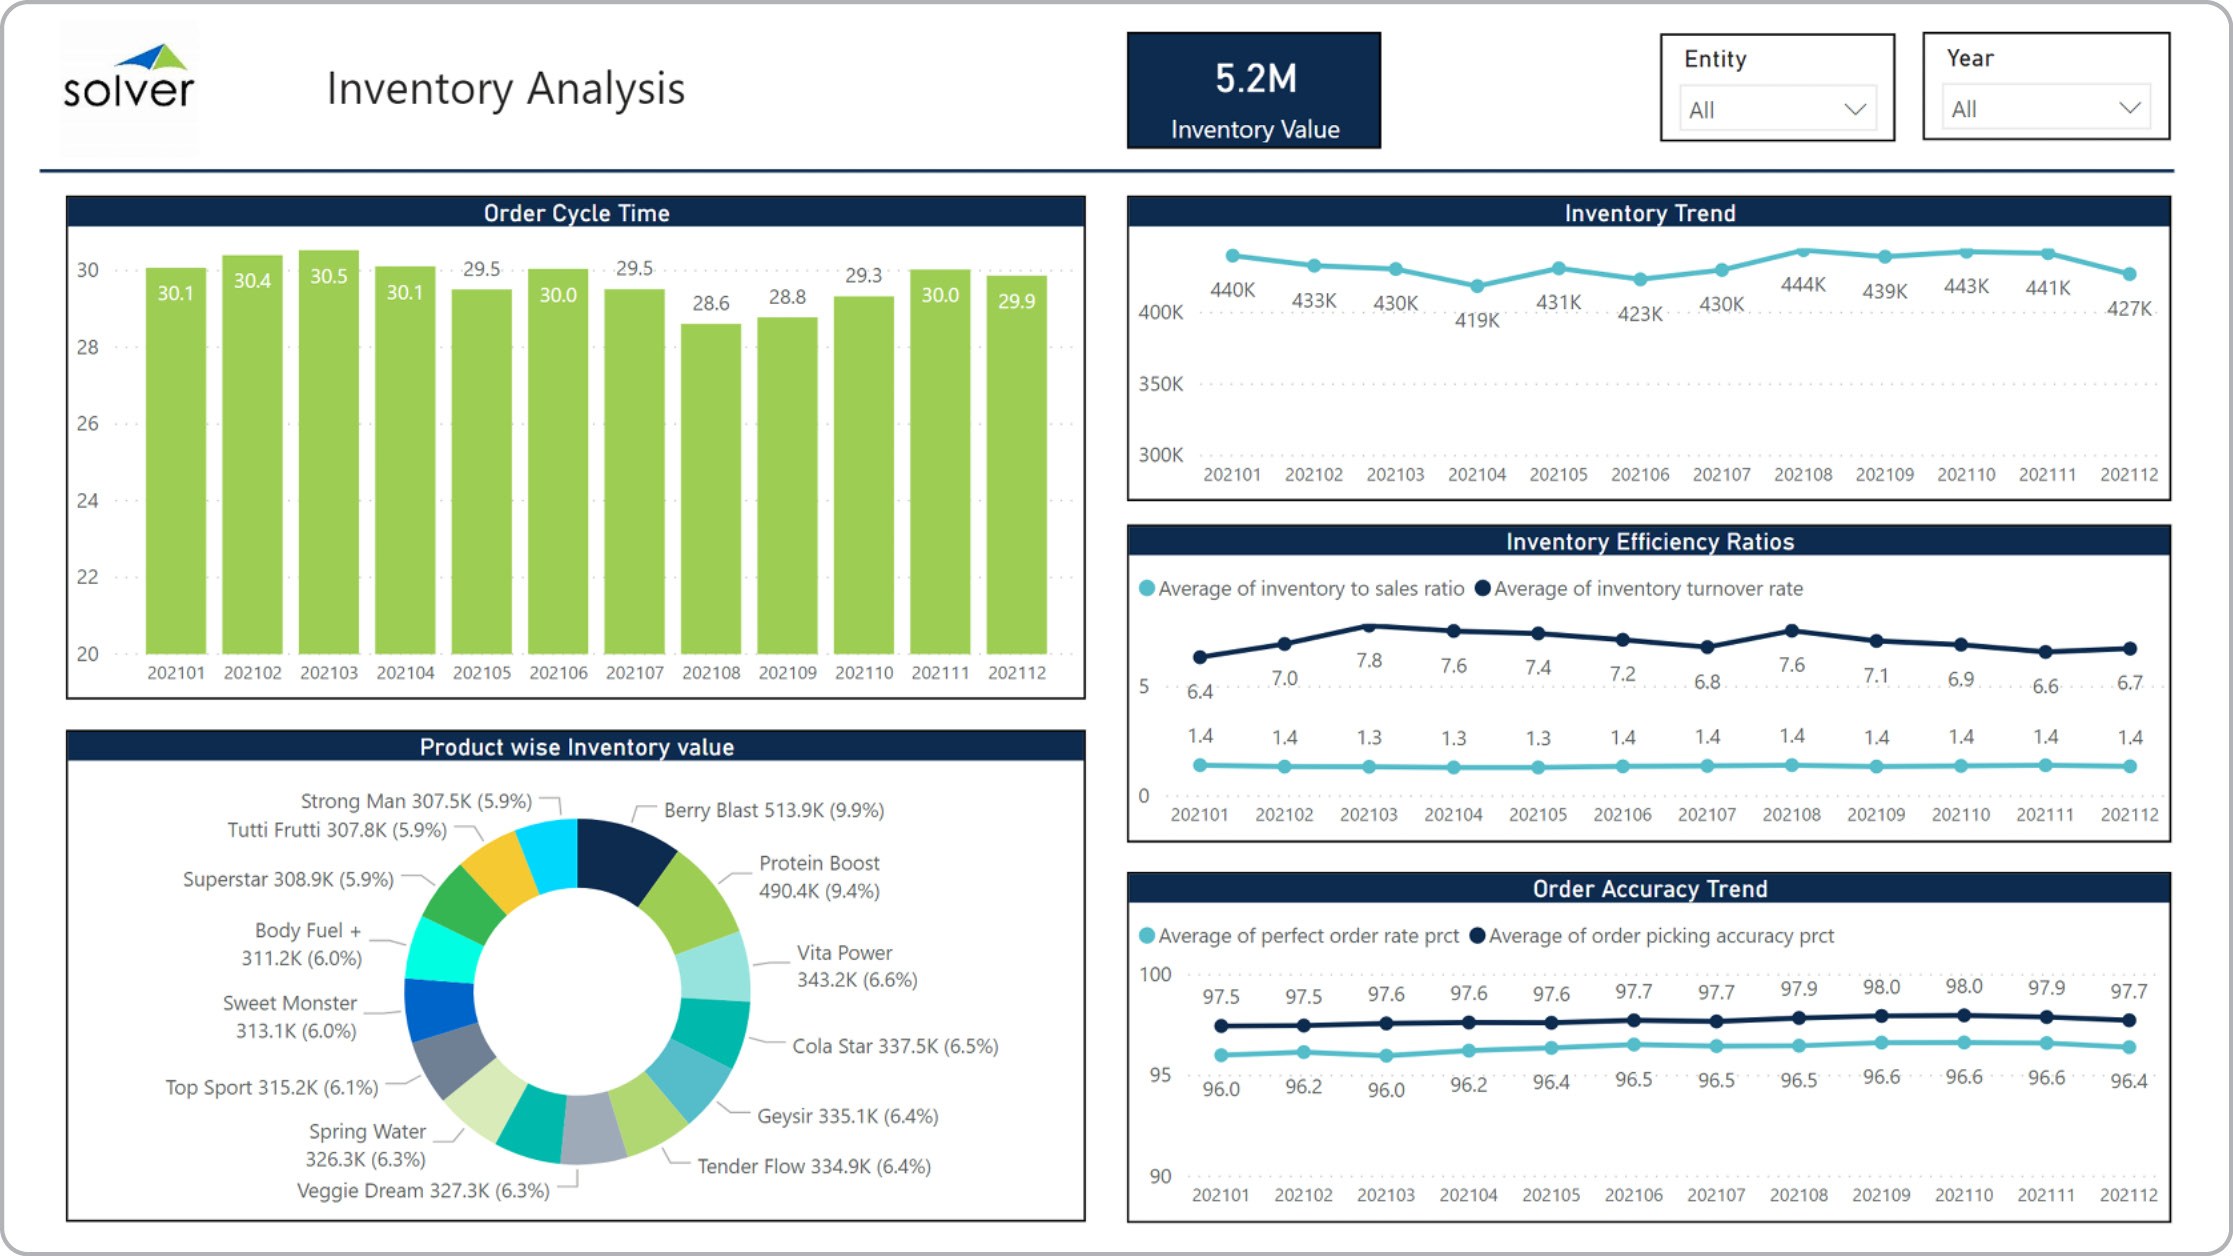
Inventory Analysis Dashboard for Distributors
What is a Inventory Analysis Dashboard ? Inventory Dashboards are considered operational analysis ...
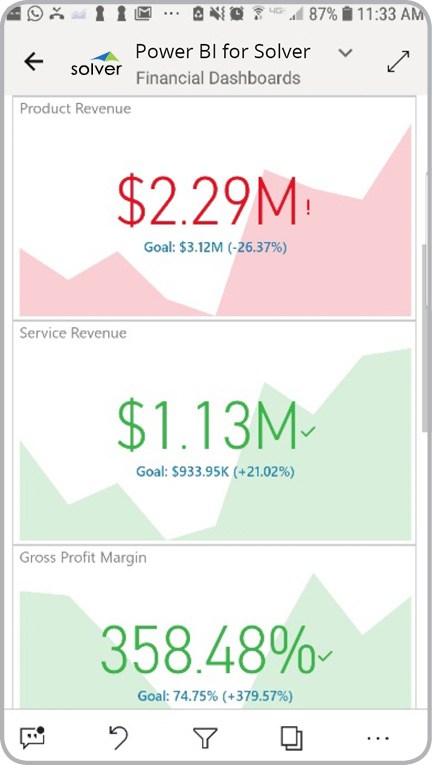
Profitability KPI Dashboard for Mobile Phones
What is Profitability KPIs for Mobile Phones ? Mobile apps that display profitability KPIs and ...
Revenue KPI Dashboard for Mobile Phone Users
What is a Revenue KPI dashboard for Mobile Phones ? Mobile apps that display revenue KPIs and ...
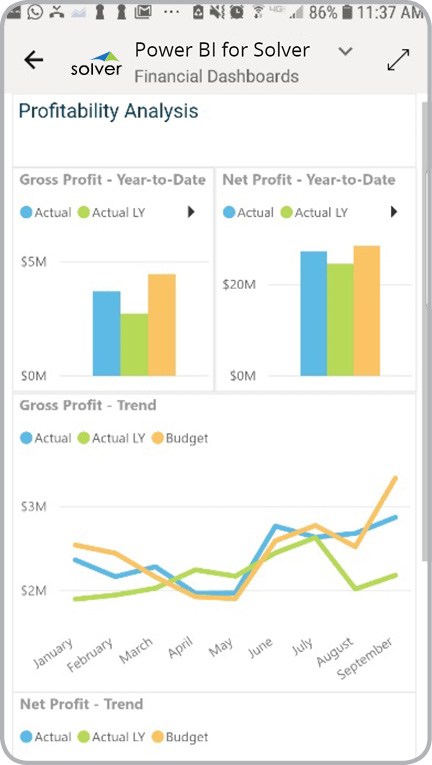
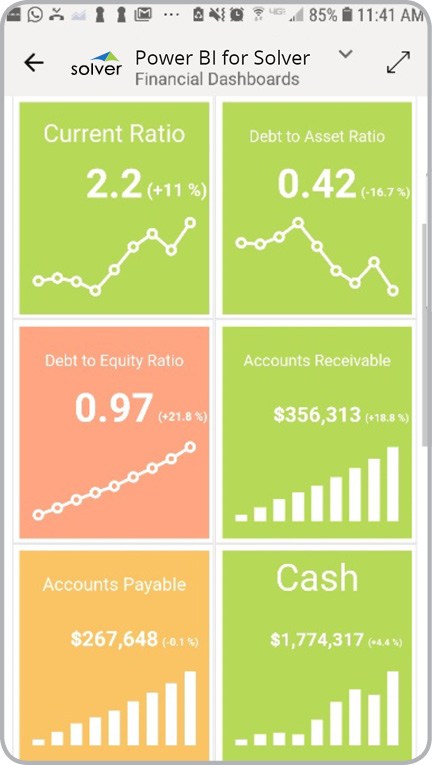
Financial KPI Dashboard for Mobile Phones
What is a Financial KPI Mobile App ? Mobile apps that display financial KPIs and charts are ...
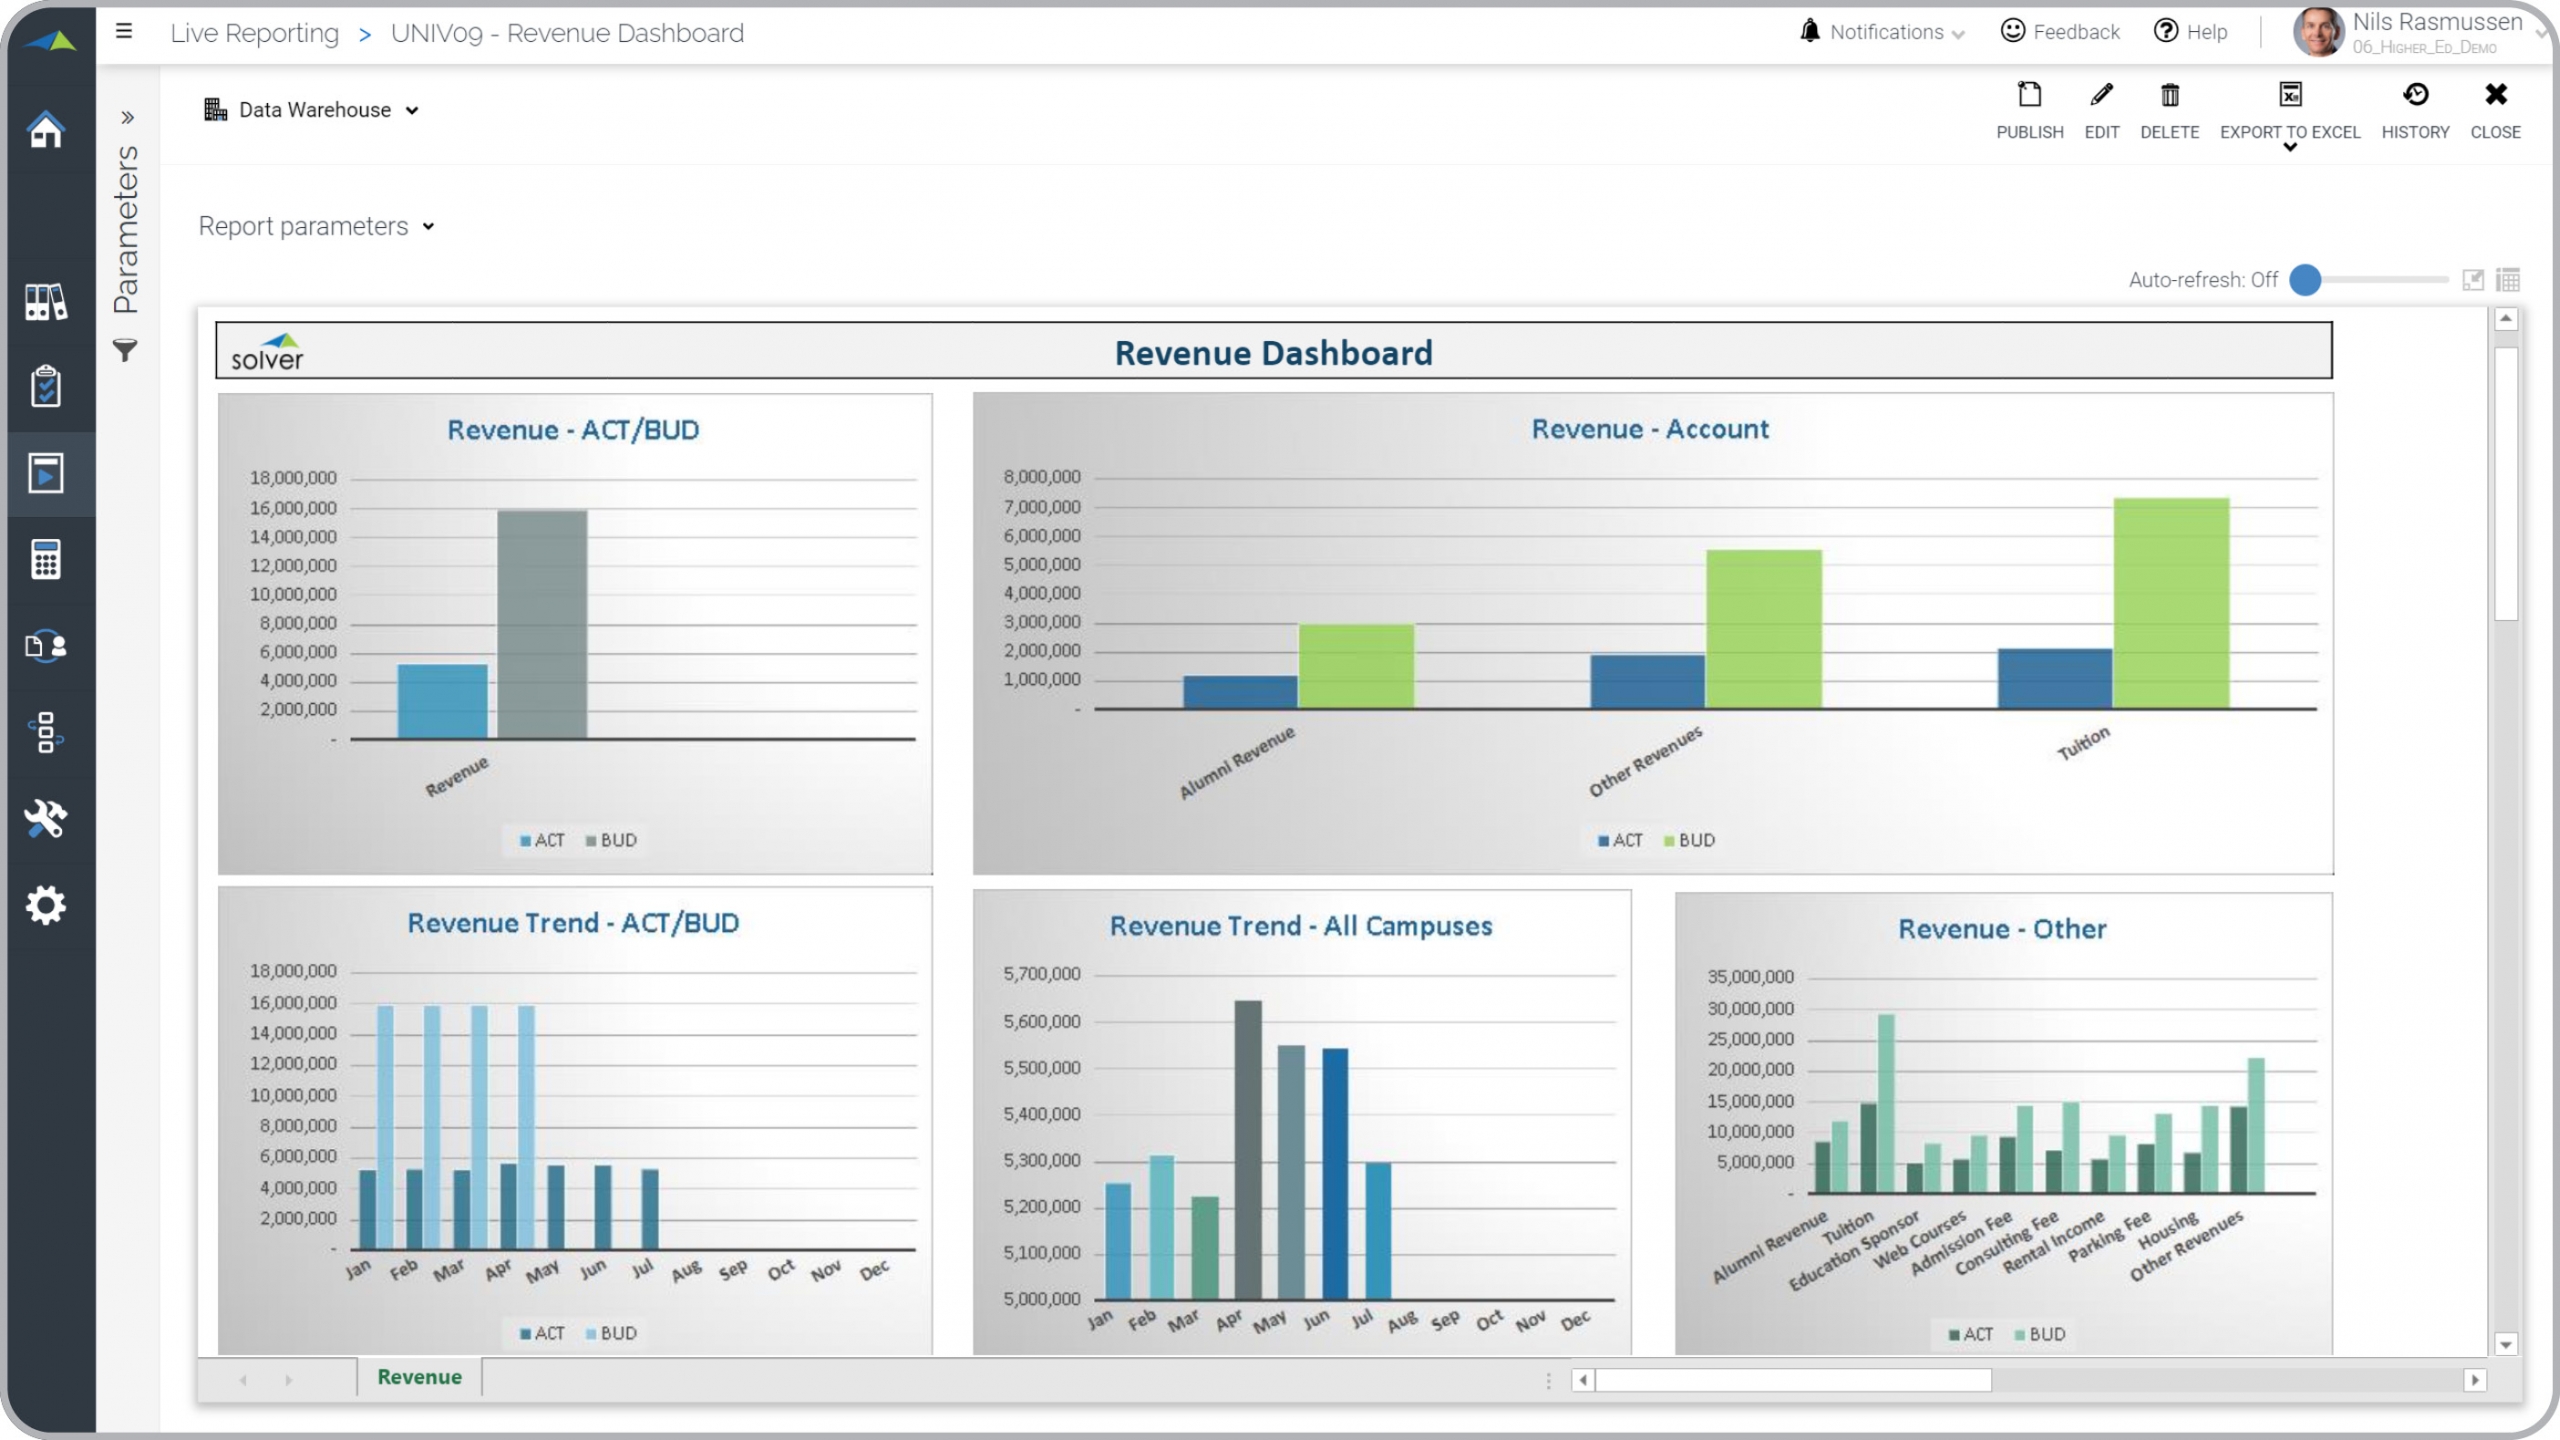
Higher Education Revenue Dashboard
What is a Higher Education Revenue Dashboard ? Revenue dashboards are considered executive analysis ...
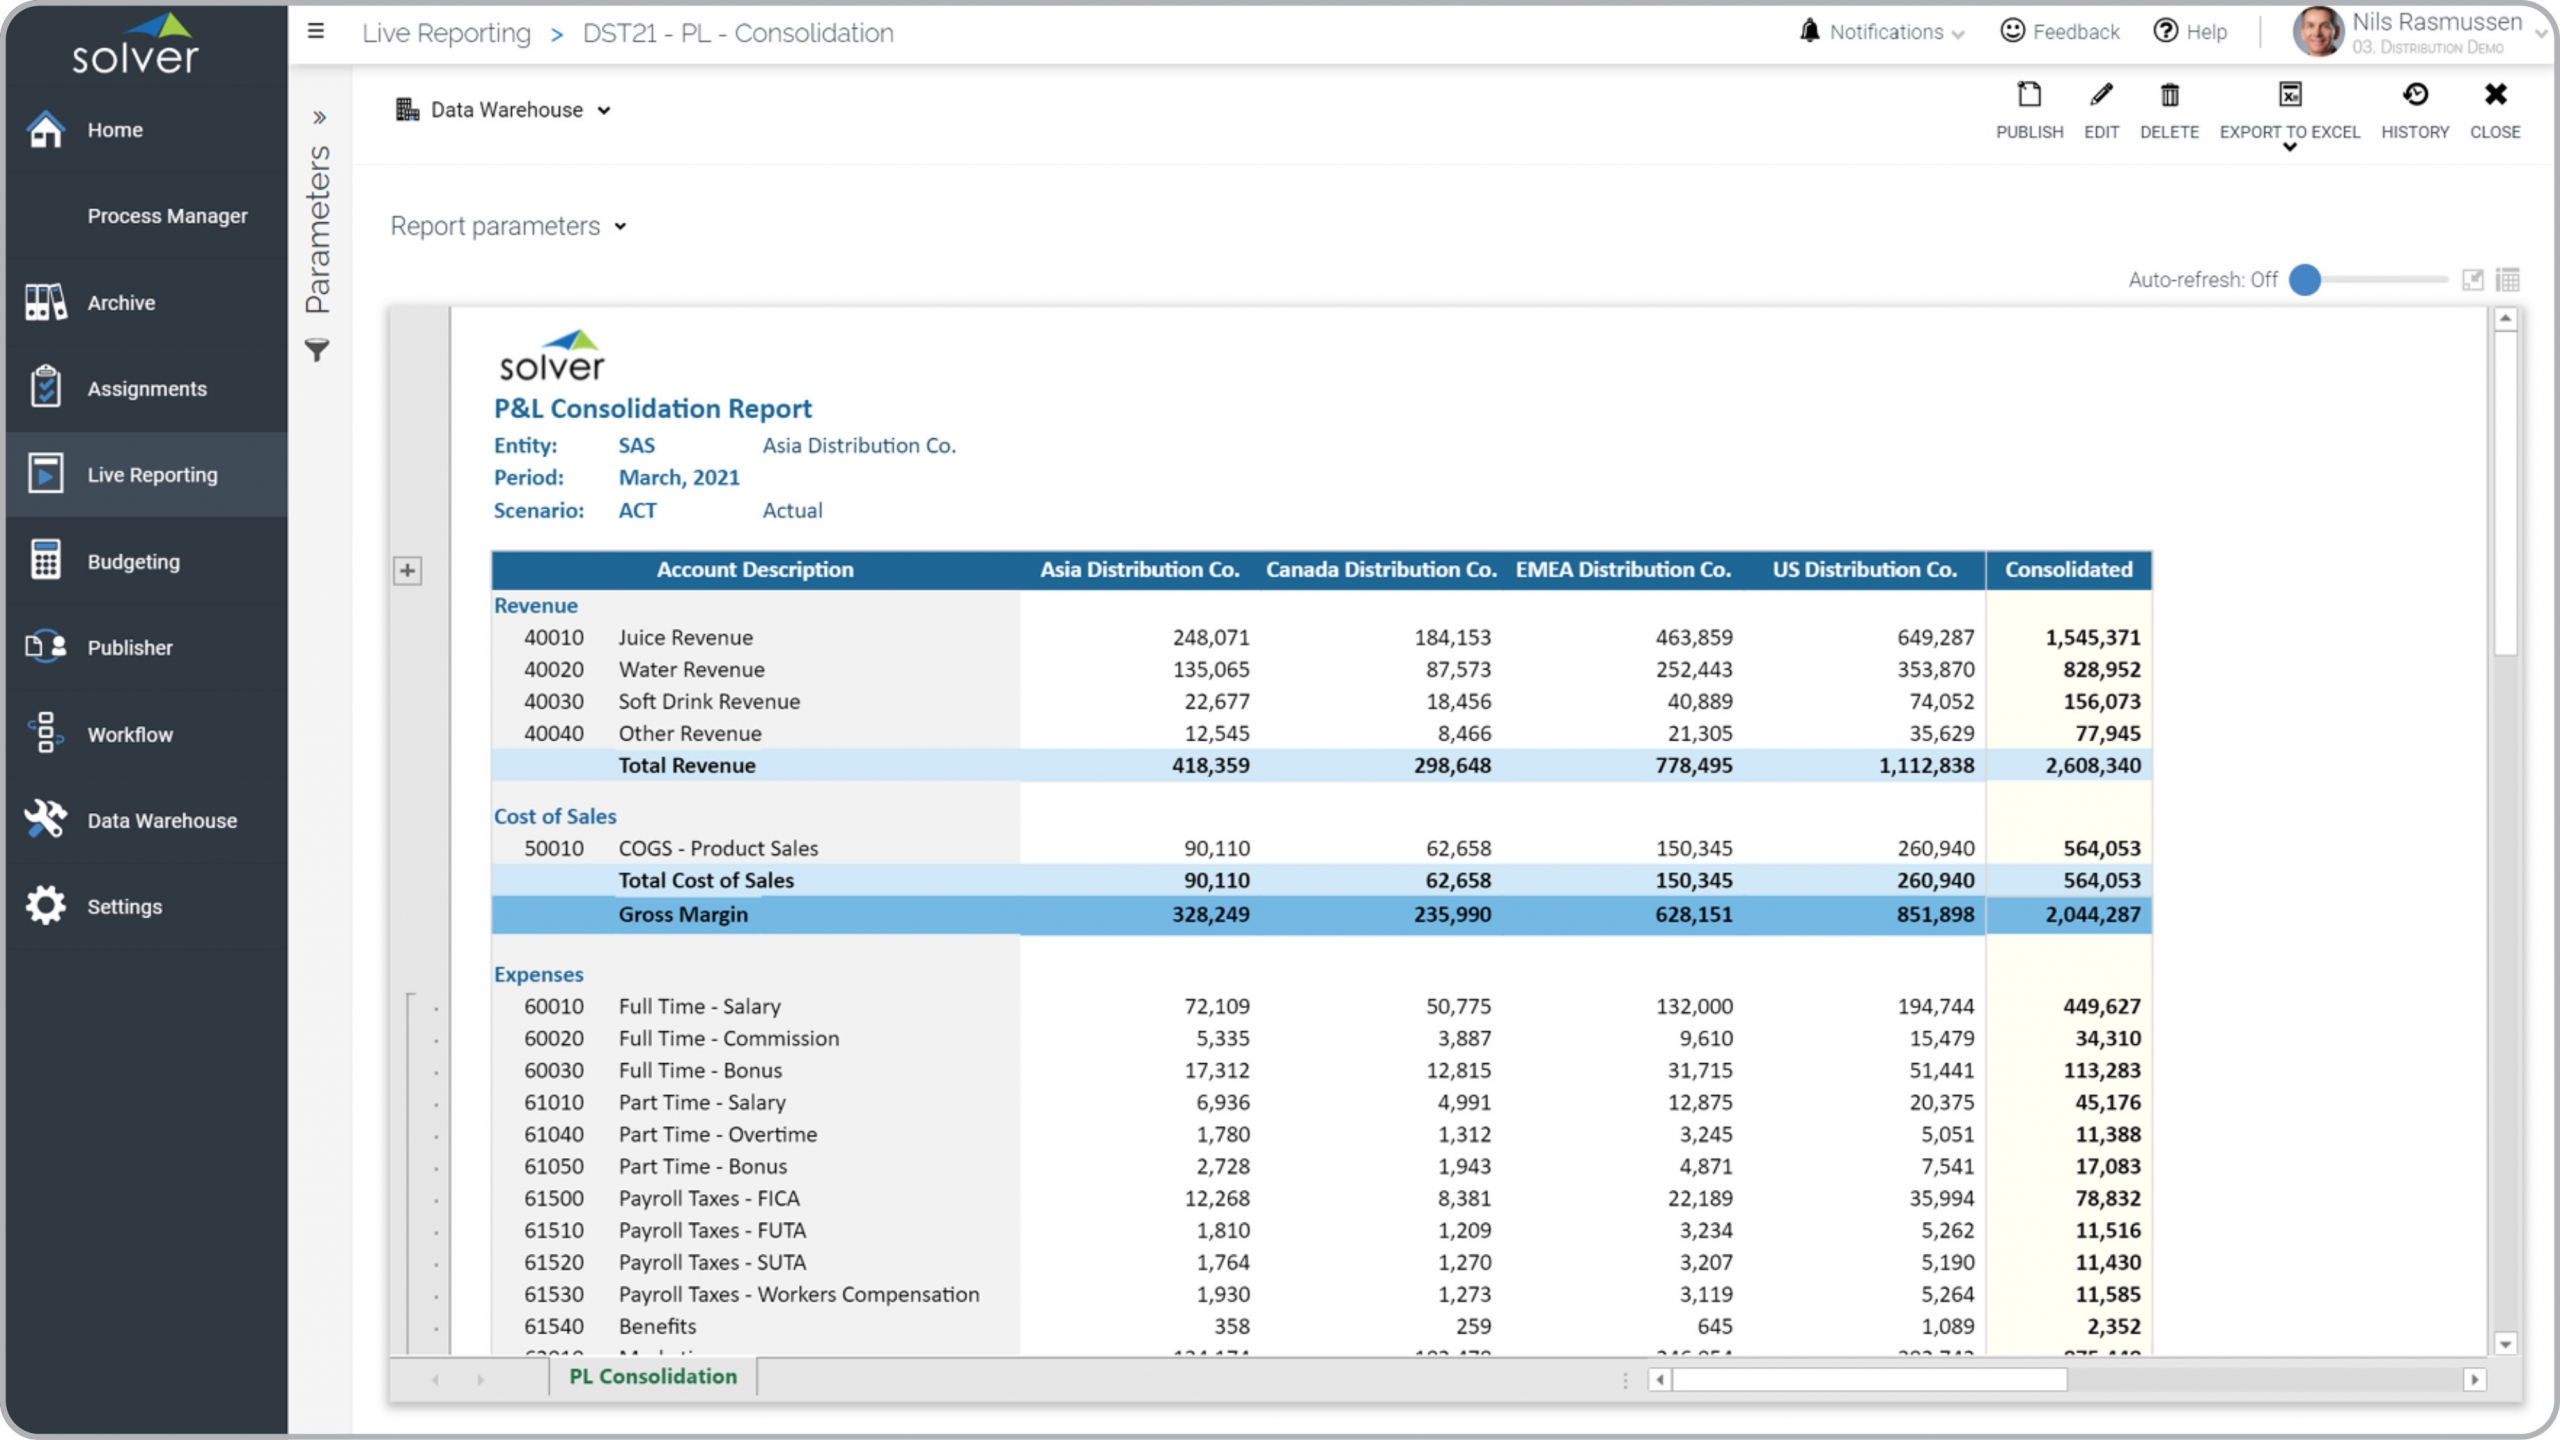
Profit & Loss Consolidation Report for a Distribution Company
What is a Profit & Loss Consolidation Report for a Distribution Company ? Profit & loss ...
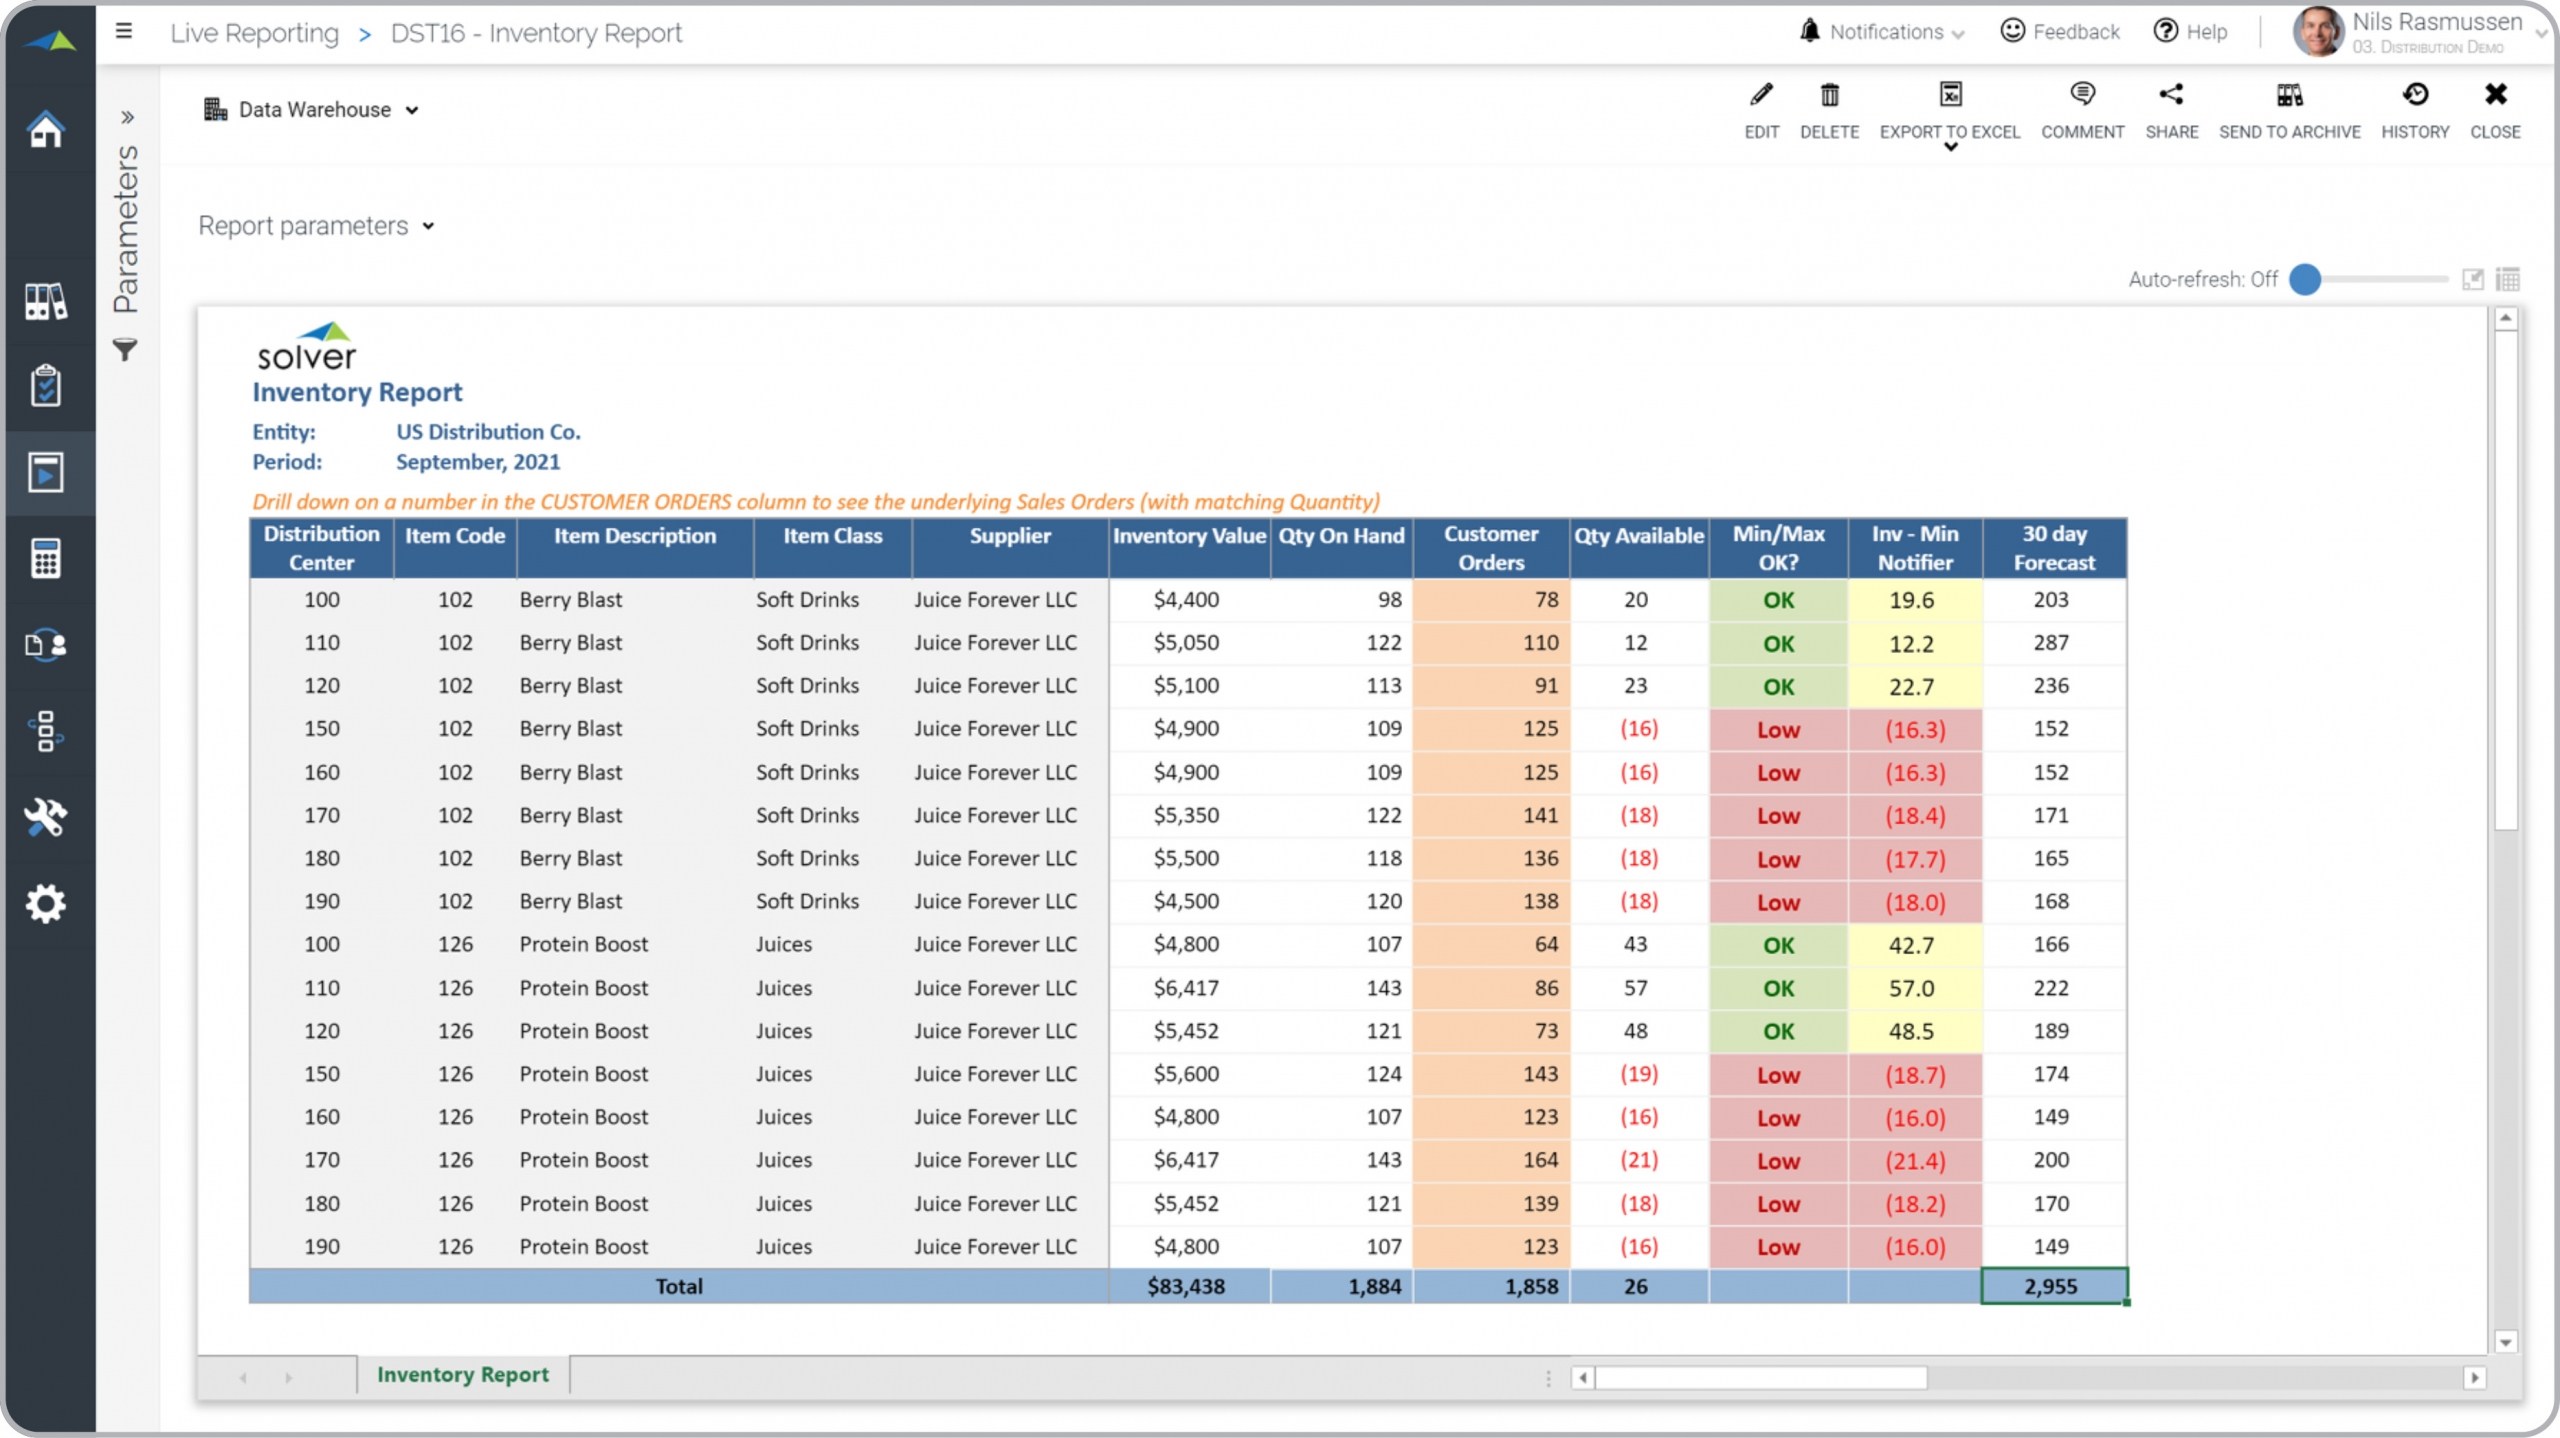
Inventory Analysis Report with Drill Down to Sales Orders
What is an Inventory Analysis Report with Drill Down to Sales Orders ? Inventory Analysis Report ...
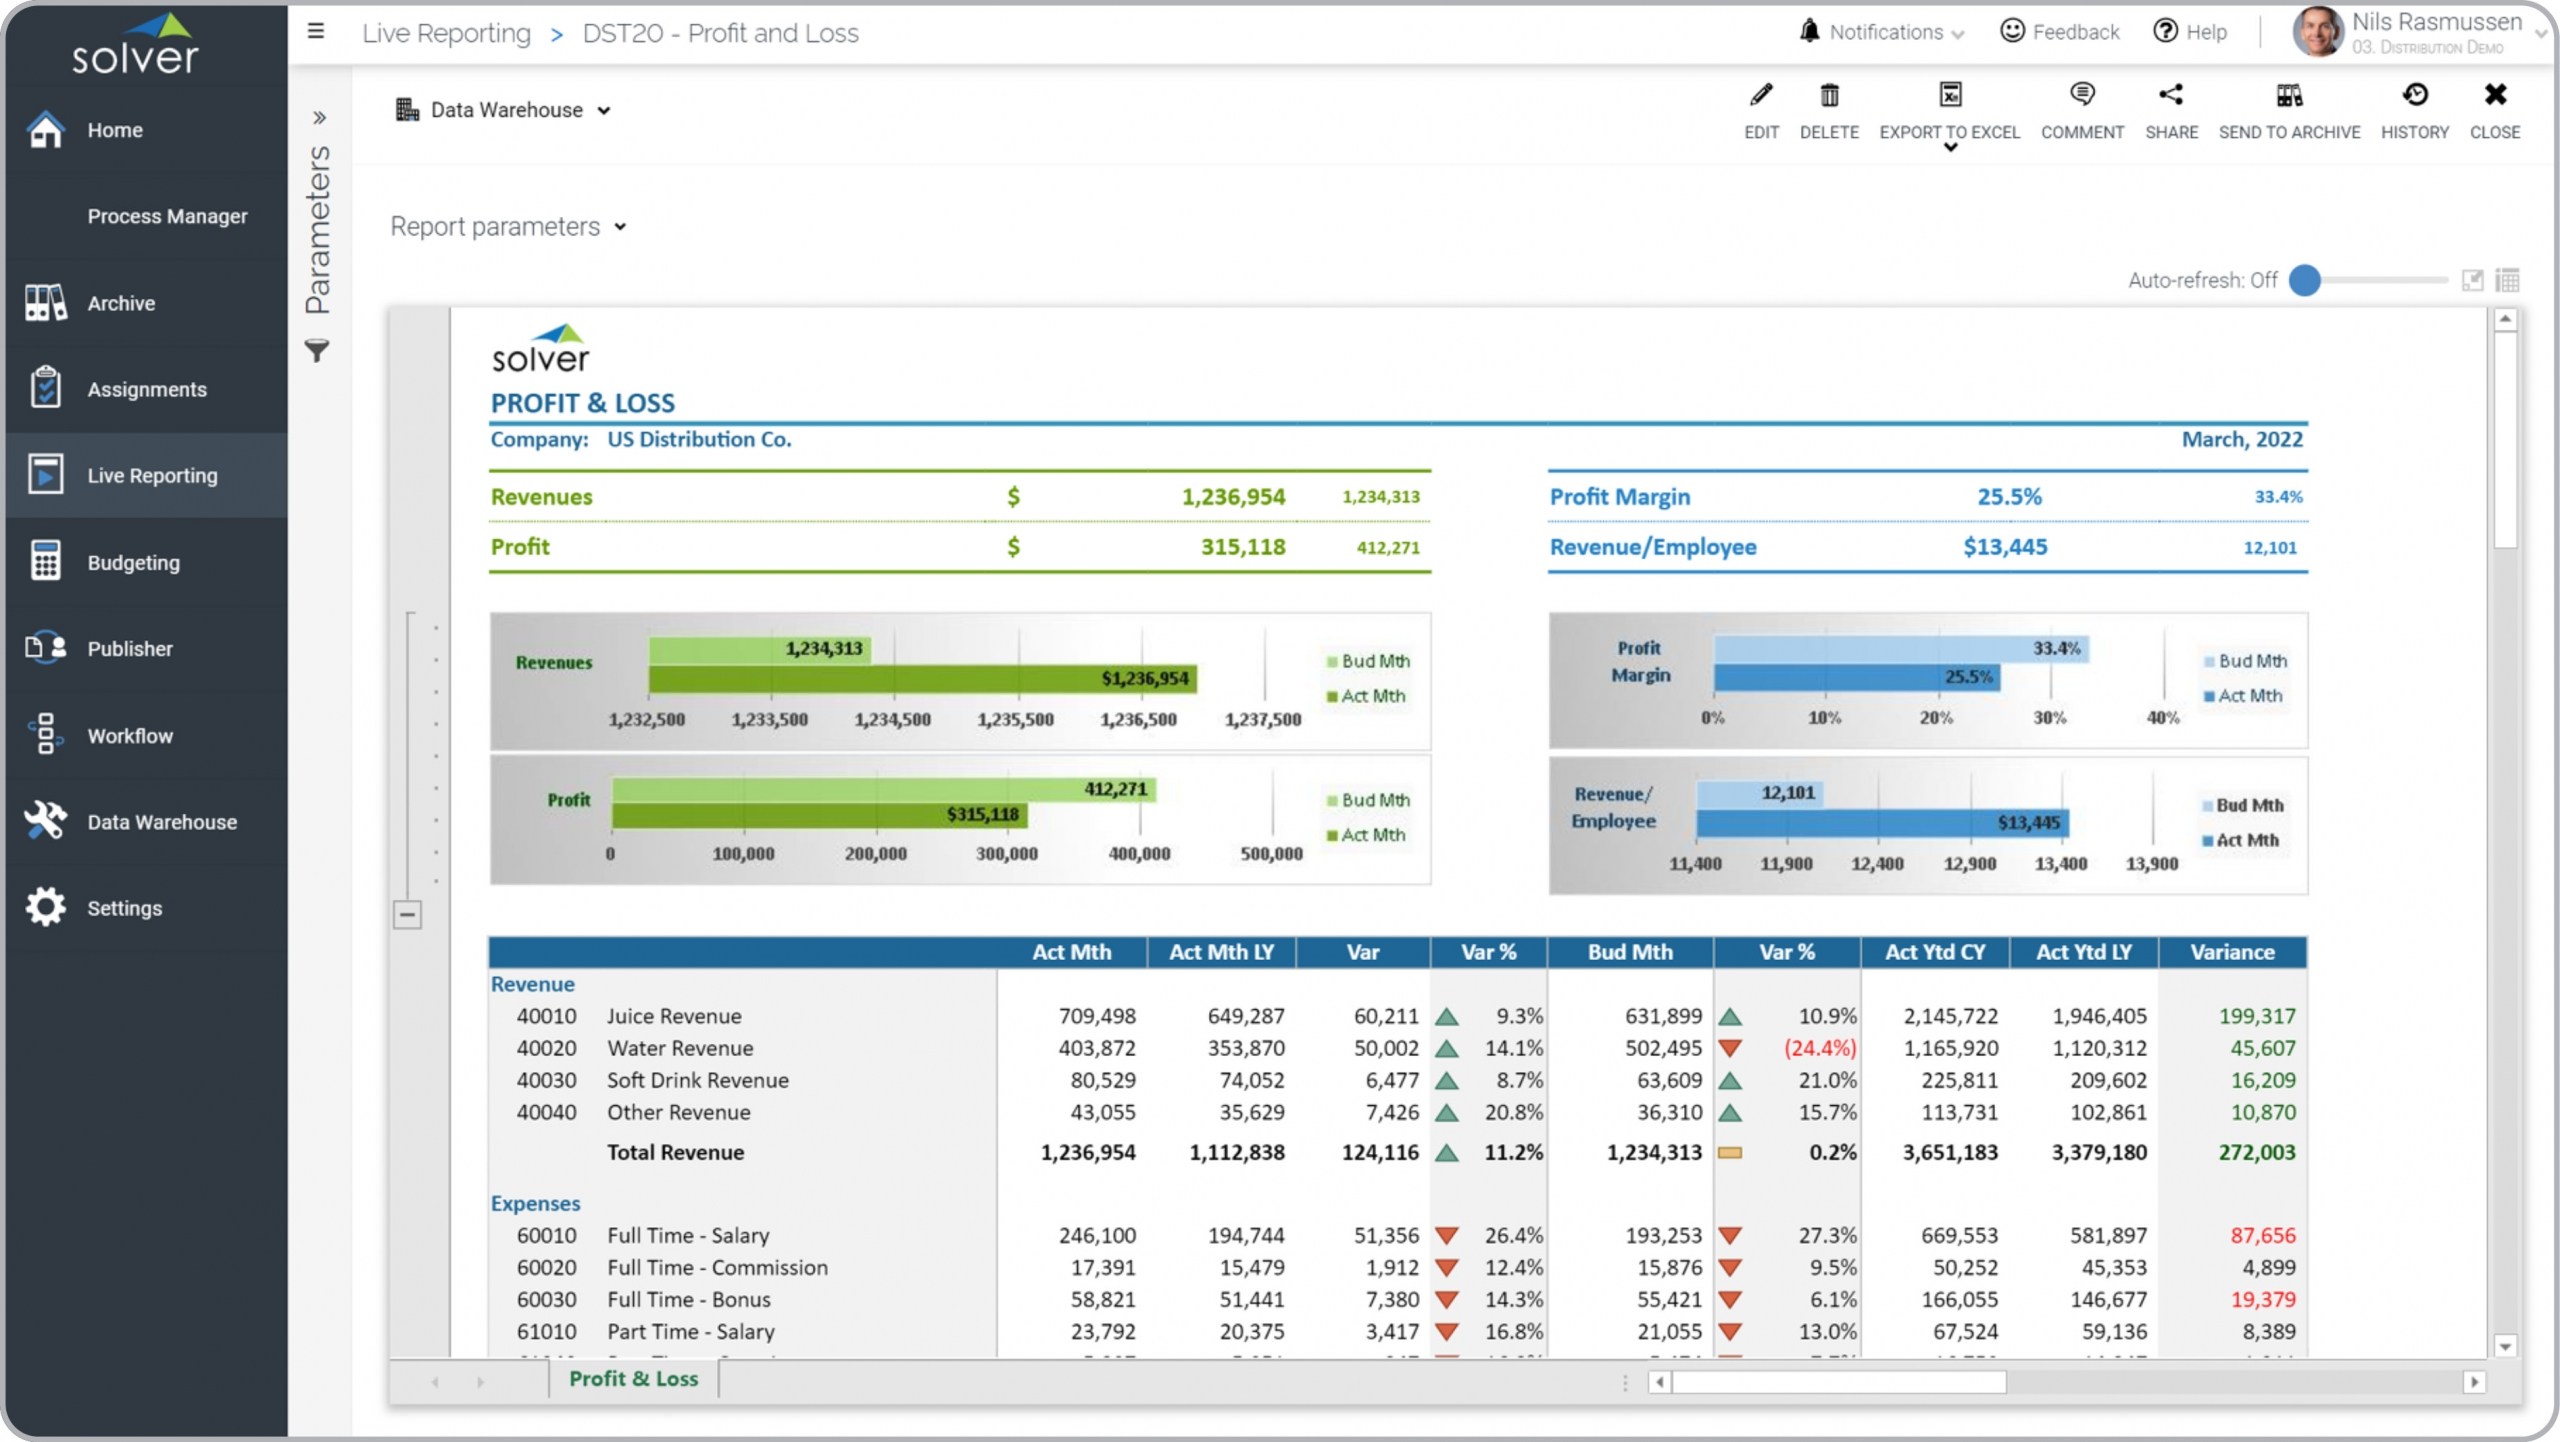
Profit & Loss Variance Report for a Distribution Company
What is a Profit & Loss Variance Report for a Distribution Company ? Profit & loss ...
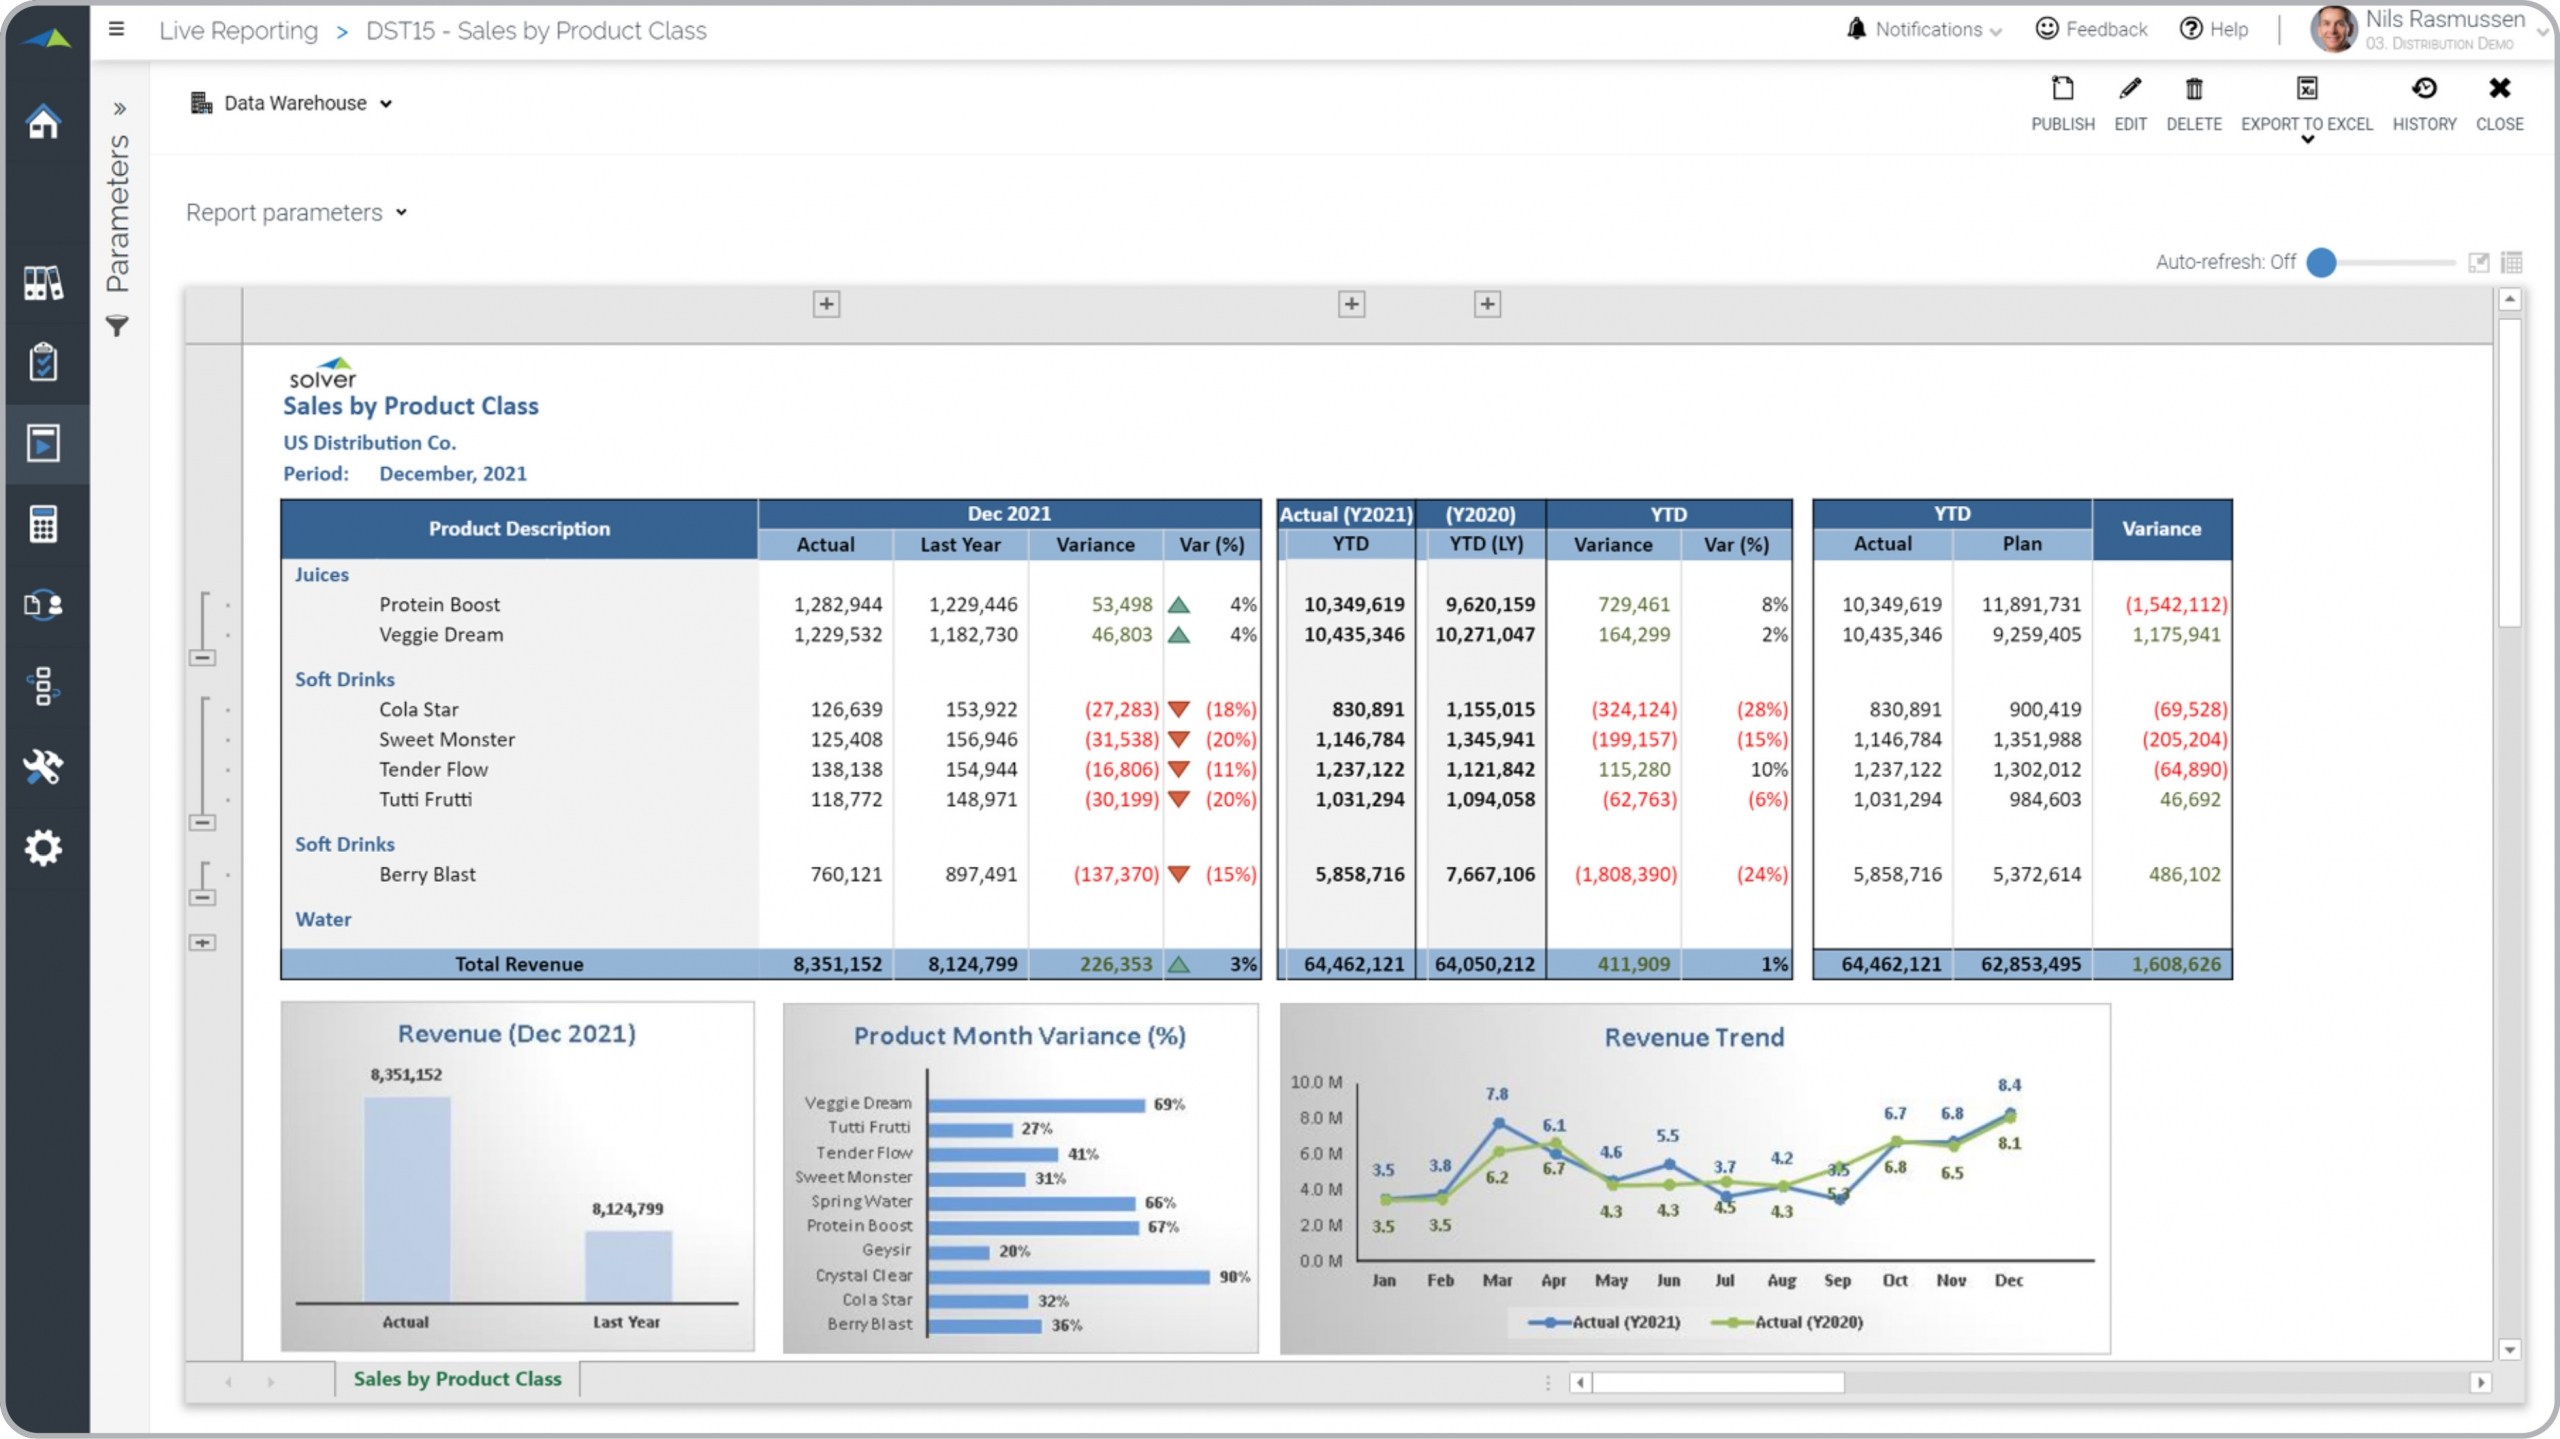
Sales by Product Report for a Distribution Company
What is a Sales by Product Report ? Product sales reports are considered sales analysis tools for ...
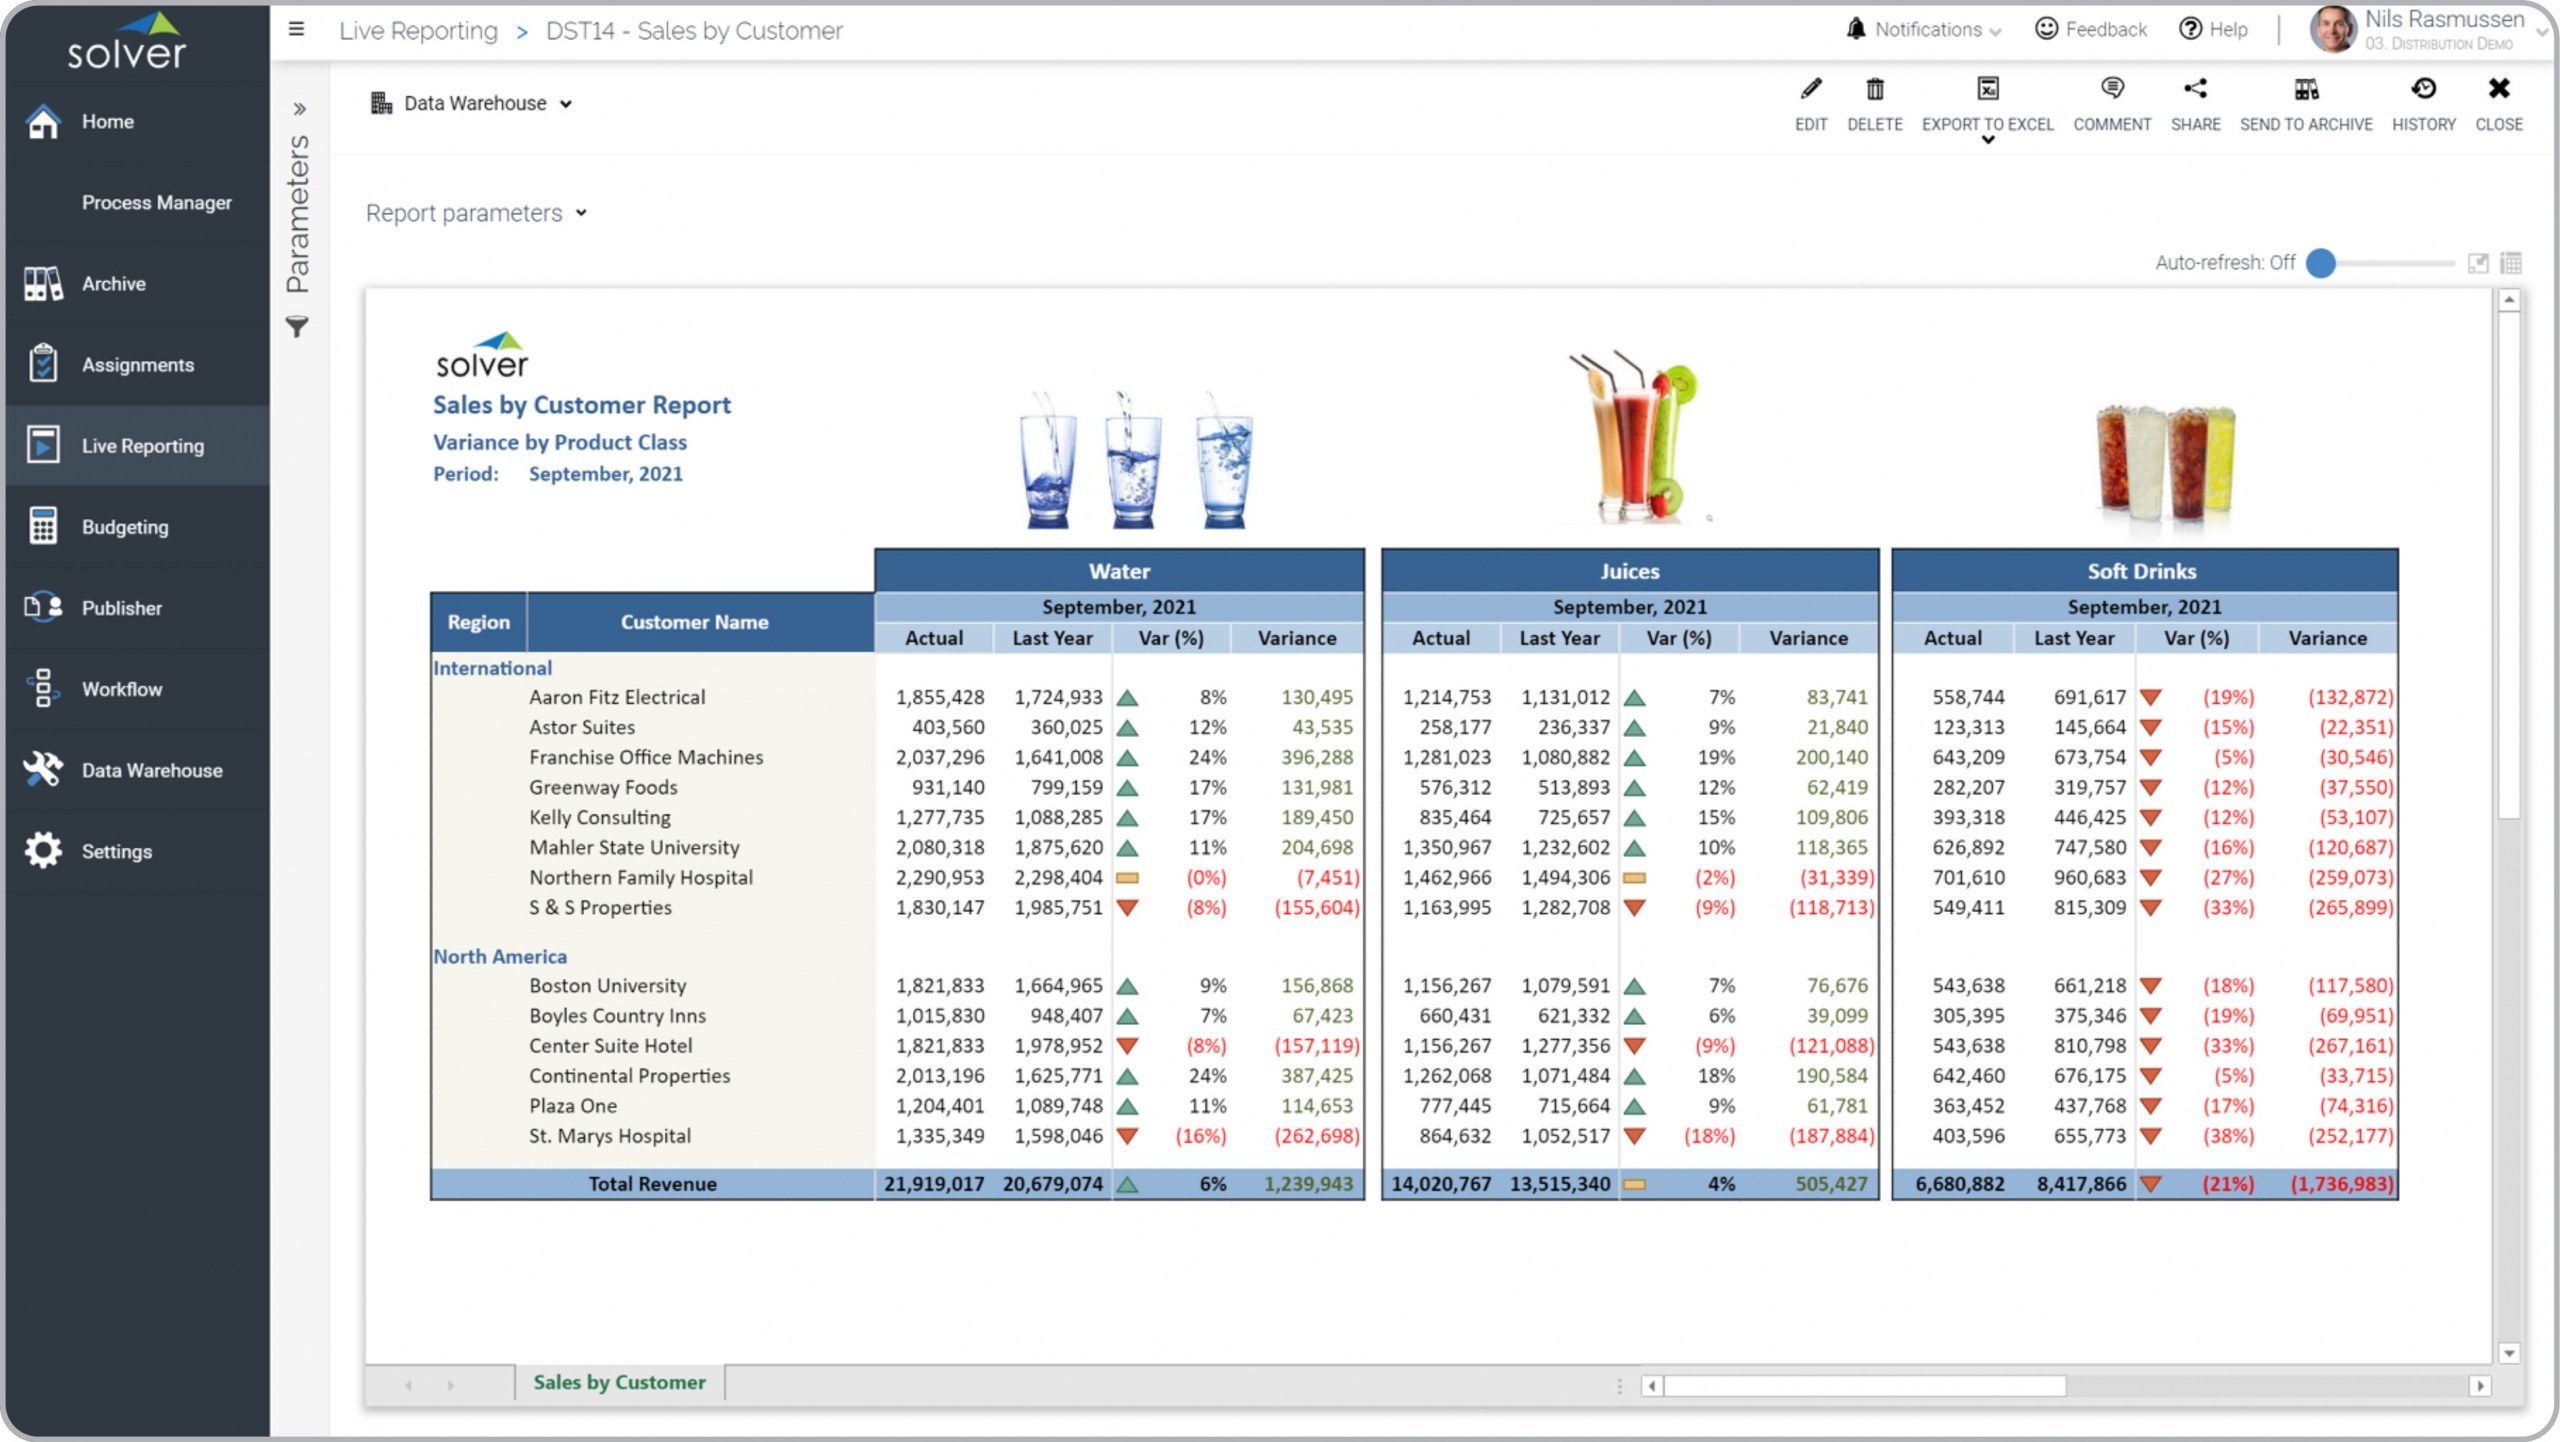
Sales by Customer Report for a Distribution Company
What is a Sales by Customer Report for a Distribution Company ? Customer sales reports with ...
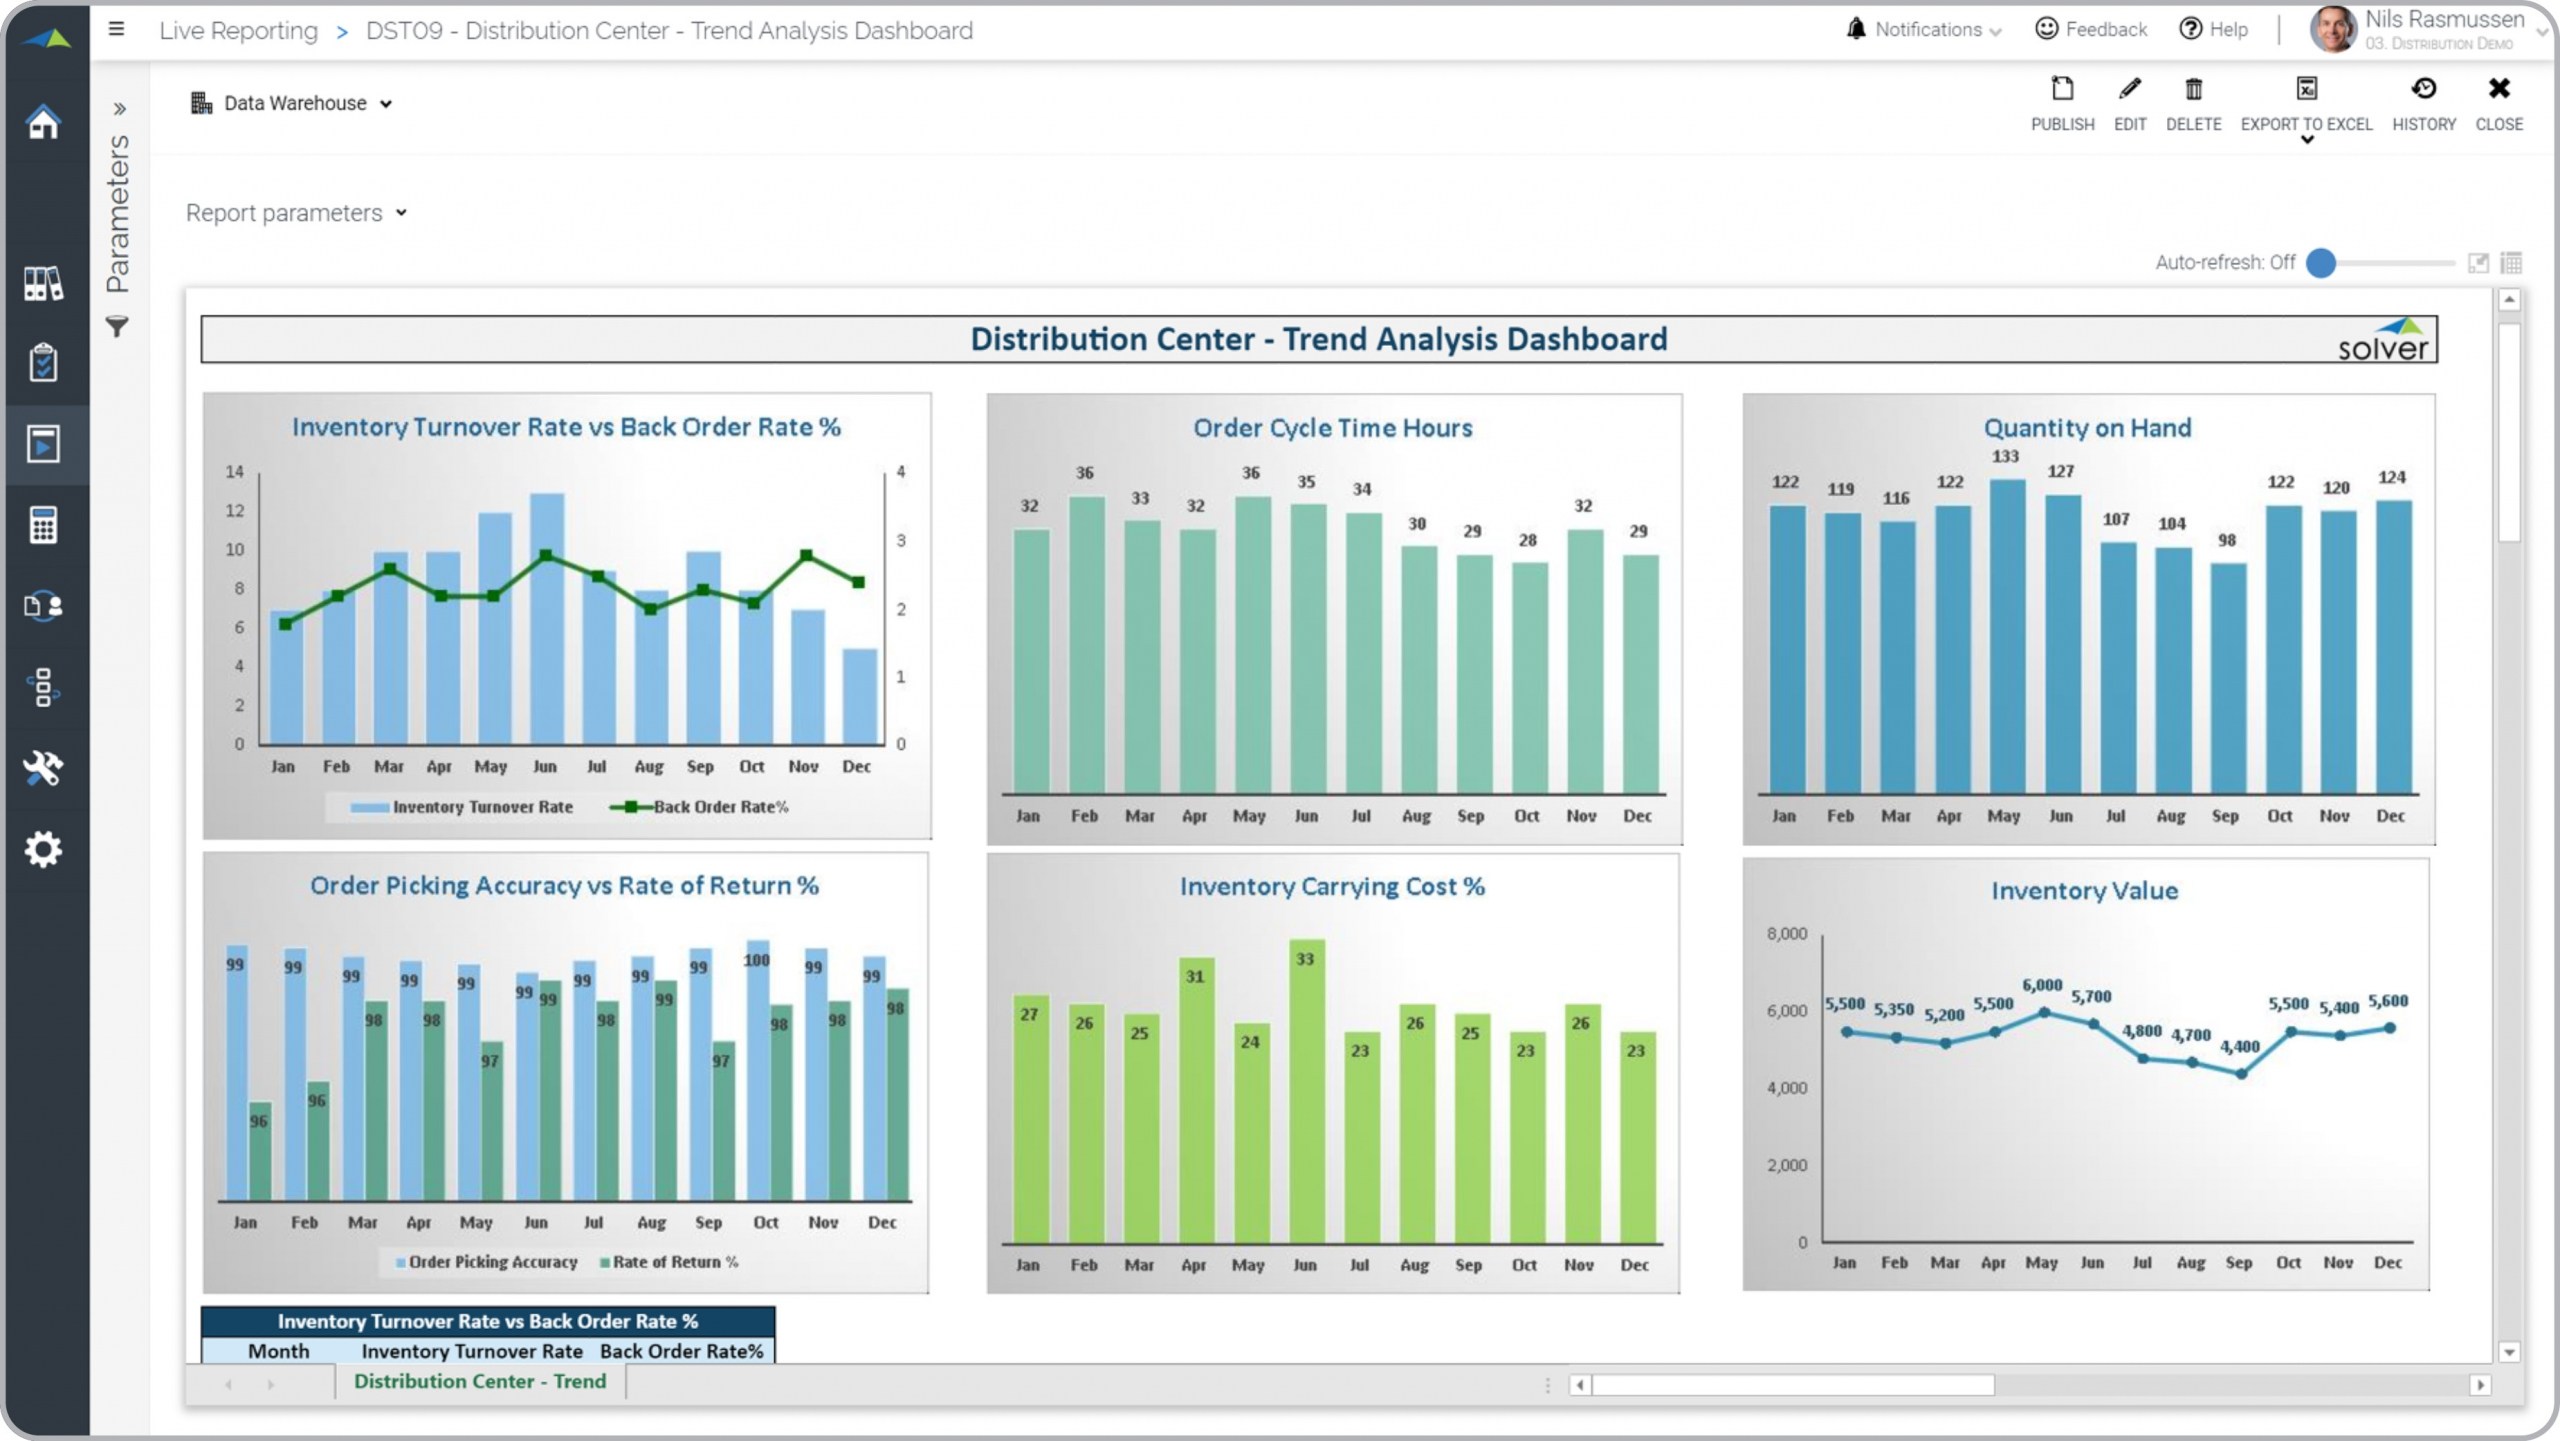
Monthly Trend Dashboard for a Distribution Center
What is a Monthly Trend Dashboard ? Distribution center trend dashboards are considered analysis ...
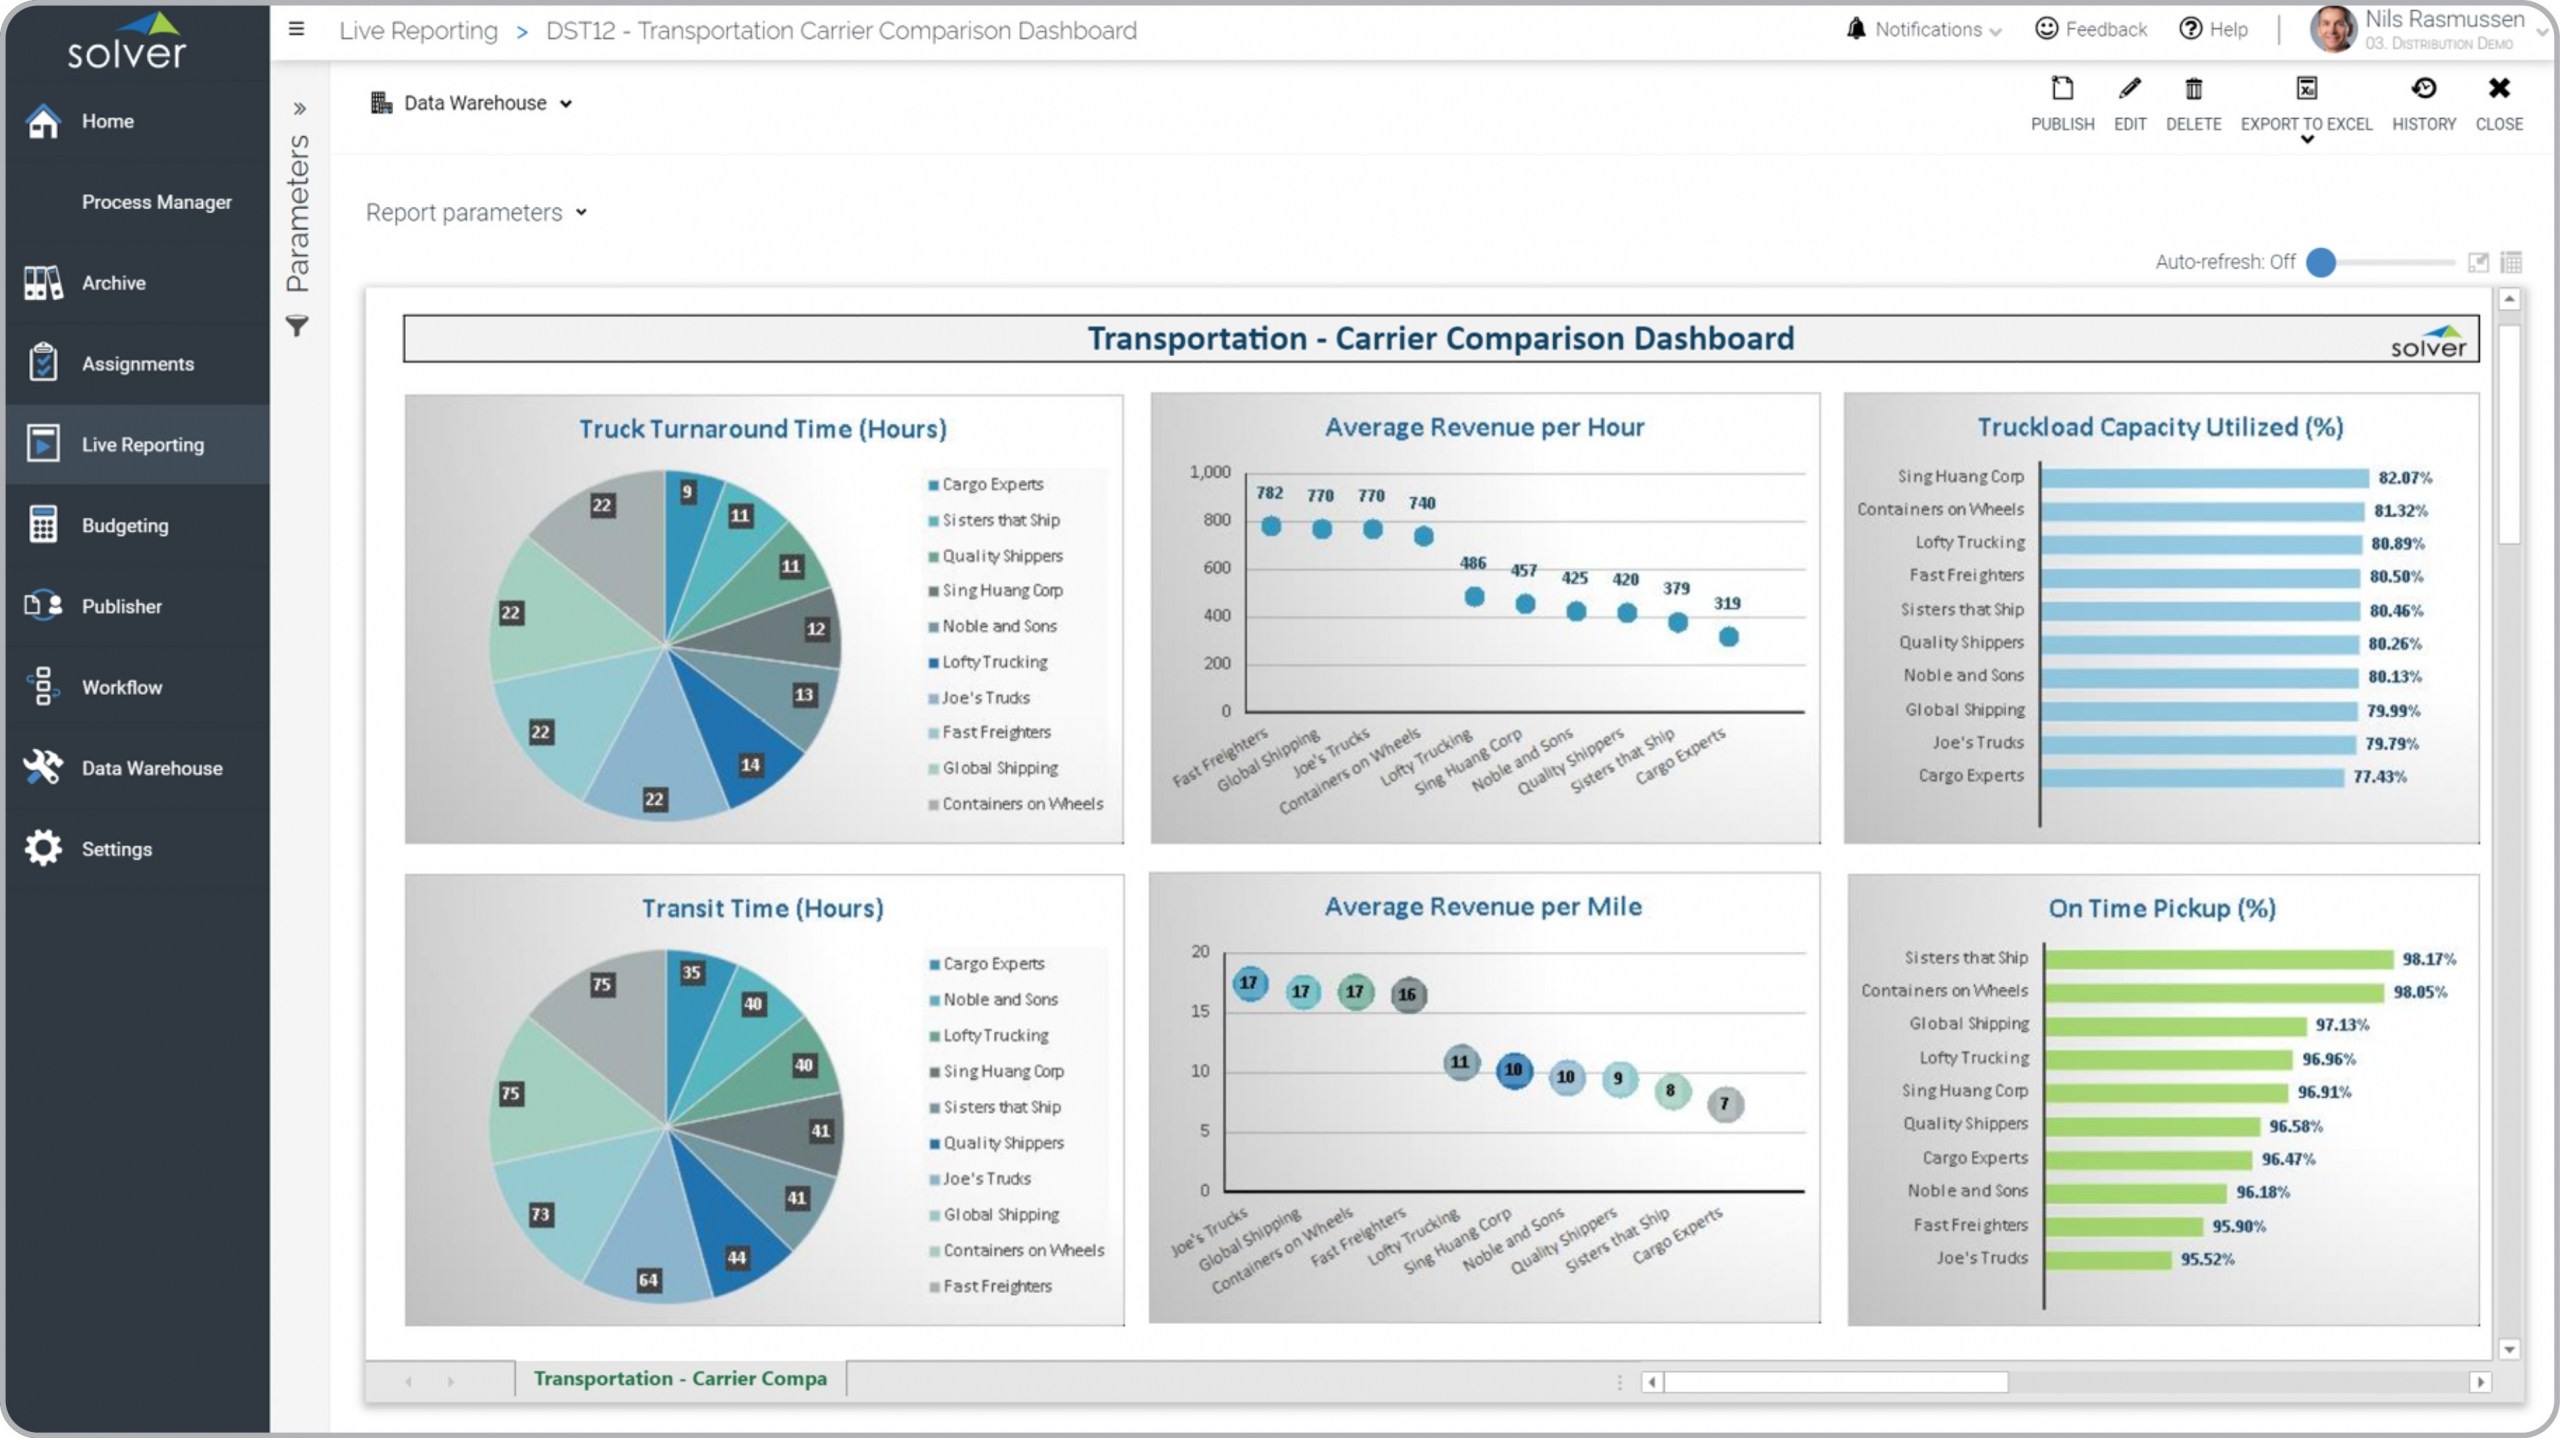
Transportation Carrier Comparison Dashboard
What is a Transportation Carrier Comparison Dashboard ? Carrier comparison dashboards are ...
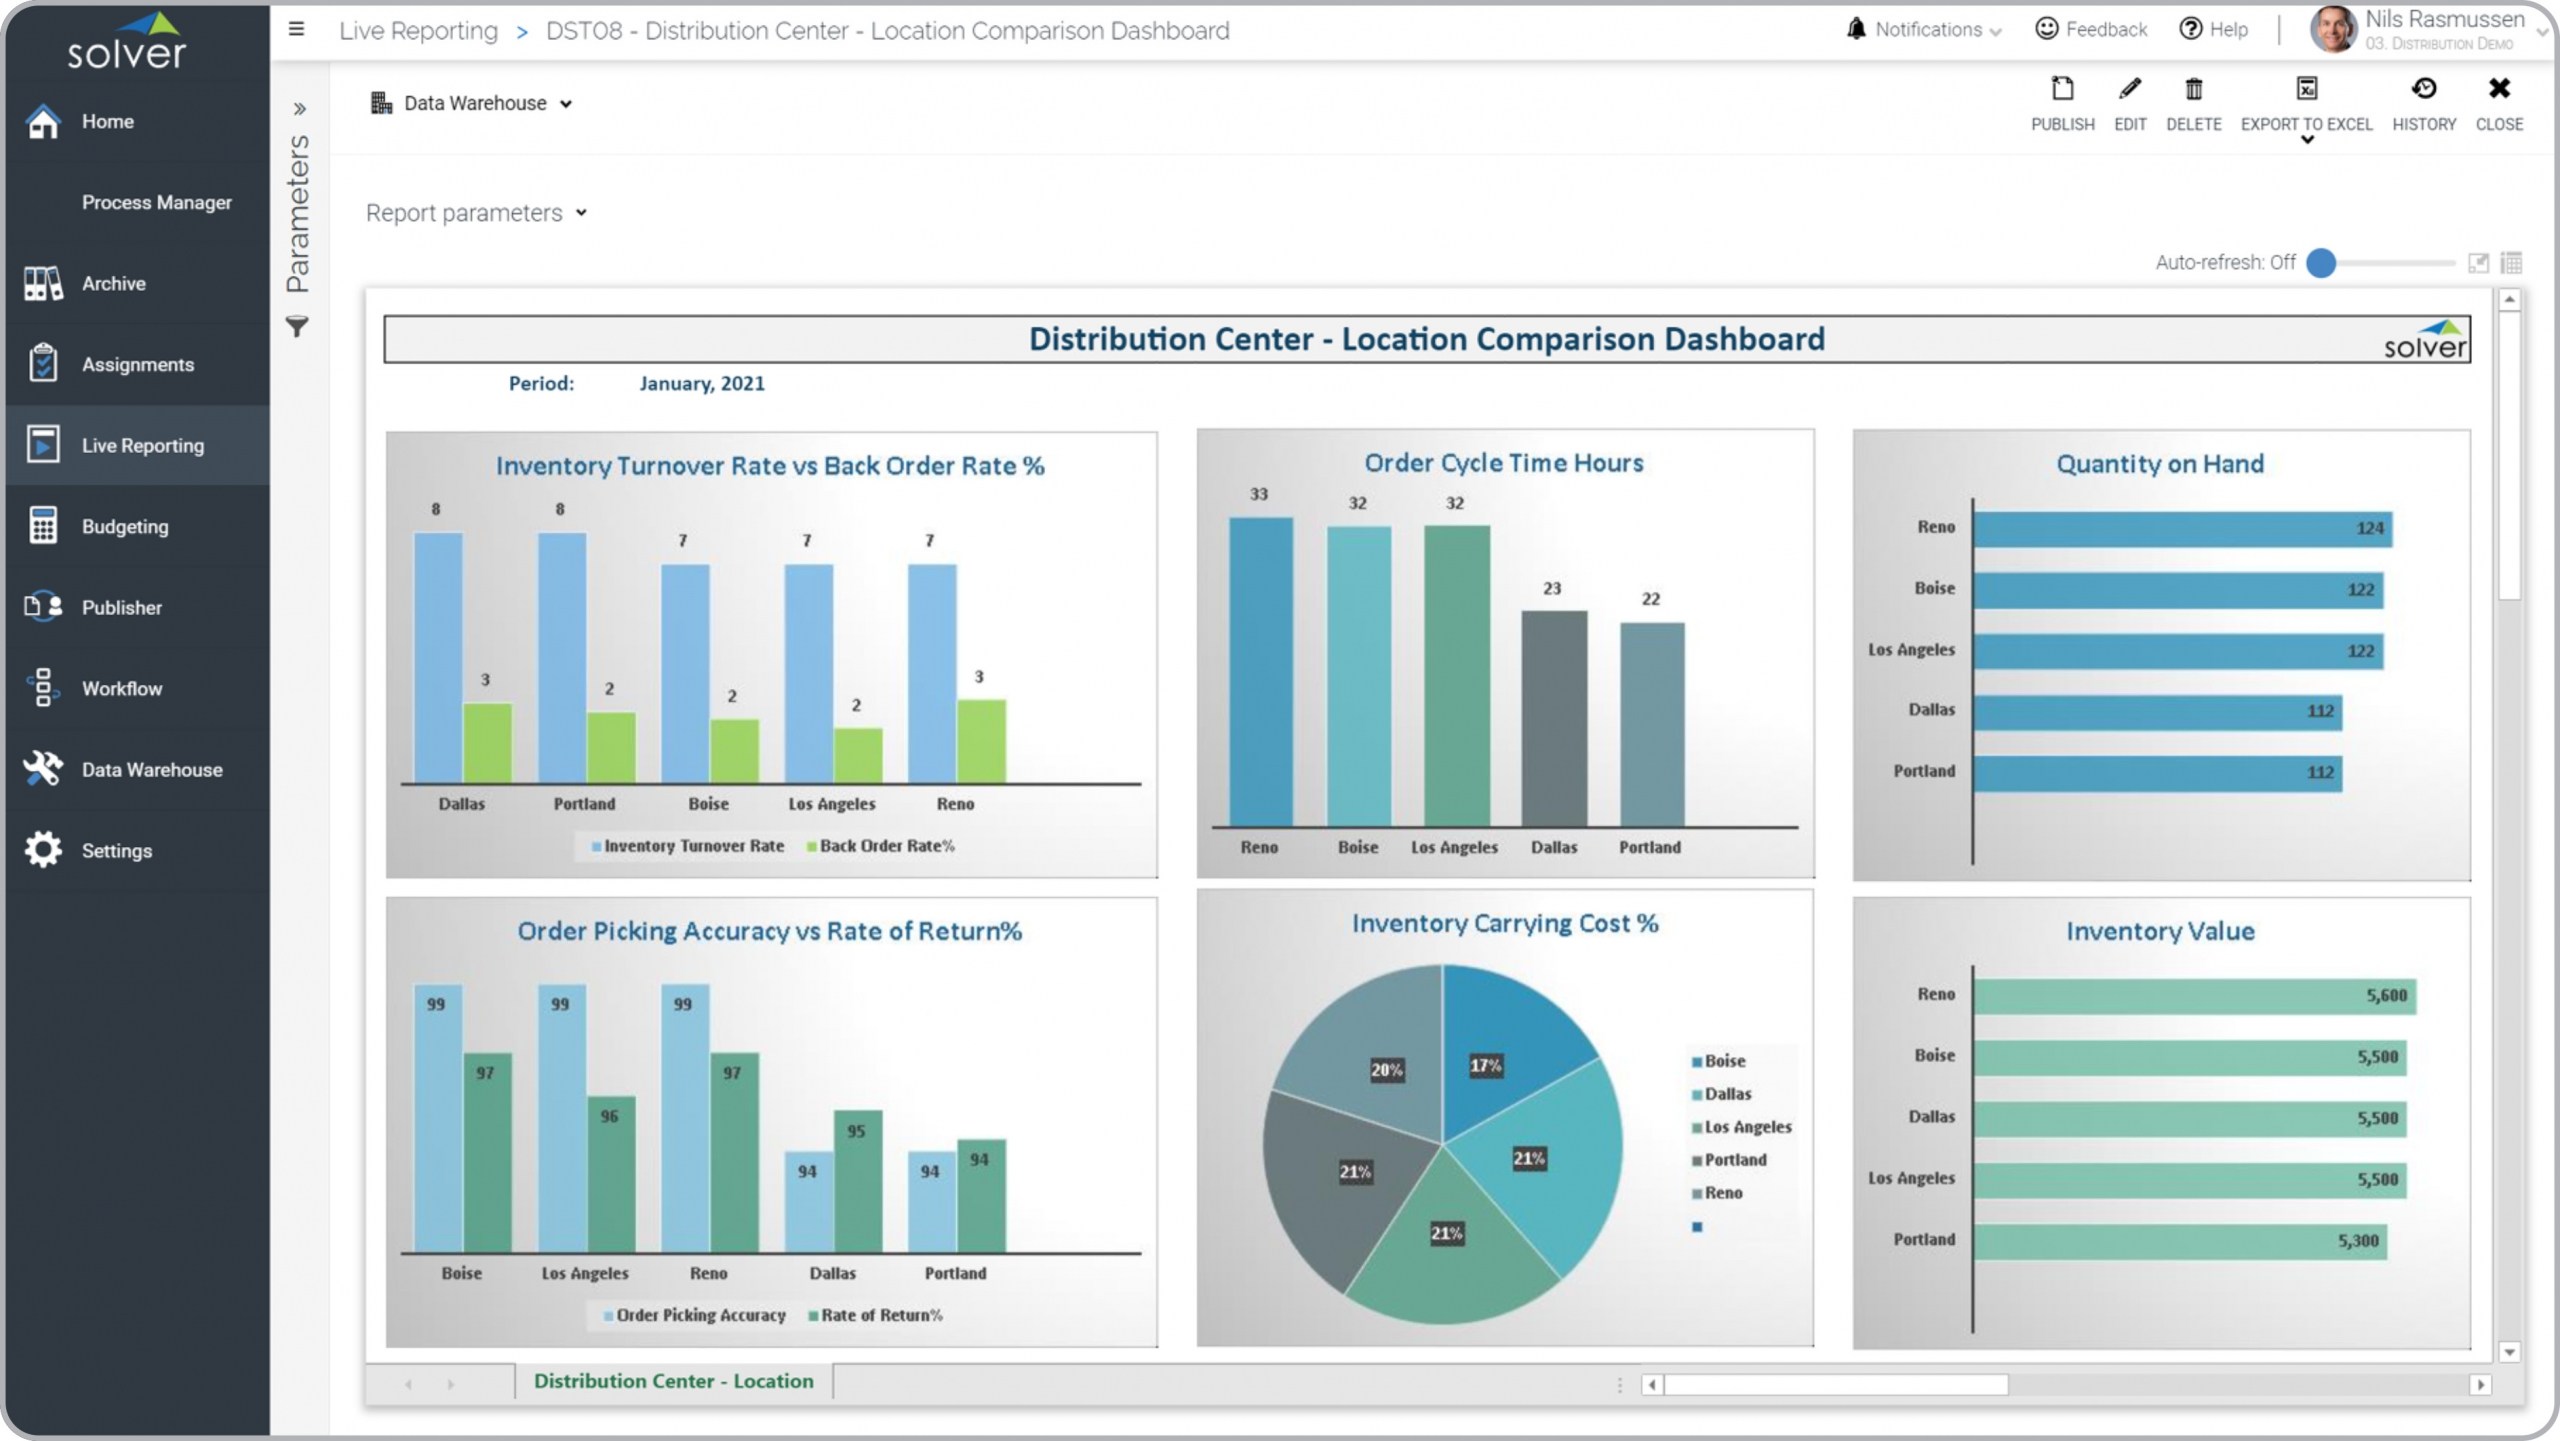
Distribution Center Comparison Dashboard
What is a Distribution Center Comparison Dashboard ? Comparative distribution center dashboards are ...
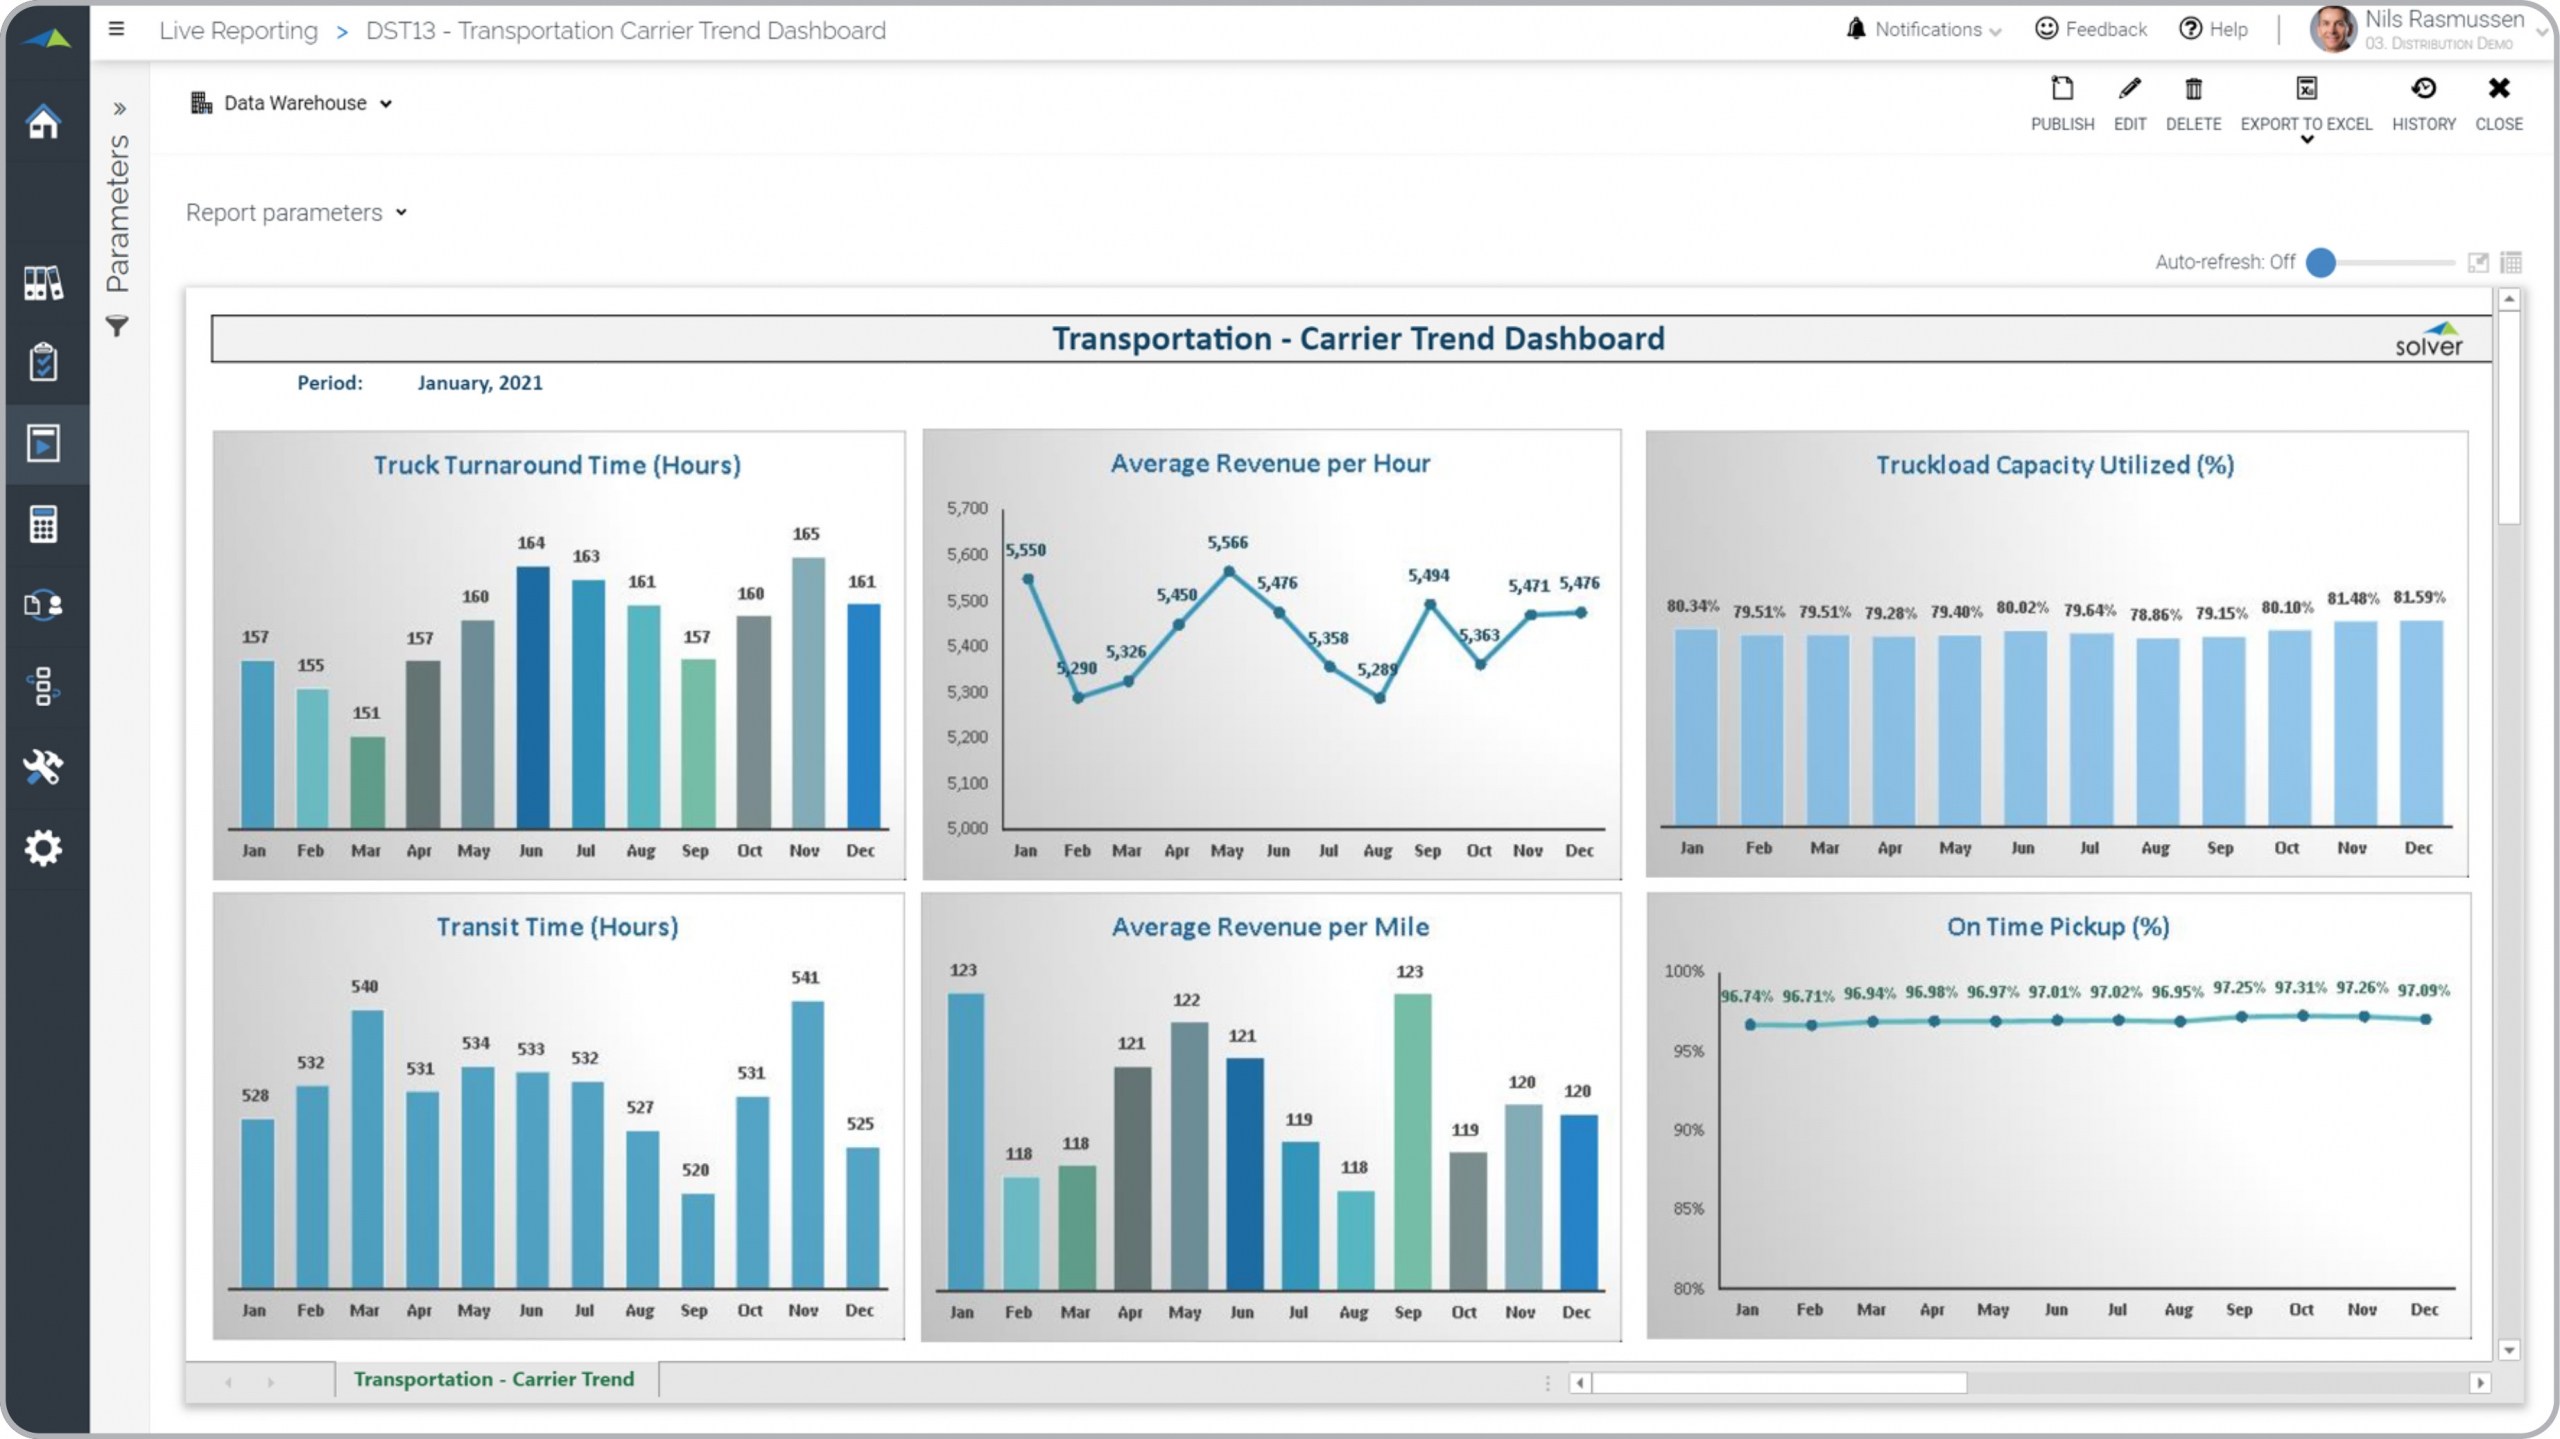
Transportation Carrier Monthly Trend Dashboard
What is a Transportation Carrier Monthly Trend Dashboard ? Carrier trend dashboards are considered ...
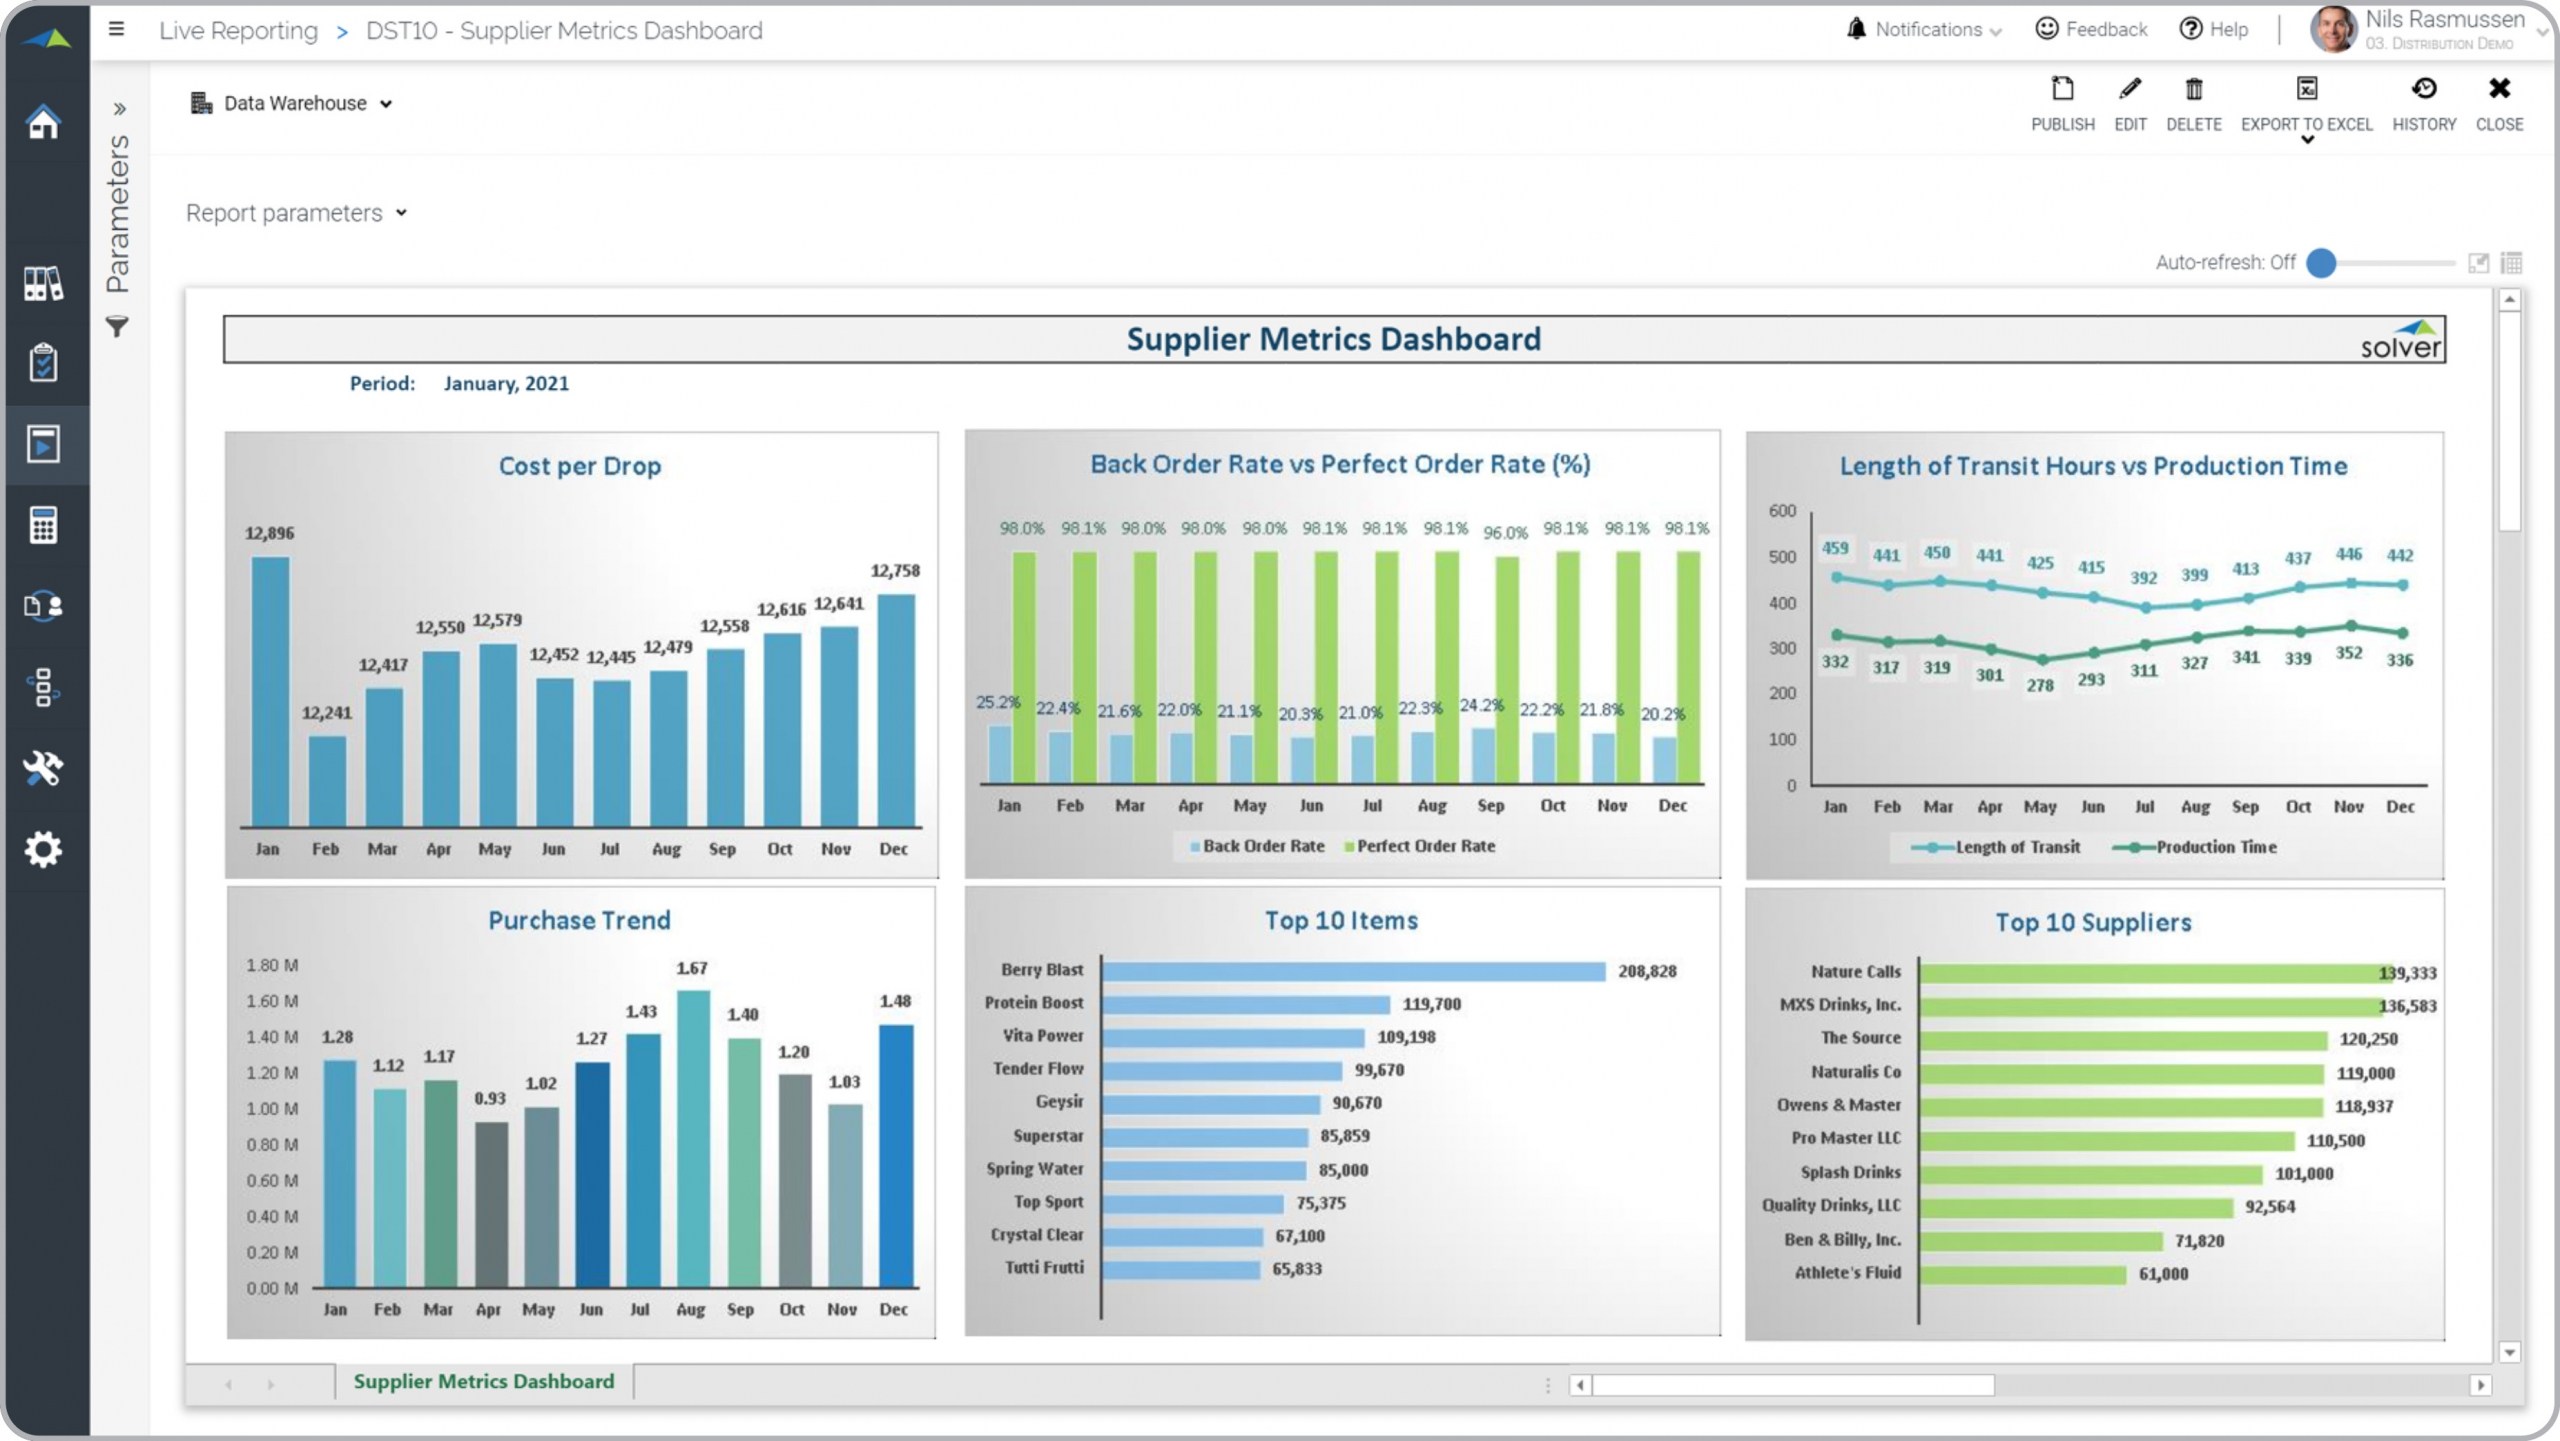
Supplier KPI Dashboard for a Distribution Business
What is a Supplier KPI Dashboard ? Supplier KPI dashboards are considered important analysis tools ...
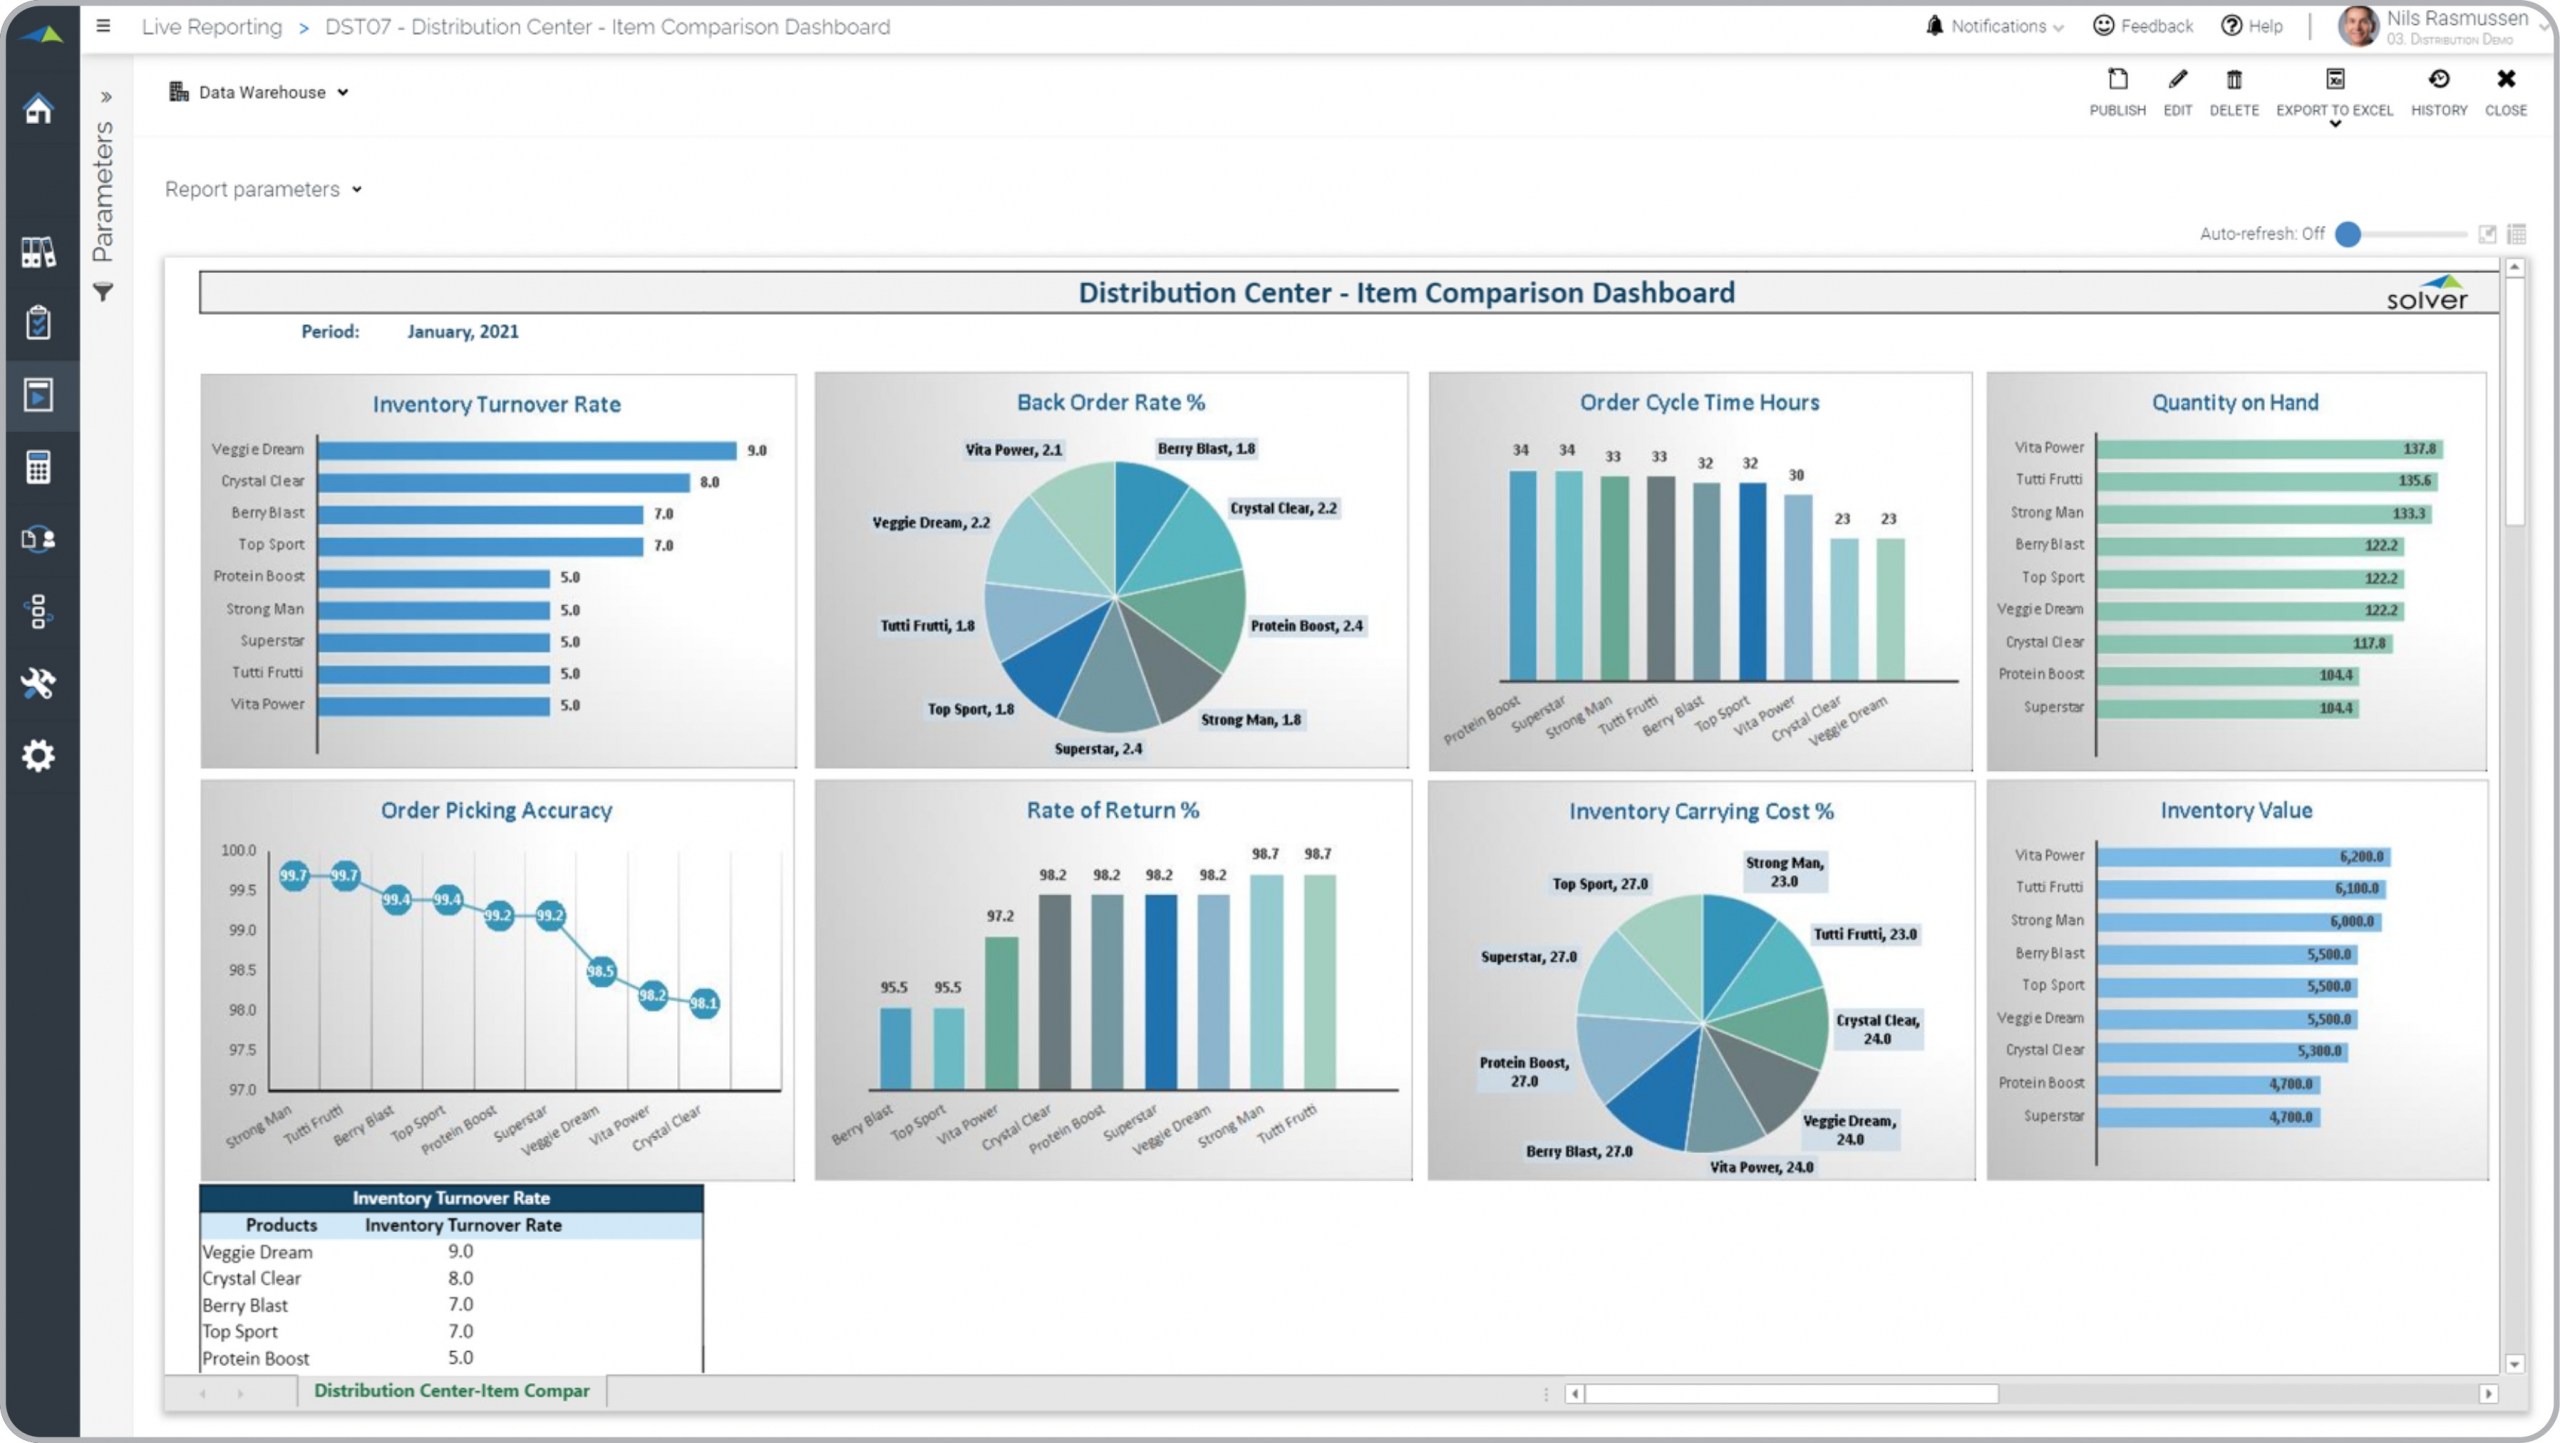
Item Comparison Dashboard for a Distributor
What is an Item Comparison Dashboard for a Distributor ? Item dashboards are considered product ...
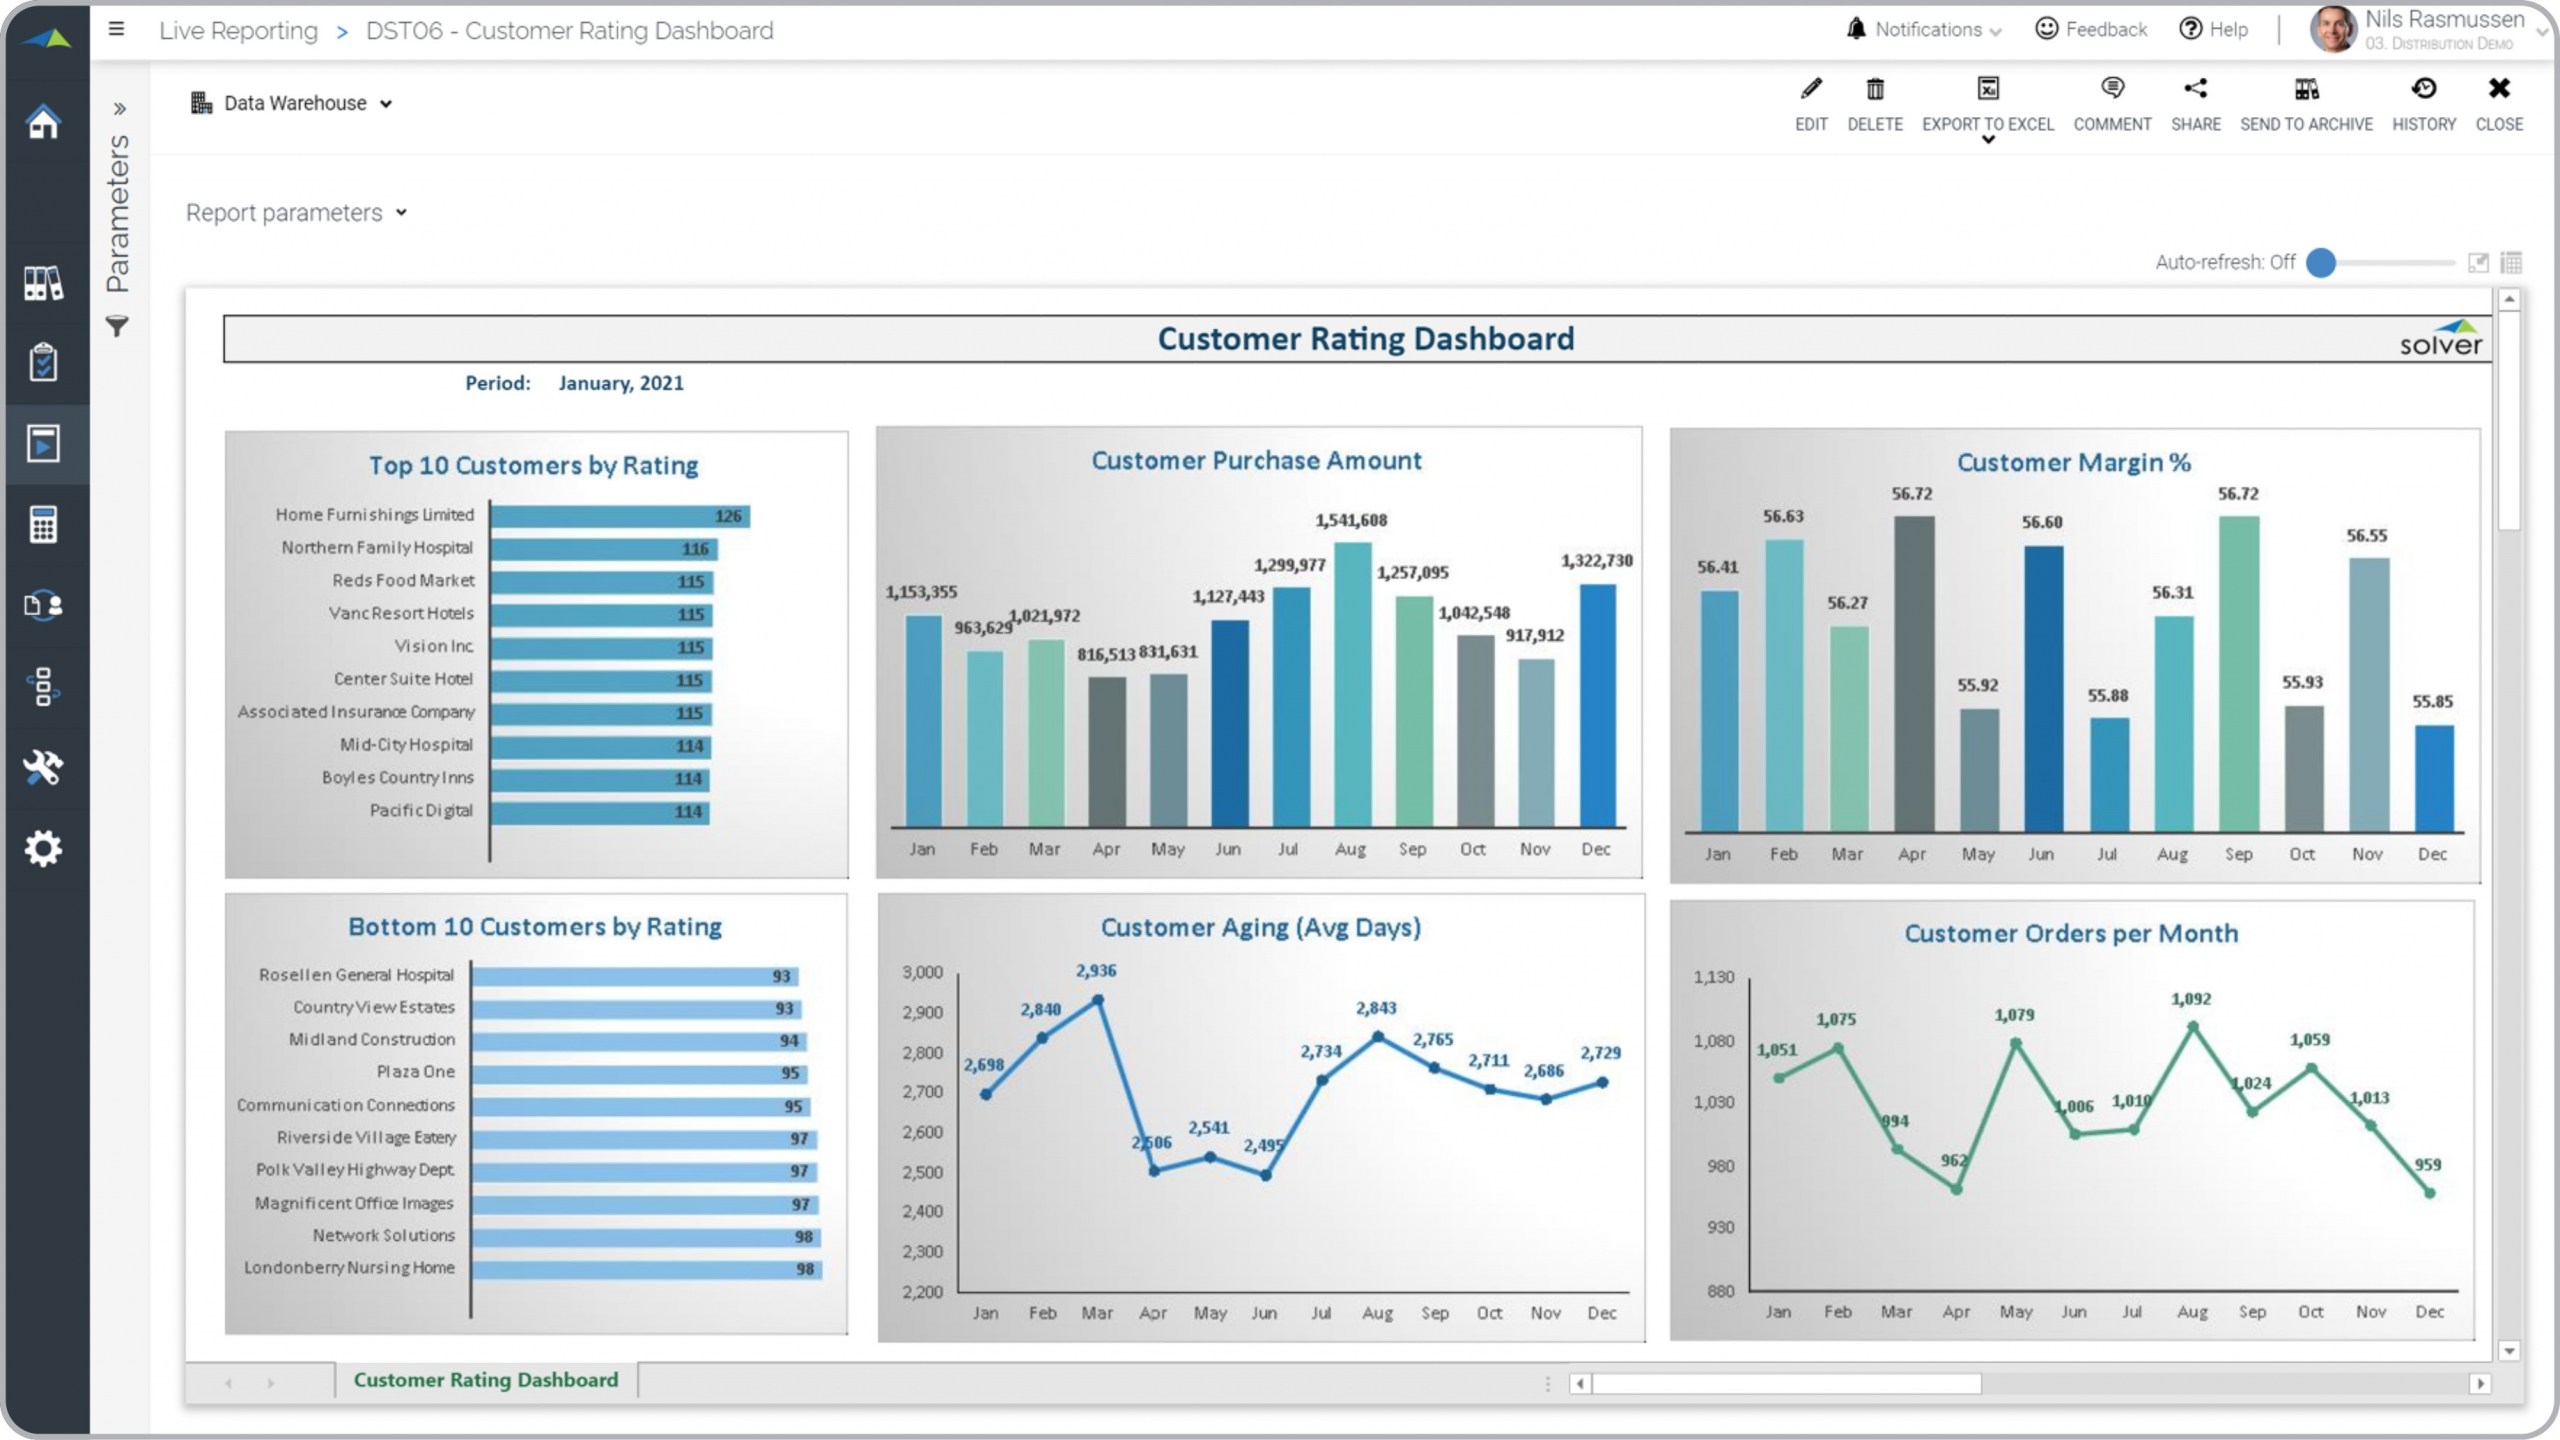
Customer Rating Dashboard for a Distribution Company
What is a Customer Rating Dashboard for a Distribution Company ? Customer rating reports are ...
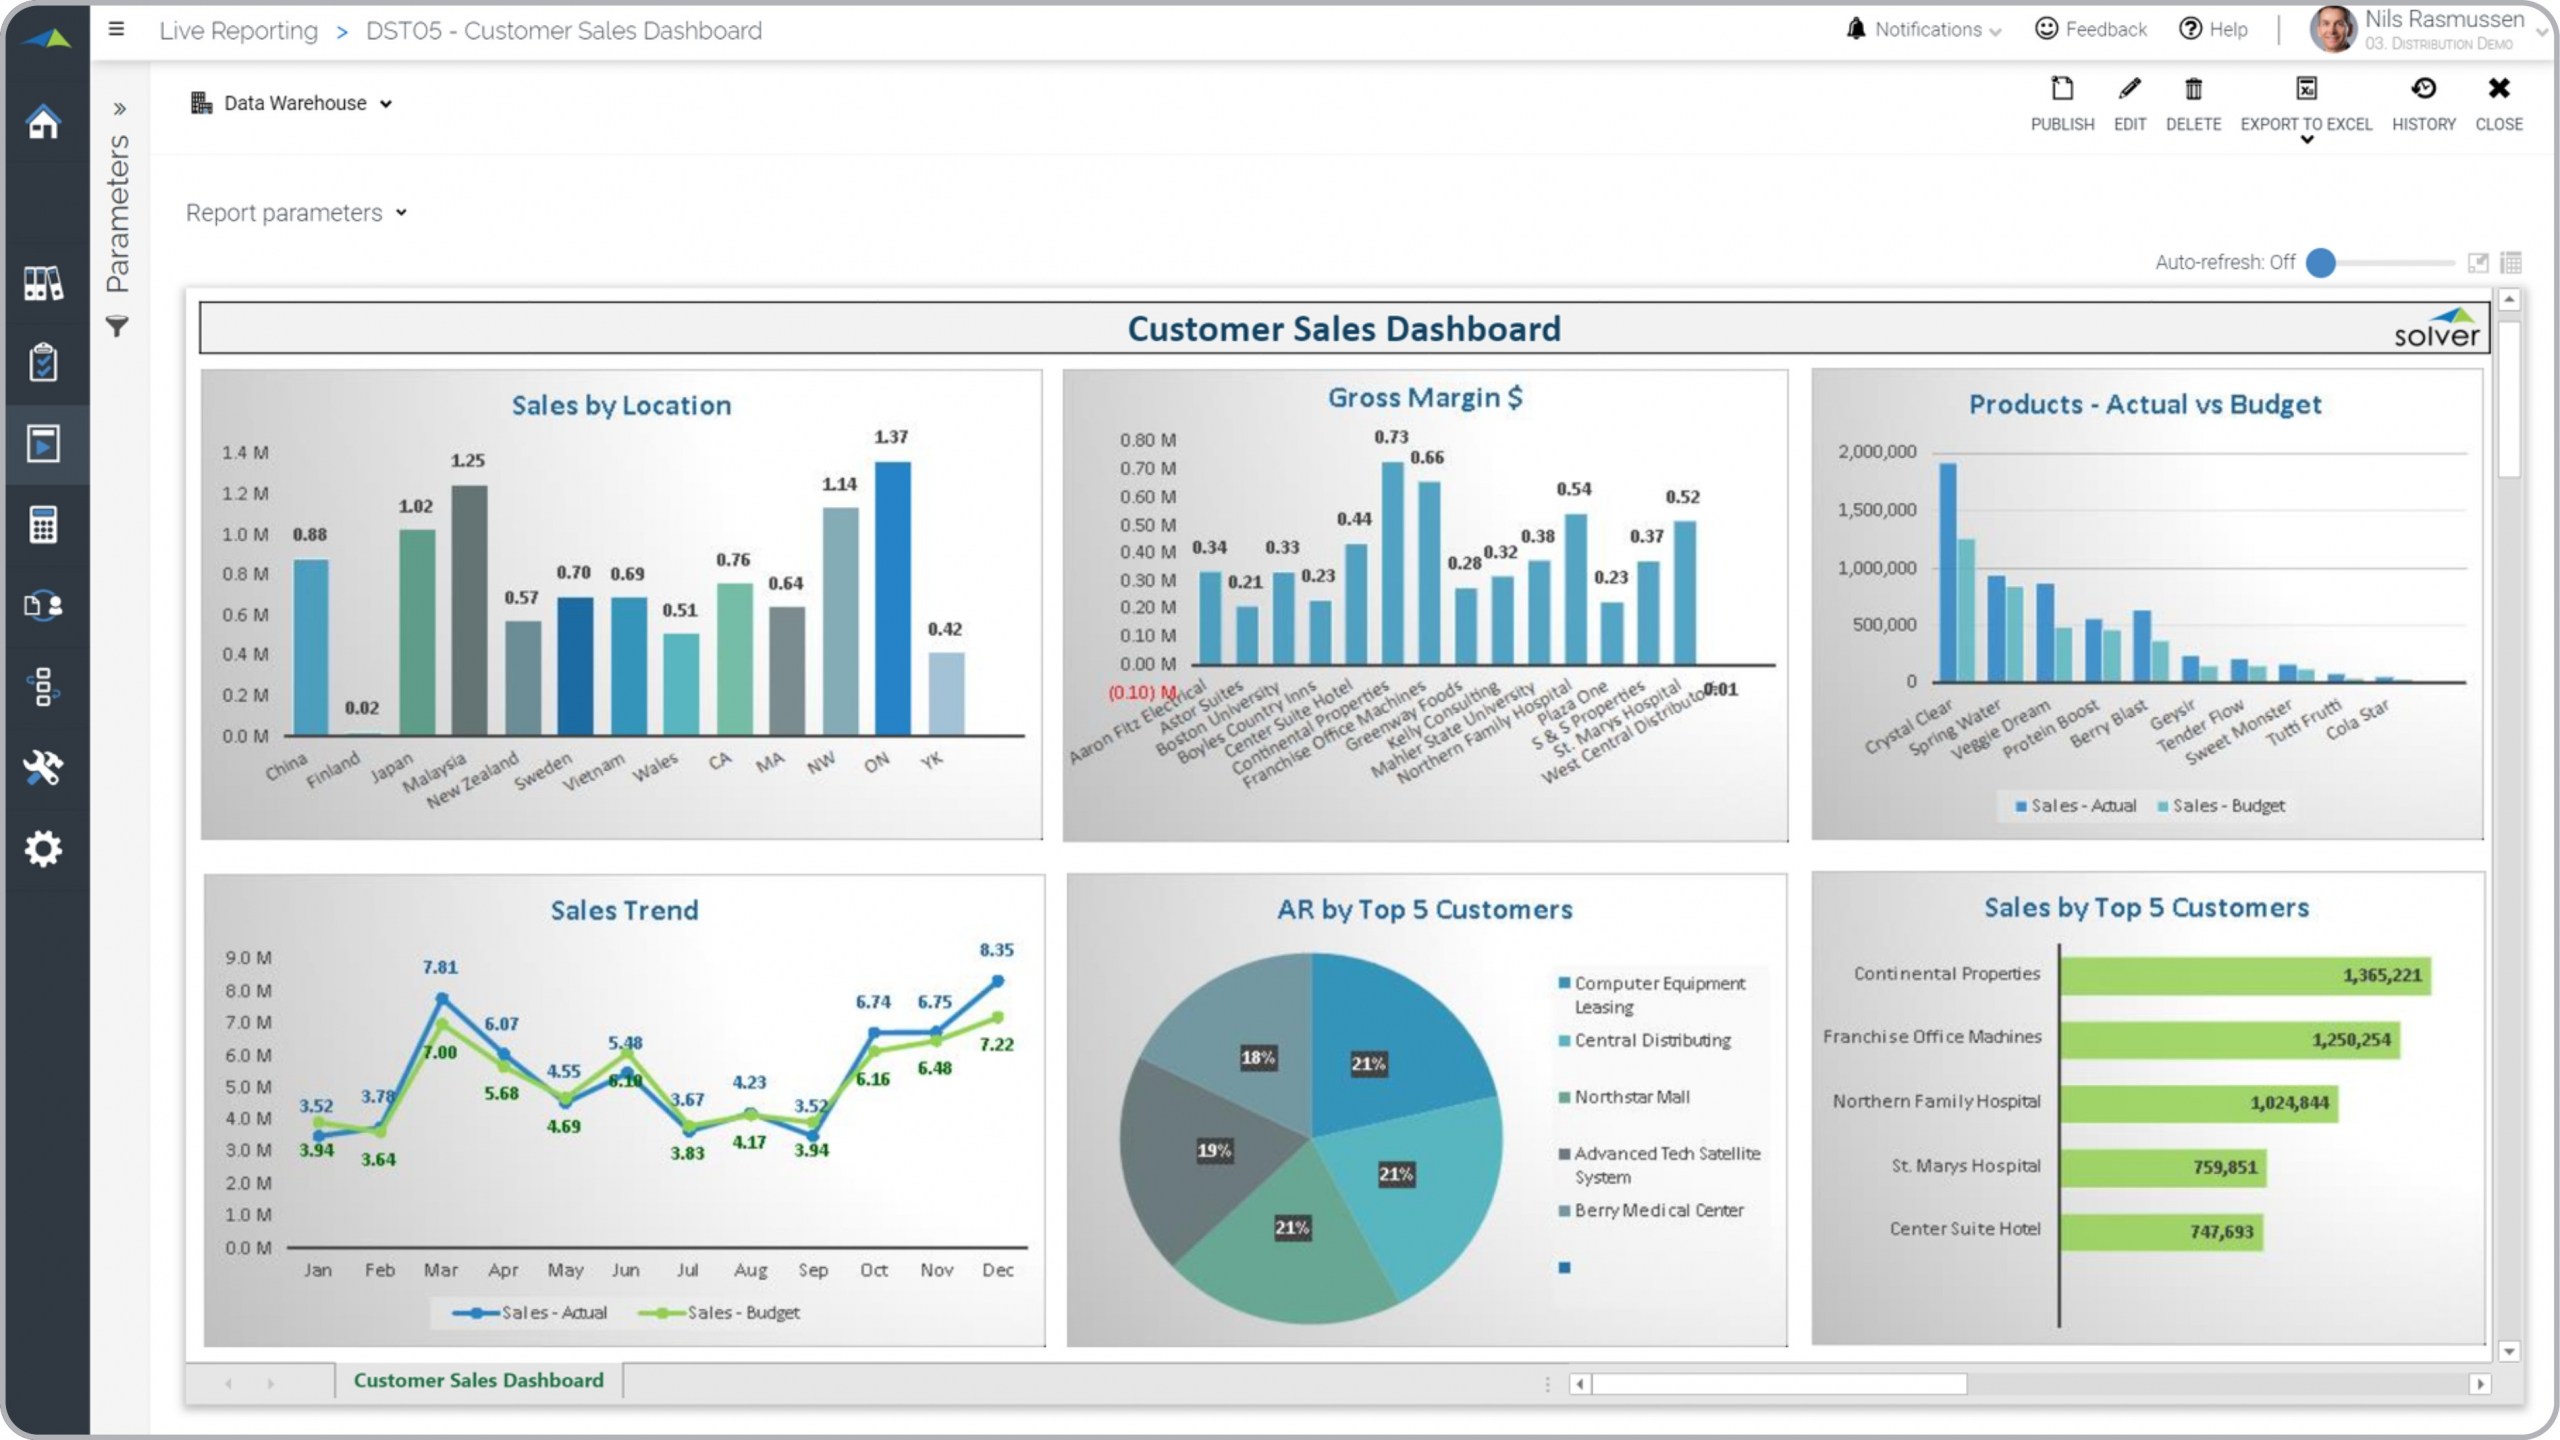
Customer Sales Dashboard for a Distribution Company
What is a Customer Sales Dashboard for a Distribution Company ? Customer sales dashboards are ...
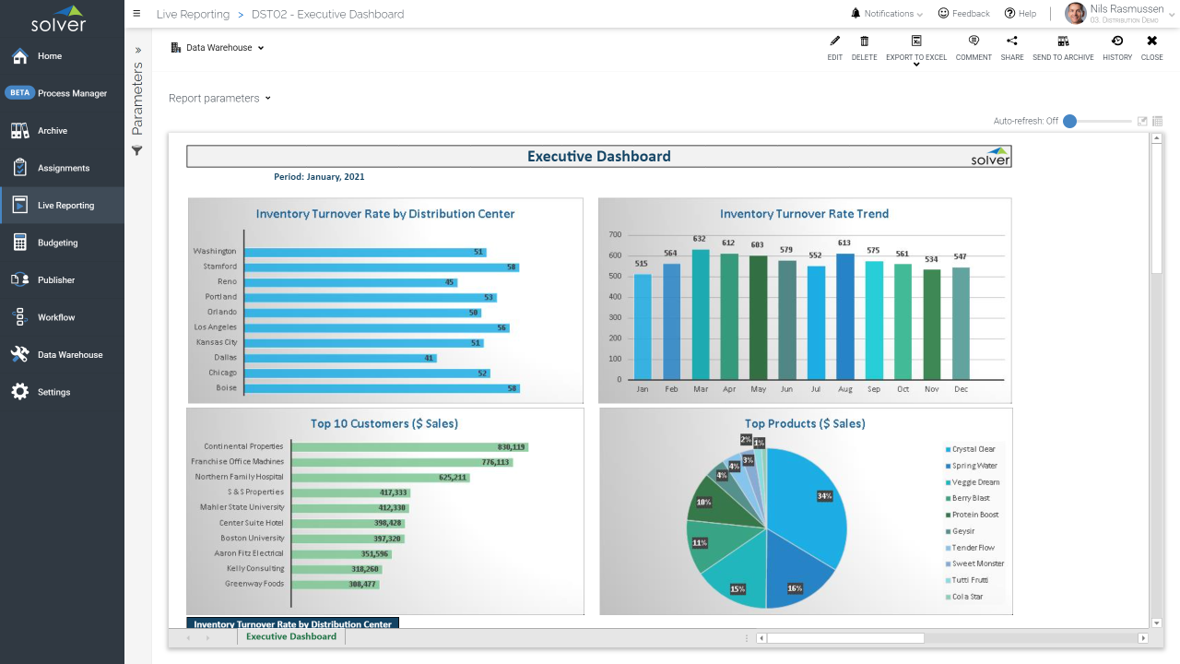
Executive Dashboard for a Distribution Company
What is an Executive Dashboard for a Distribution Company ? Executive dashboards are considered ...
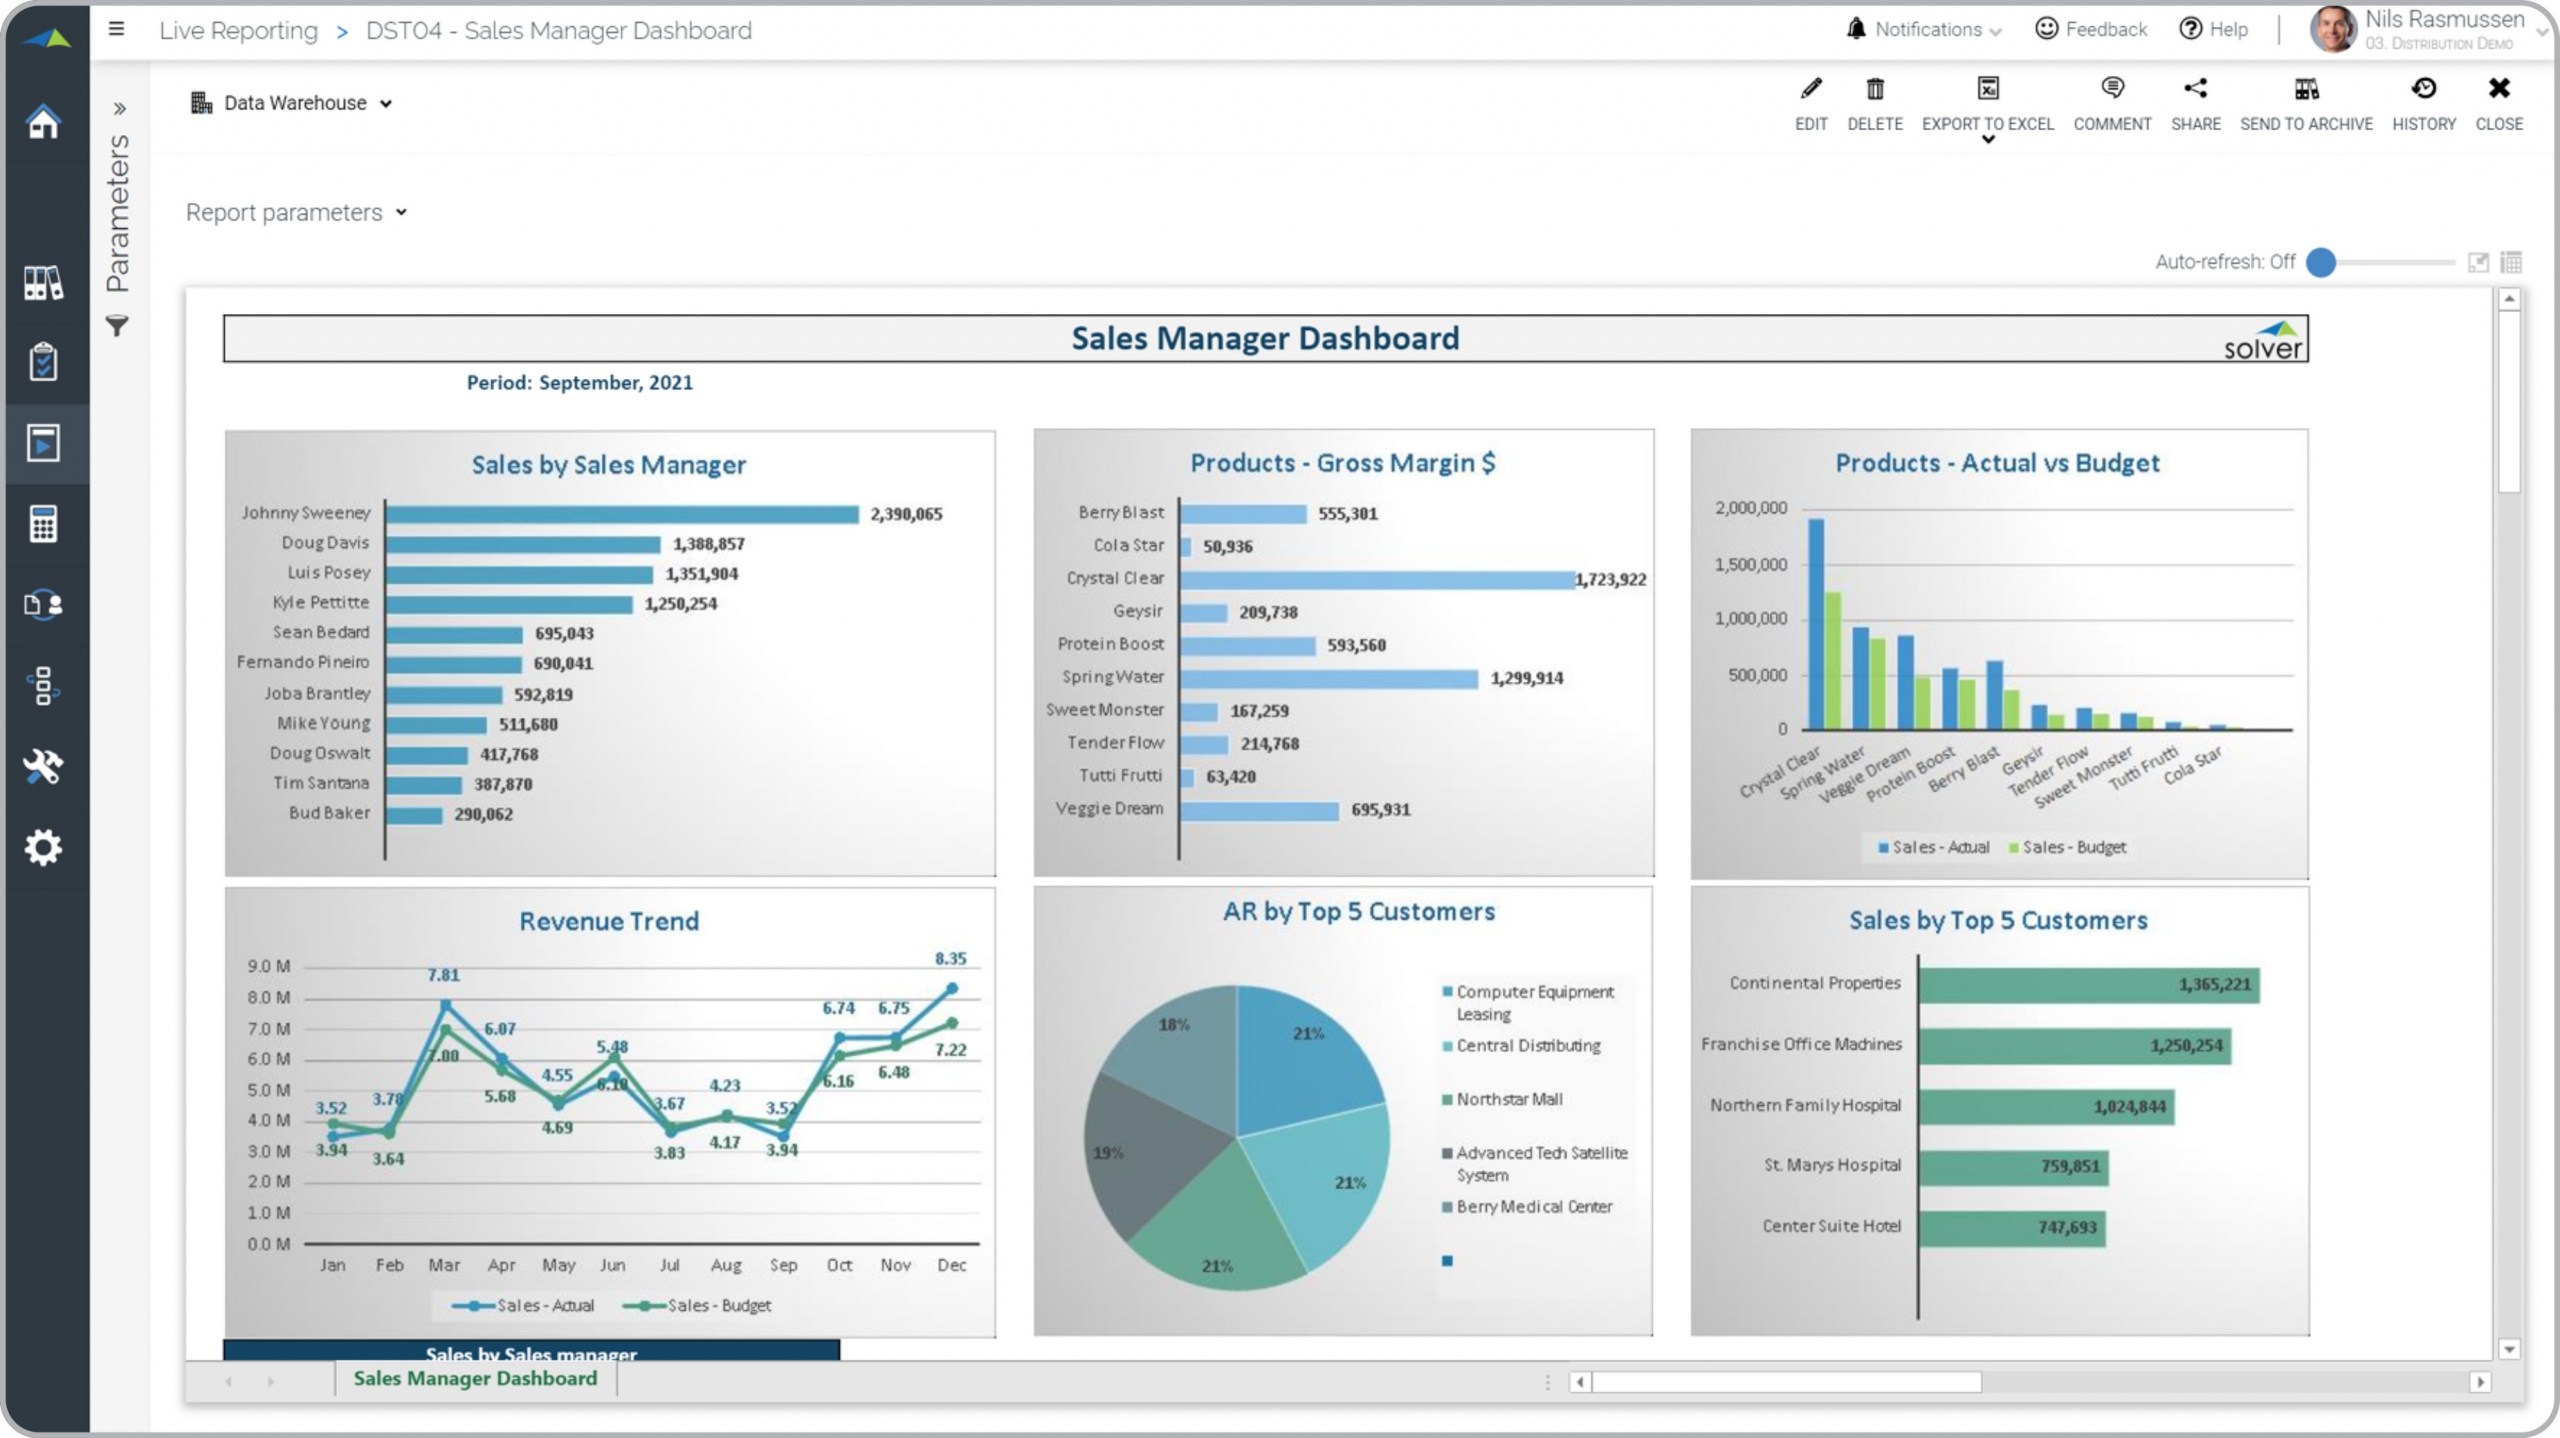
Sales Manager Dashboard for a Distribution Company
What is a Sales Manager Dashboard ? Sales manager dashboards are considered revenue analysis tools ...
Product Sales Dashboard for a Distribution Company
What is a Product Sales Dashboard for a Distribution Company ? Product sales dashboards are ...
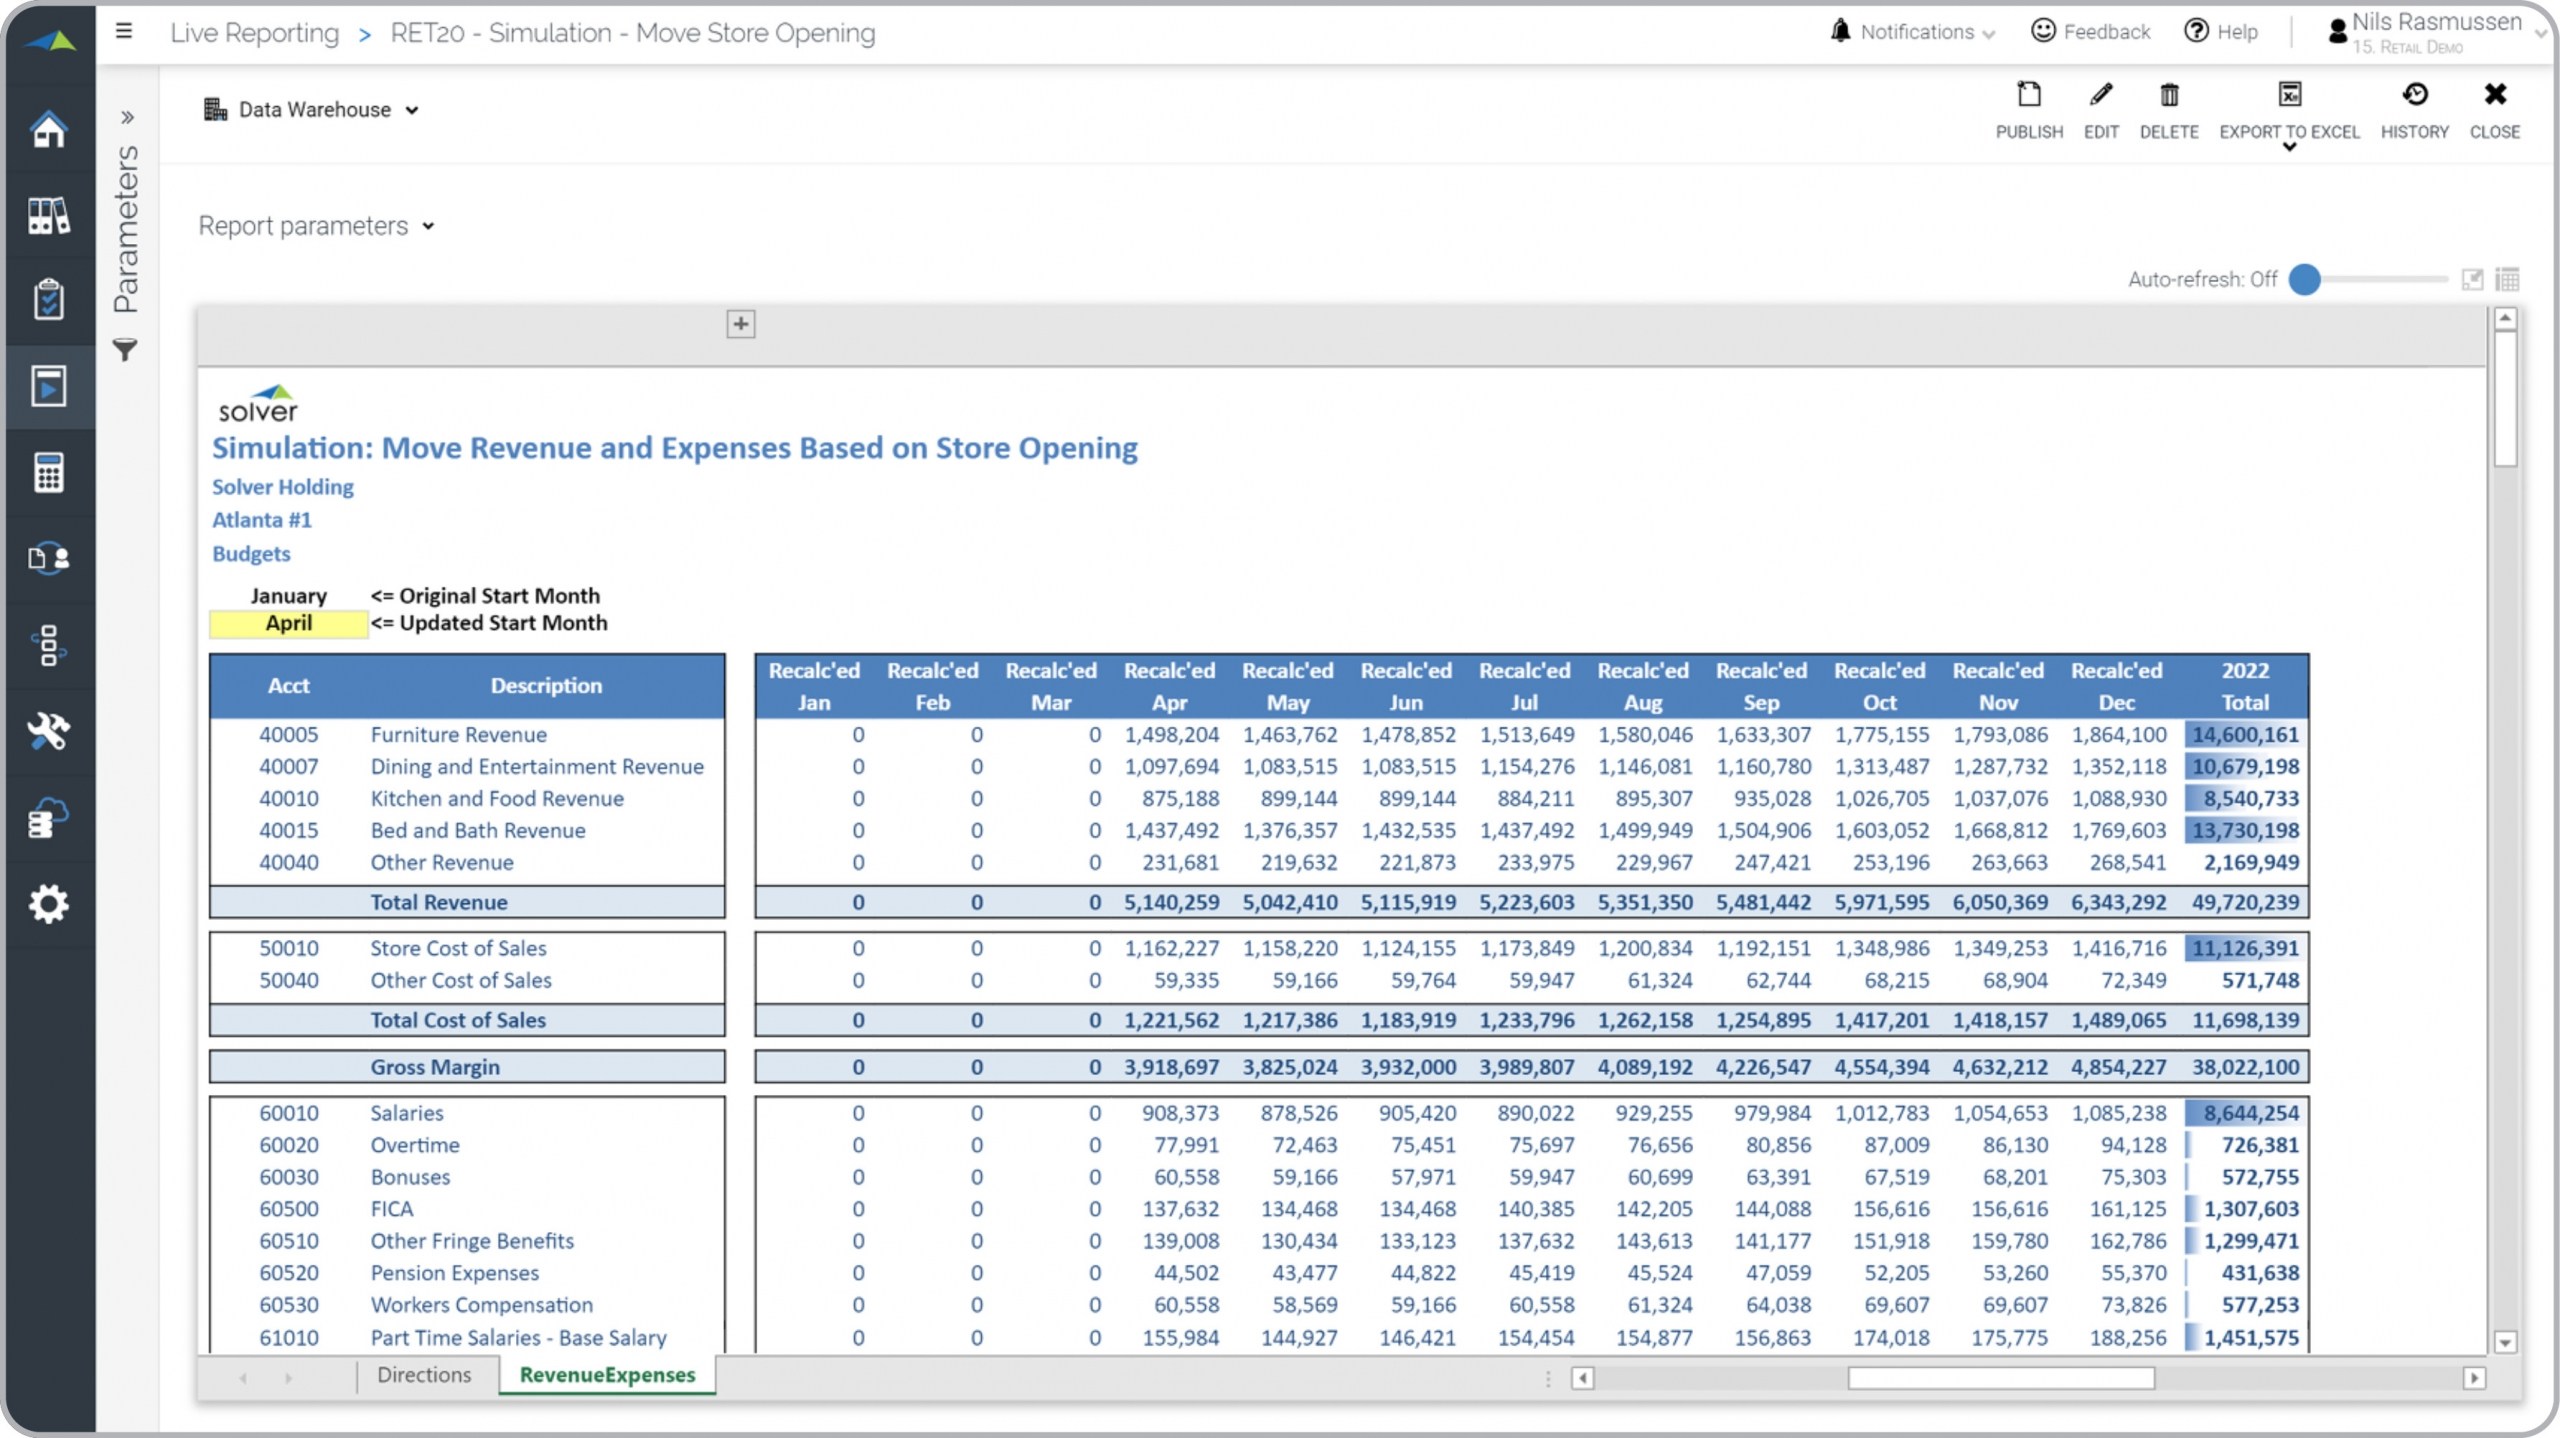
Automated Forecast for New Retail Store Opening
What is a Forecast for New Retail Store Opening ? New retail store forecasts and budgets are ...
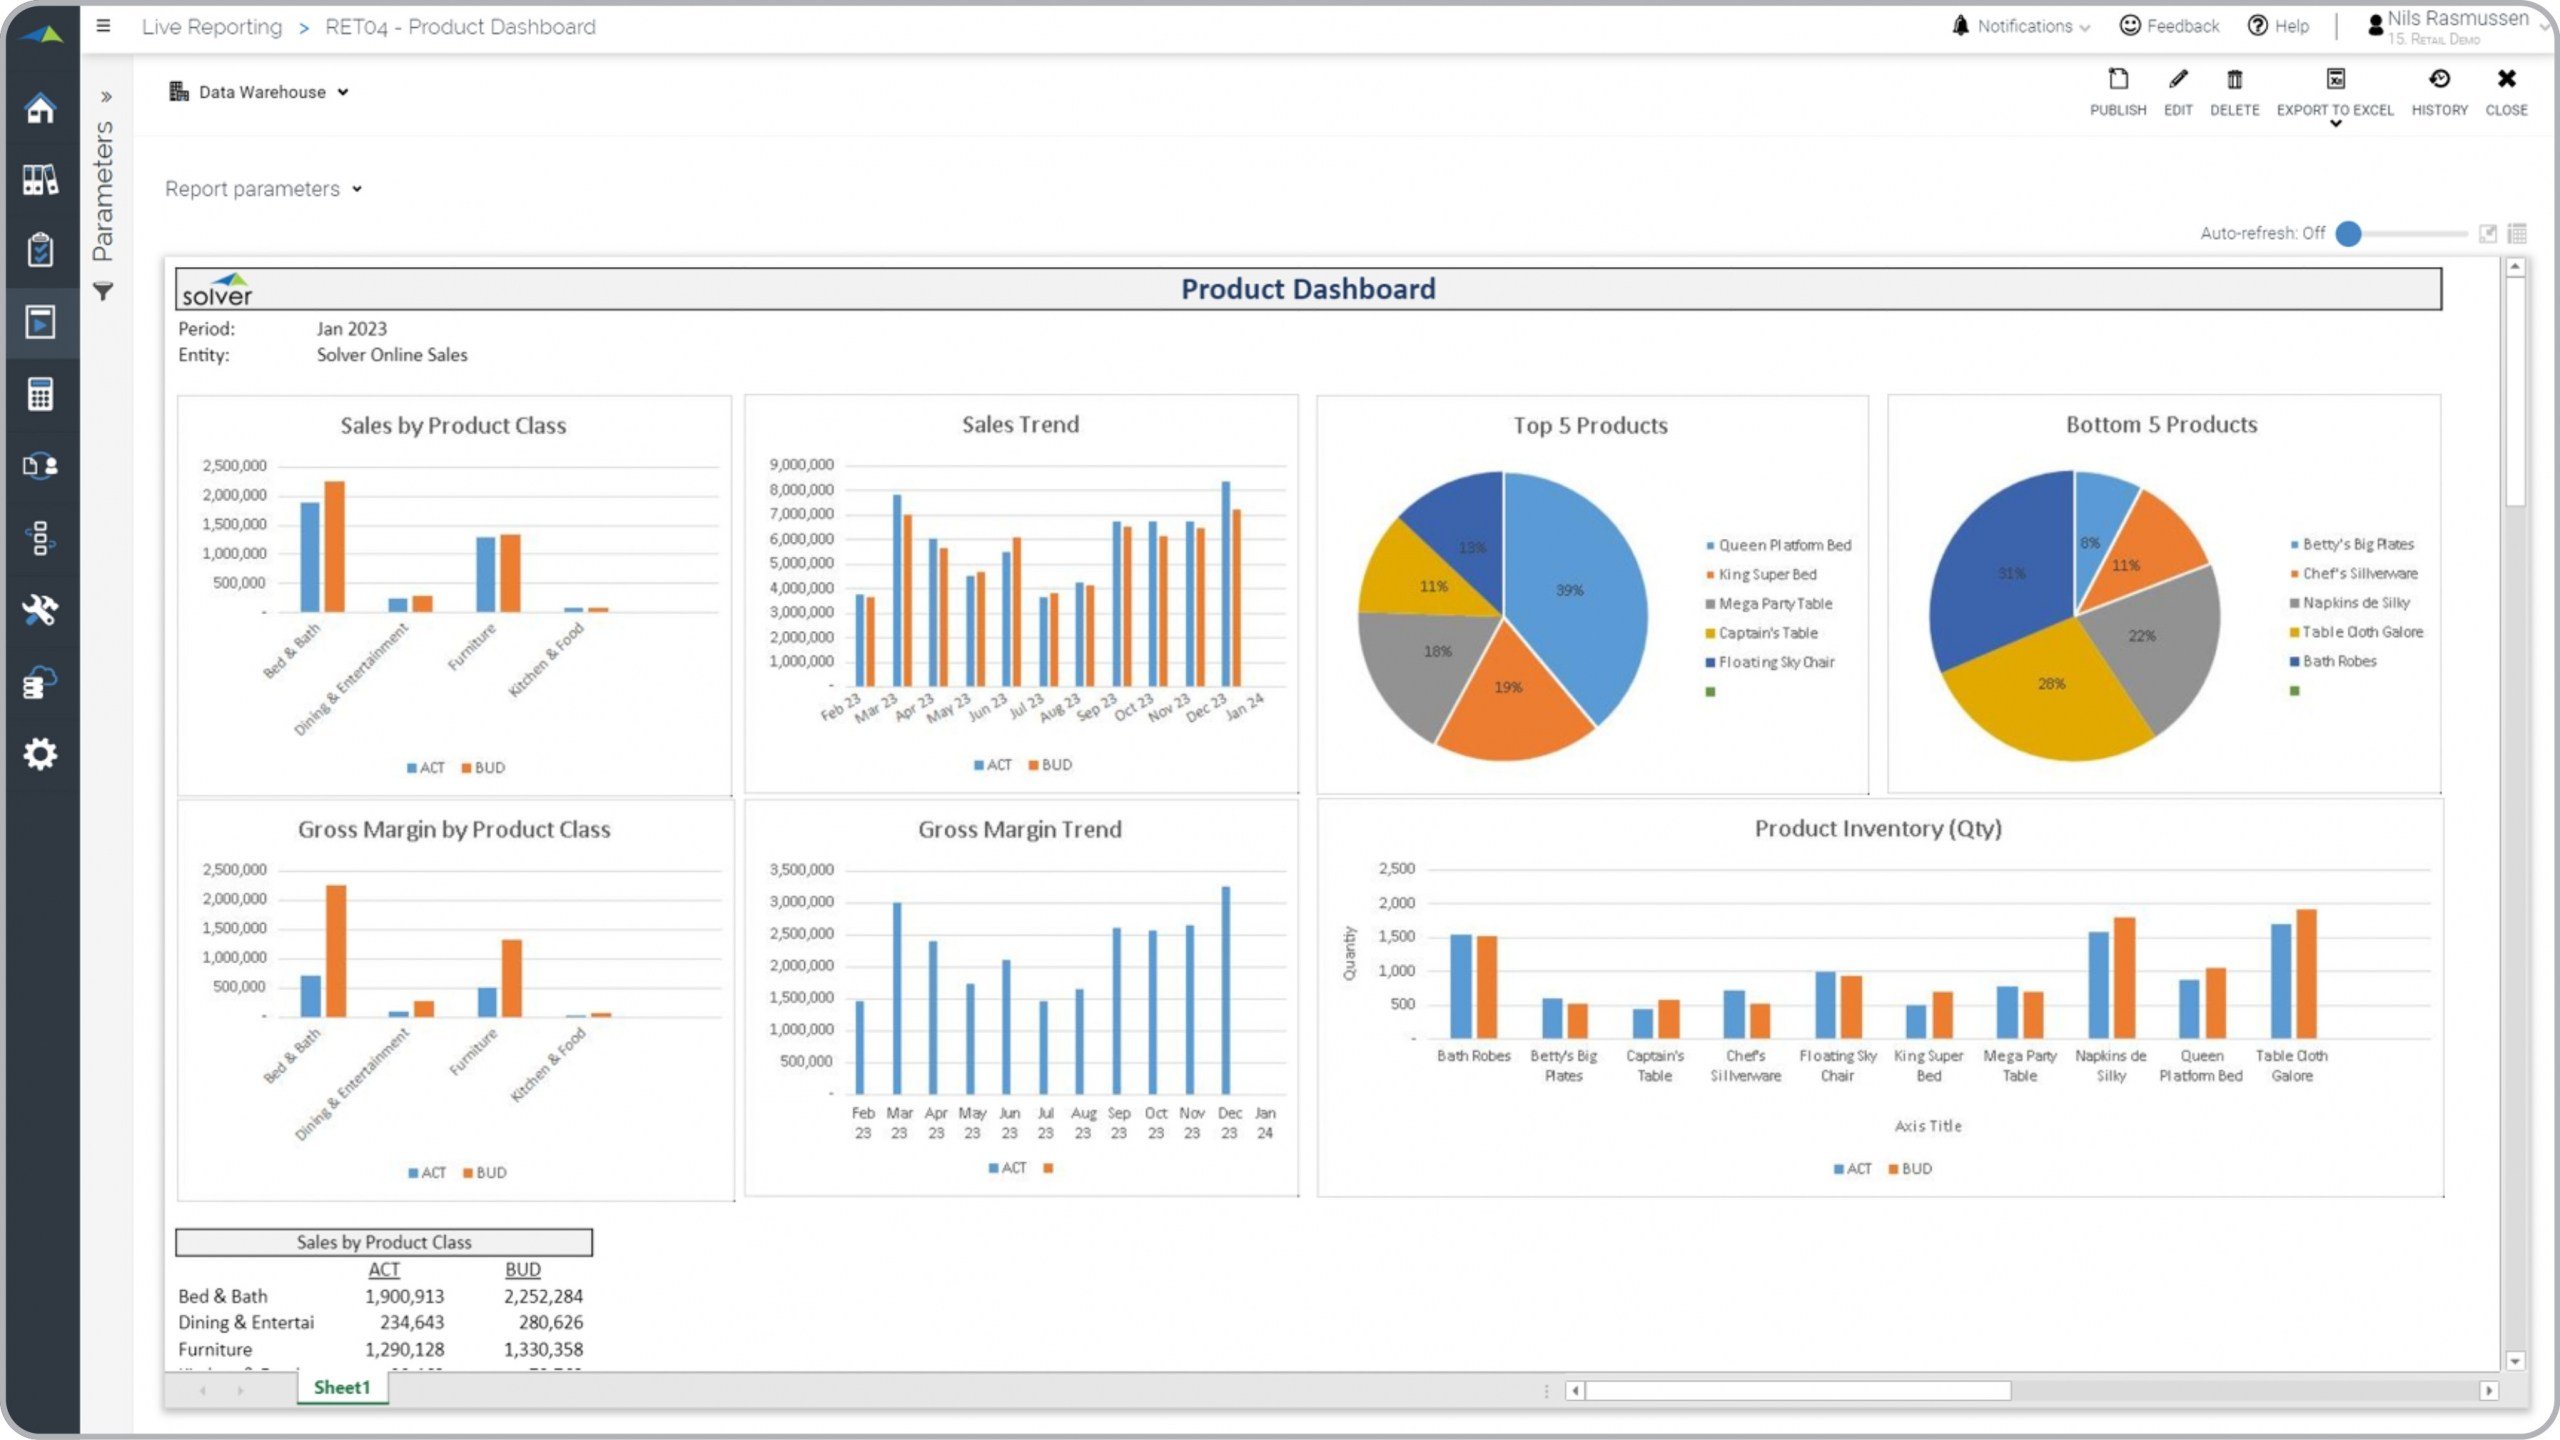
Product Dashboard for a Retail Company
What is a Product Dashboard for a Retail Company ? Product dashboards are considered operational ...
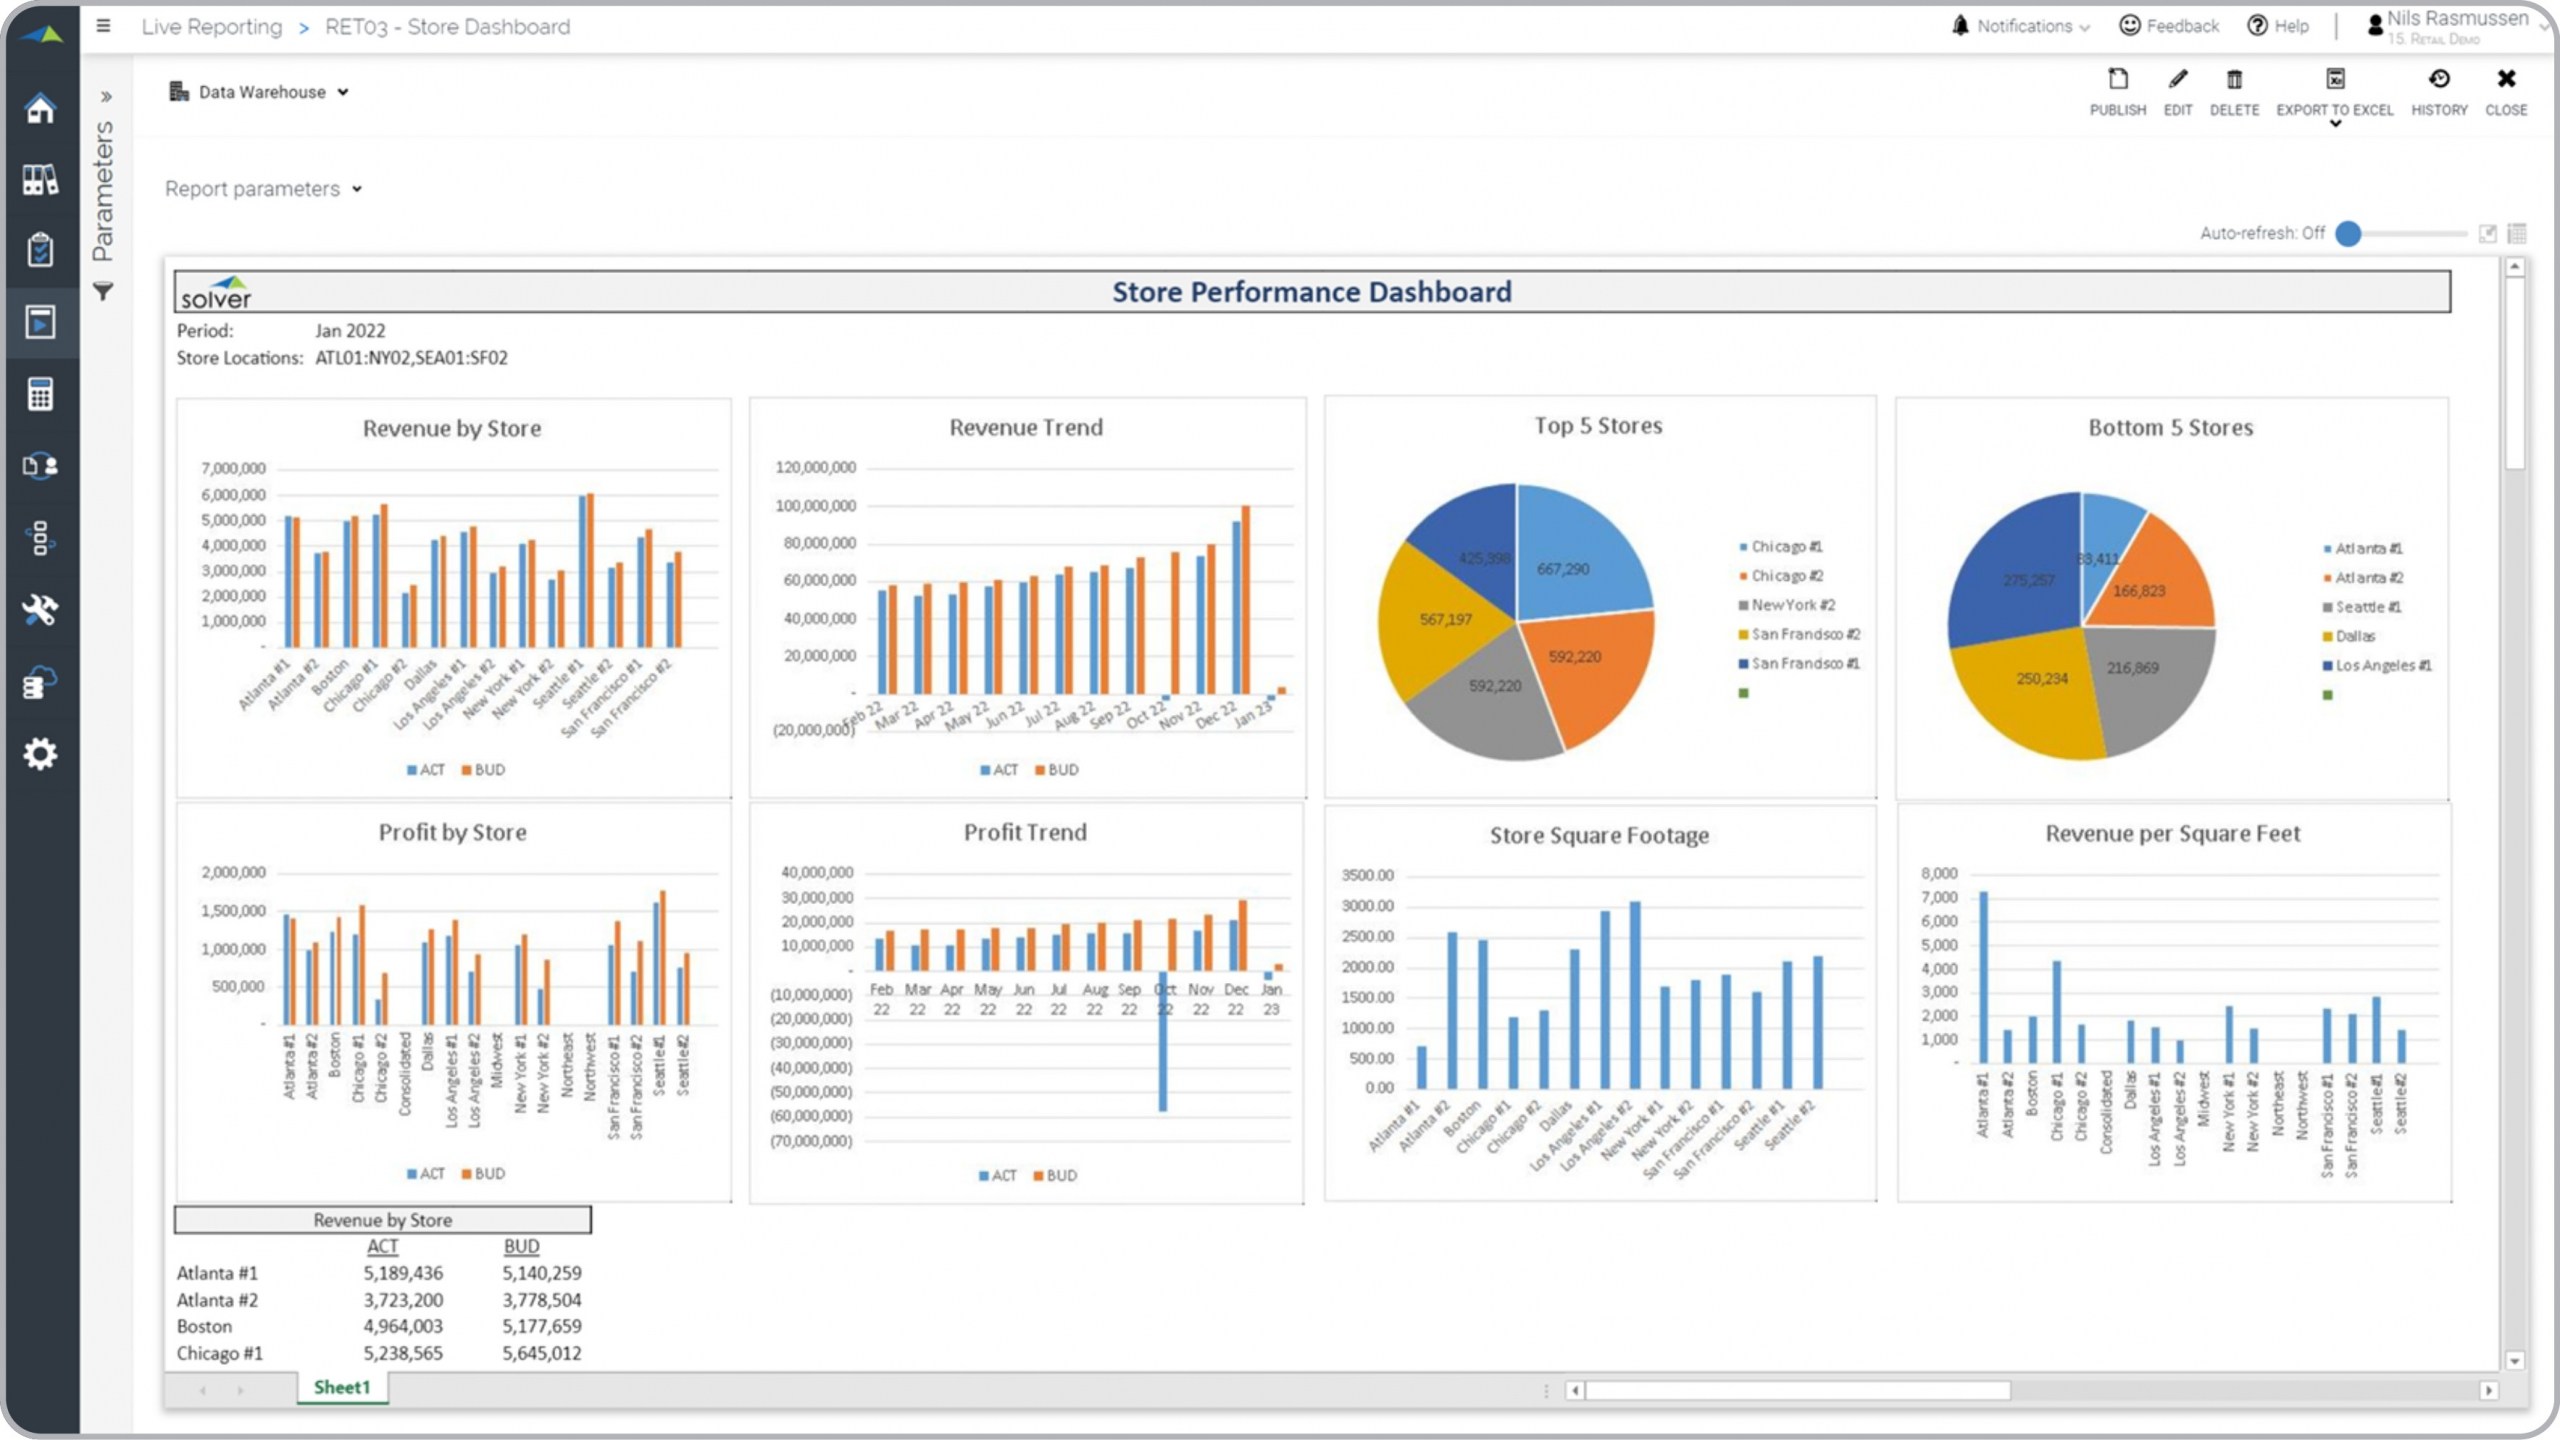
Store Performance Dashboard for a Retail Company
What is a Store Performance Dashboard for a Retail Company ? Store performance reports are ...
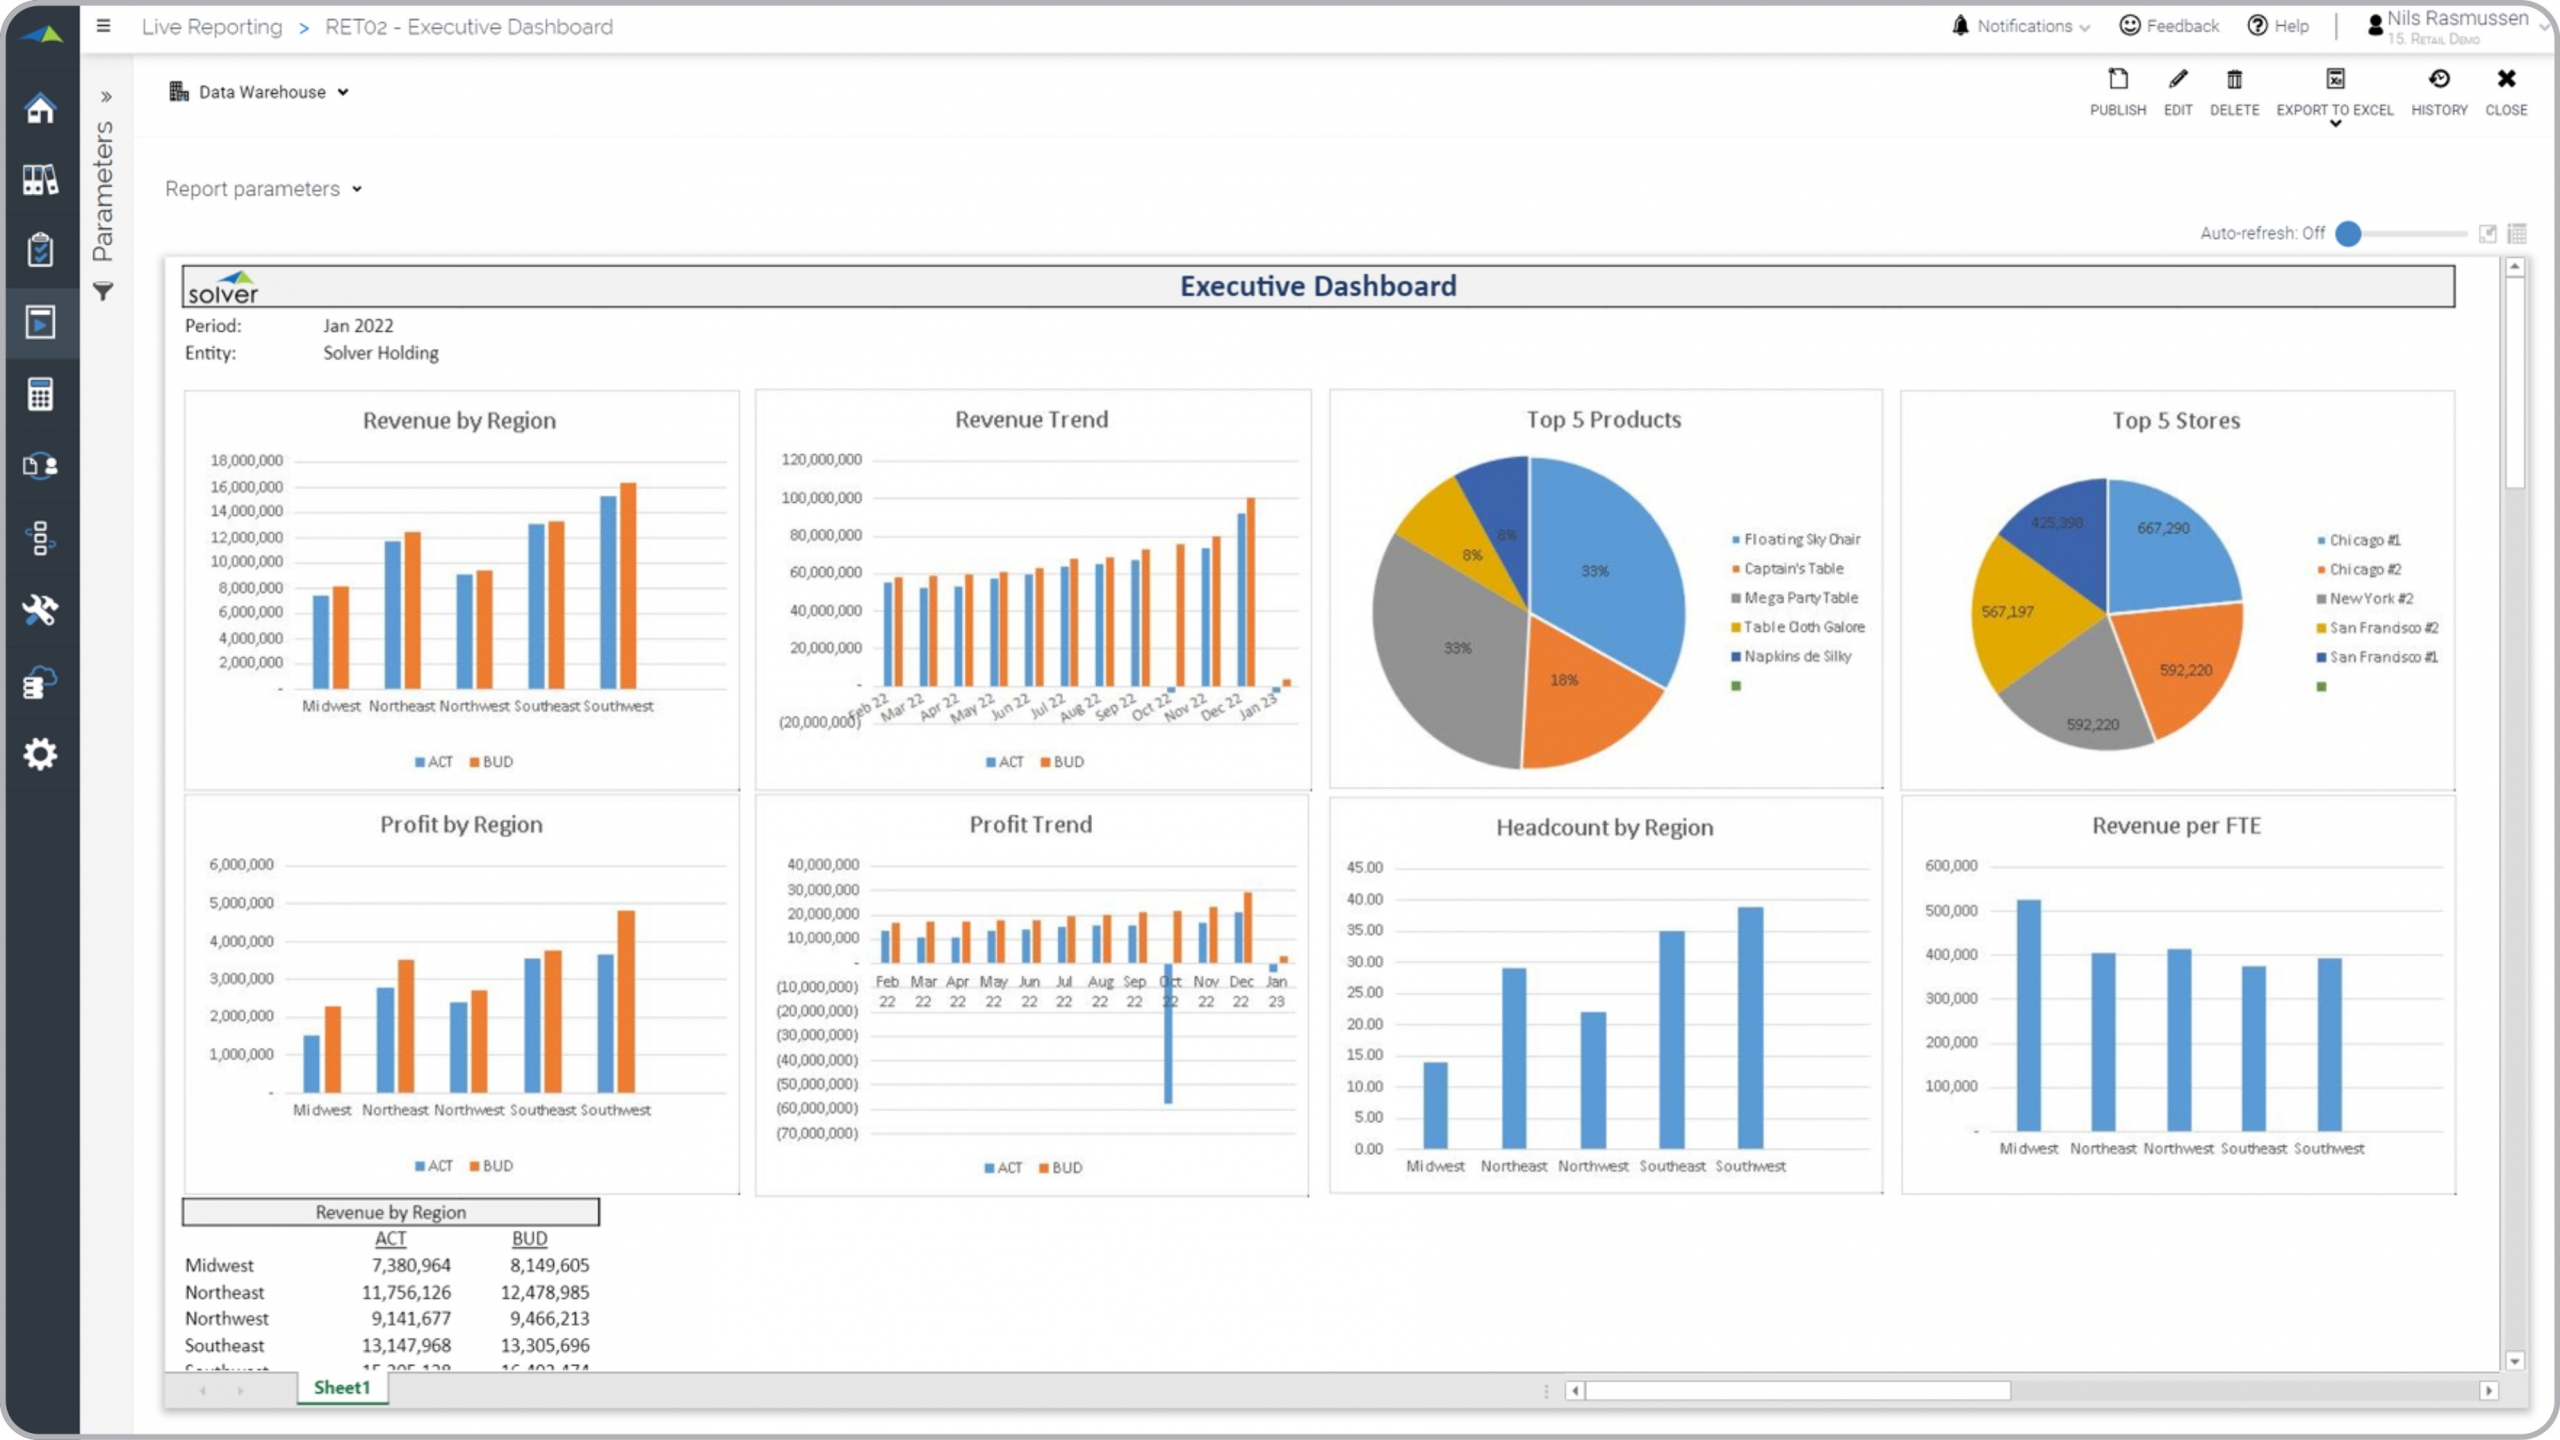
Executive Dashboard for a Retail Company
What is a n Executive Dashboard for a Retail Company ? Executive dashboards are considered ...
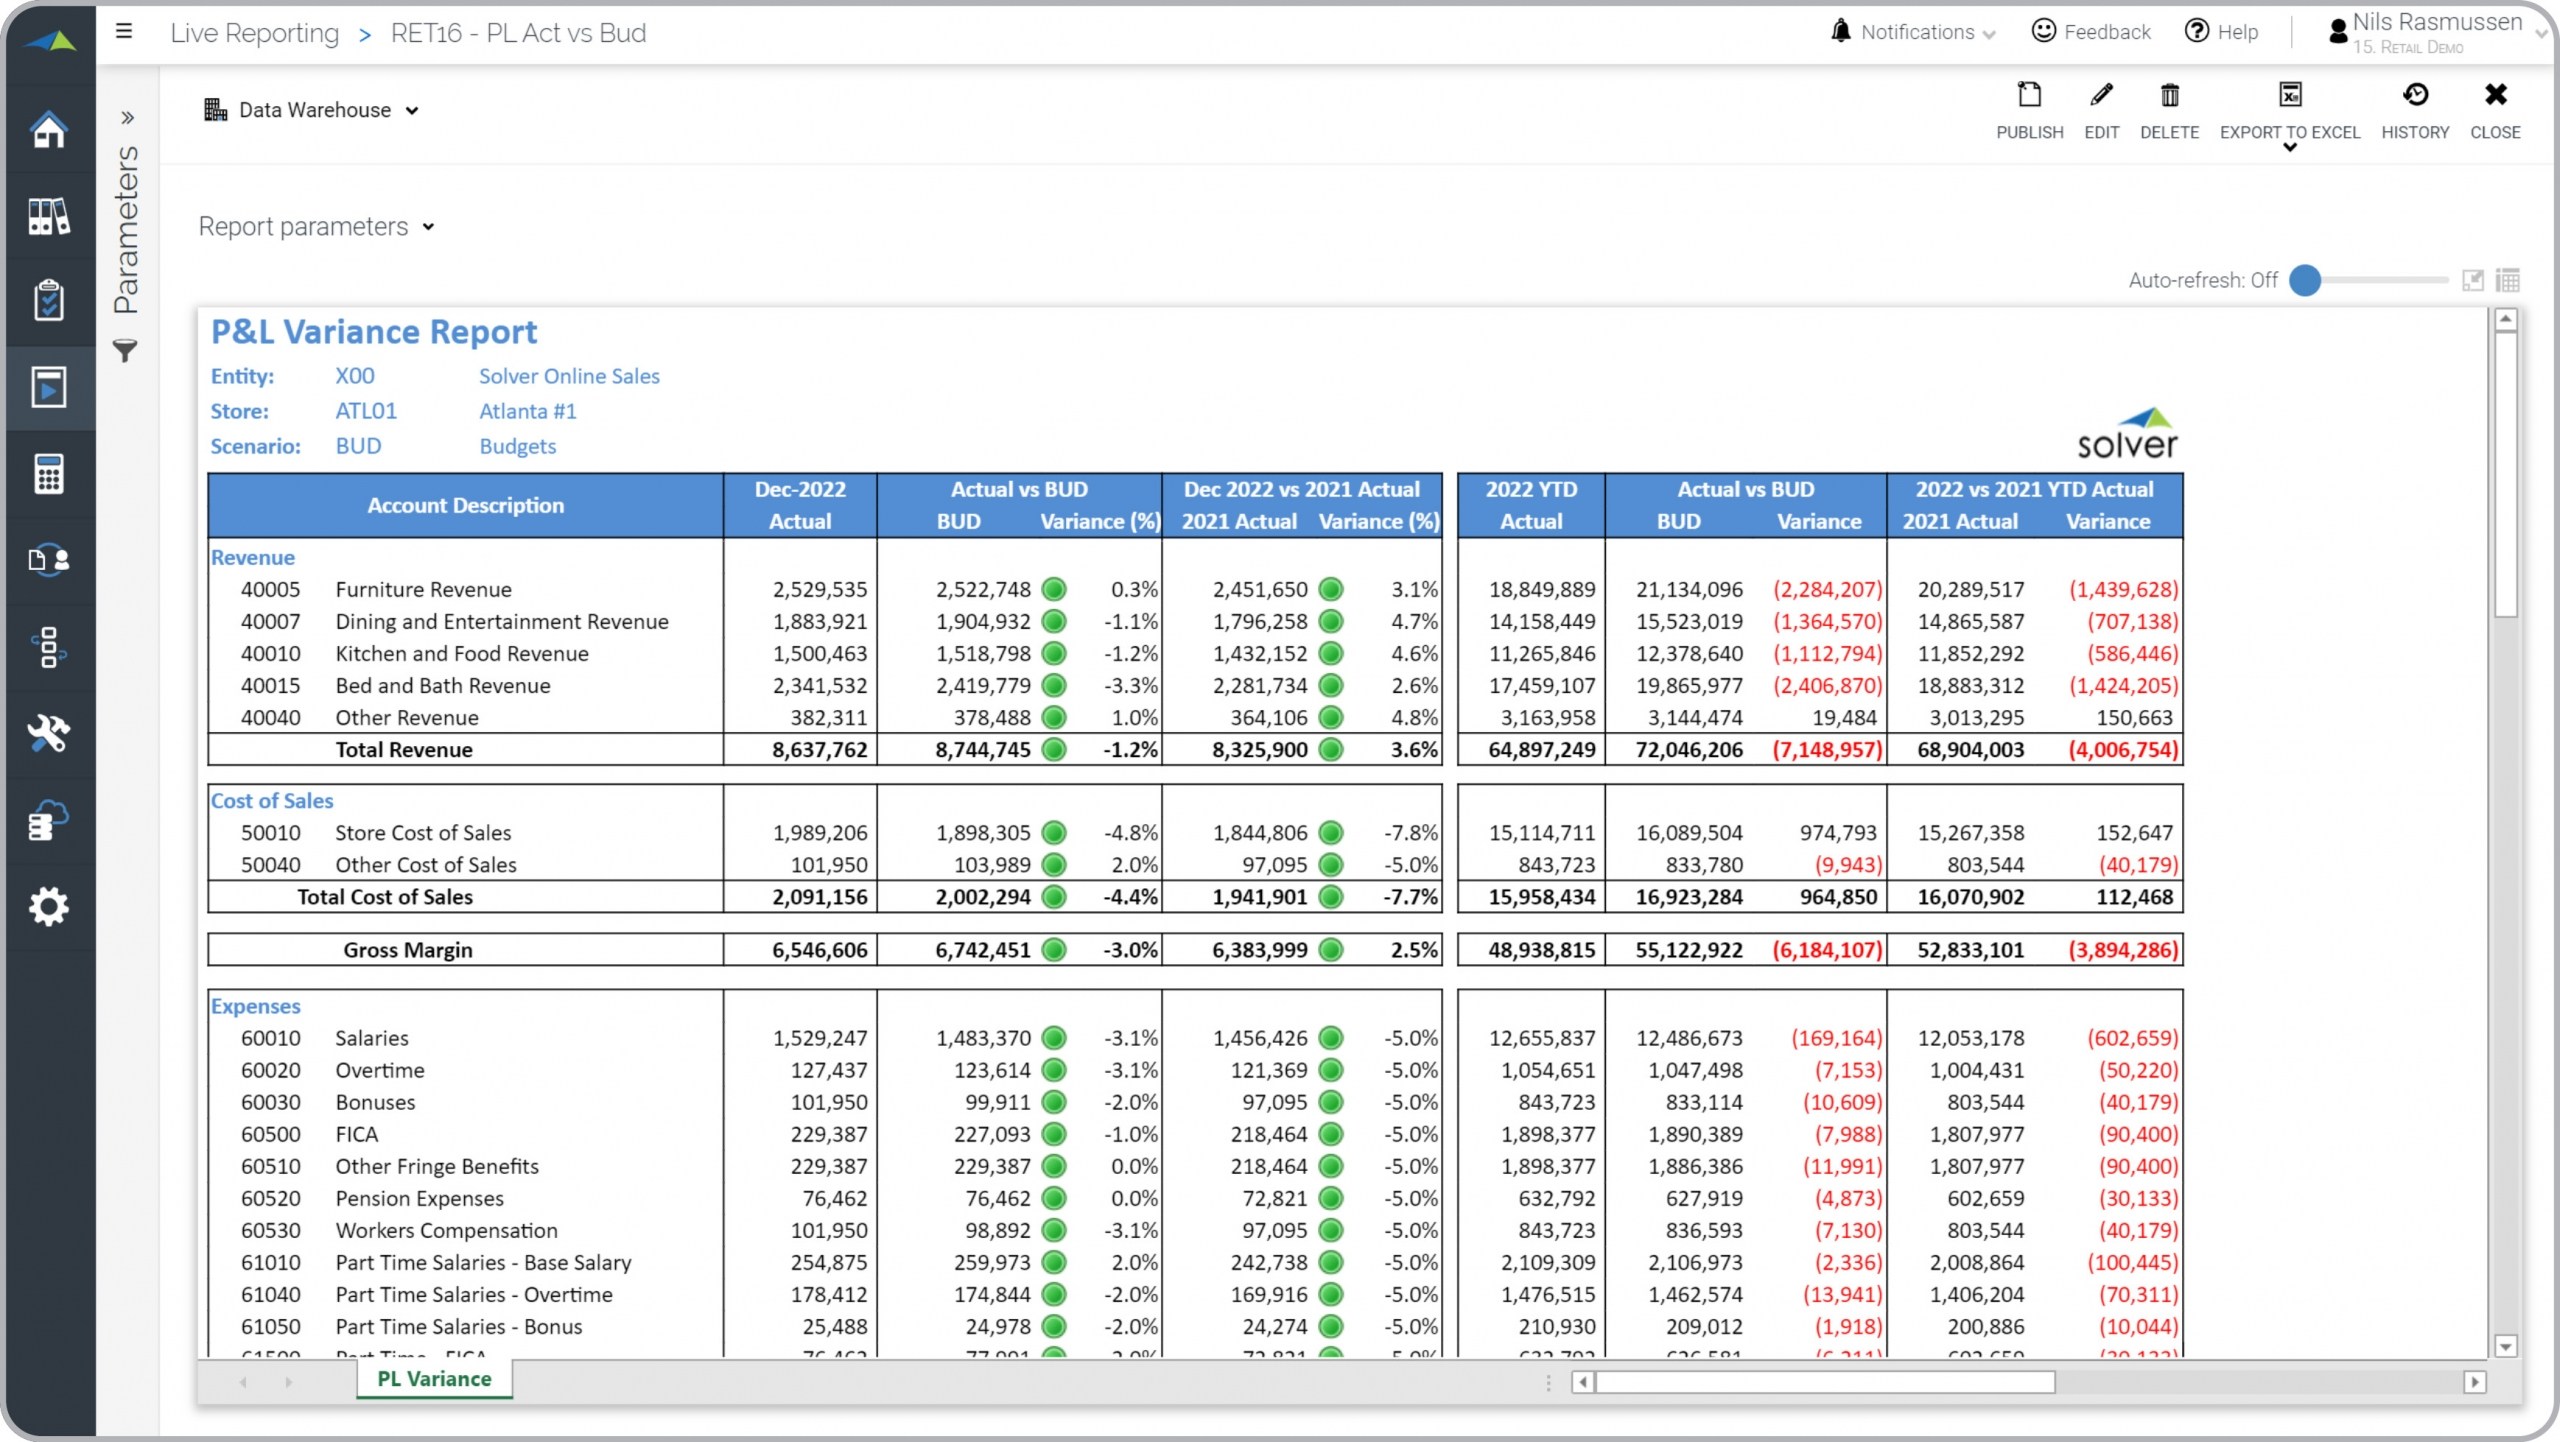
Profit & Loss Variance Report for a Retail Company
What is a Profit & Loss Variance Report ? Profit & Loss (P&L) reports are considered ...
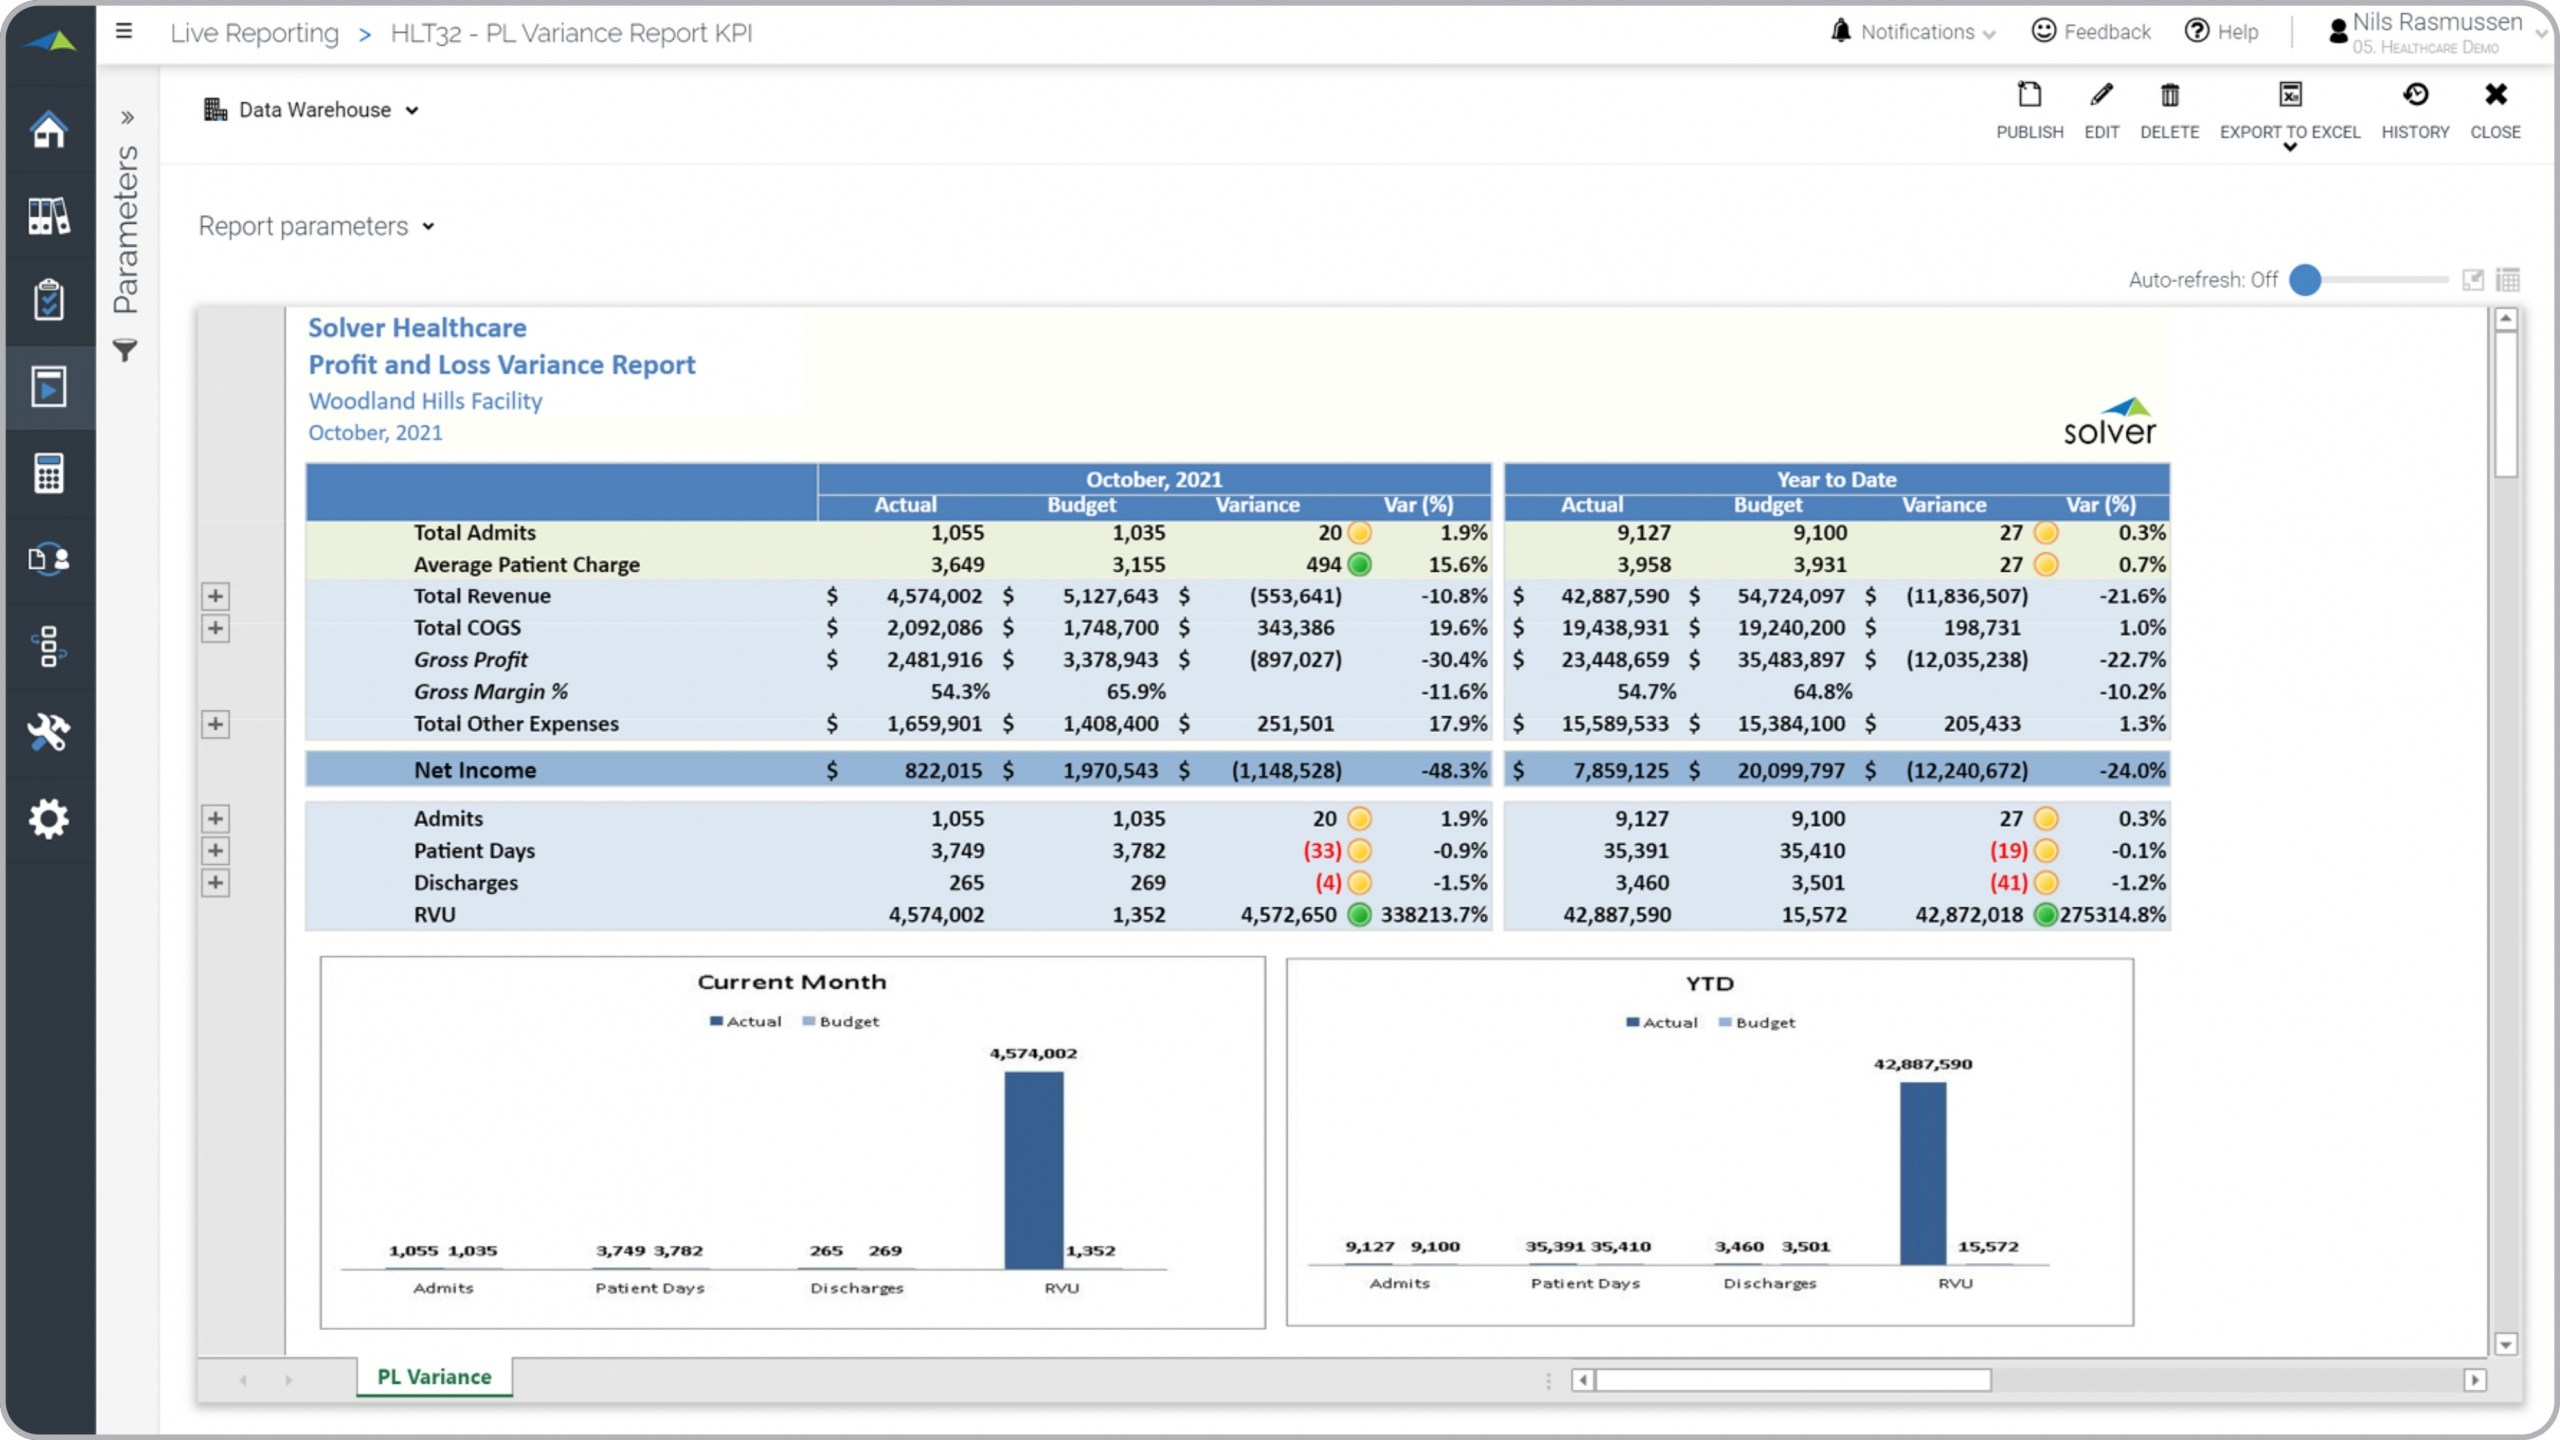
Profit & Loss Report with KPIs for a Healthcare Provider
What is a Profit & Loss Report with KPIs ? Profit & Loss (P&L) reports with KPIs are ...
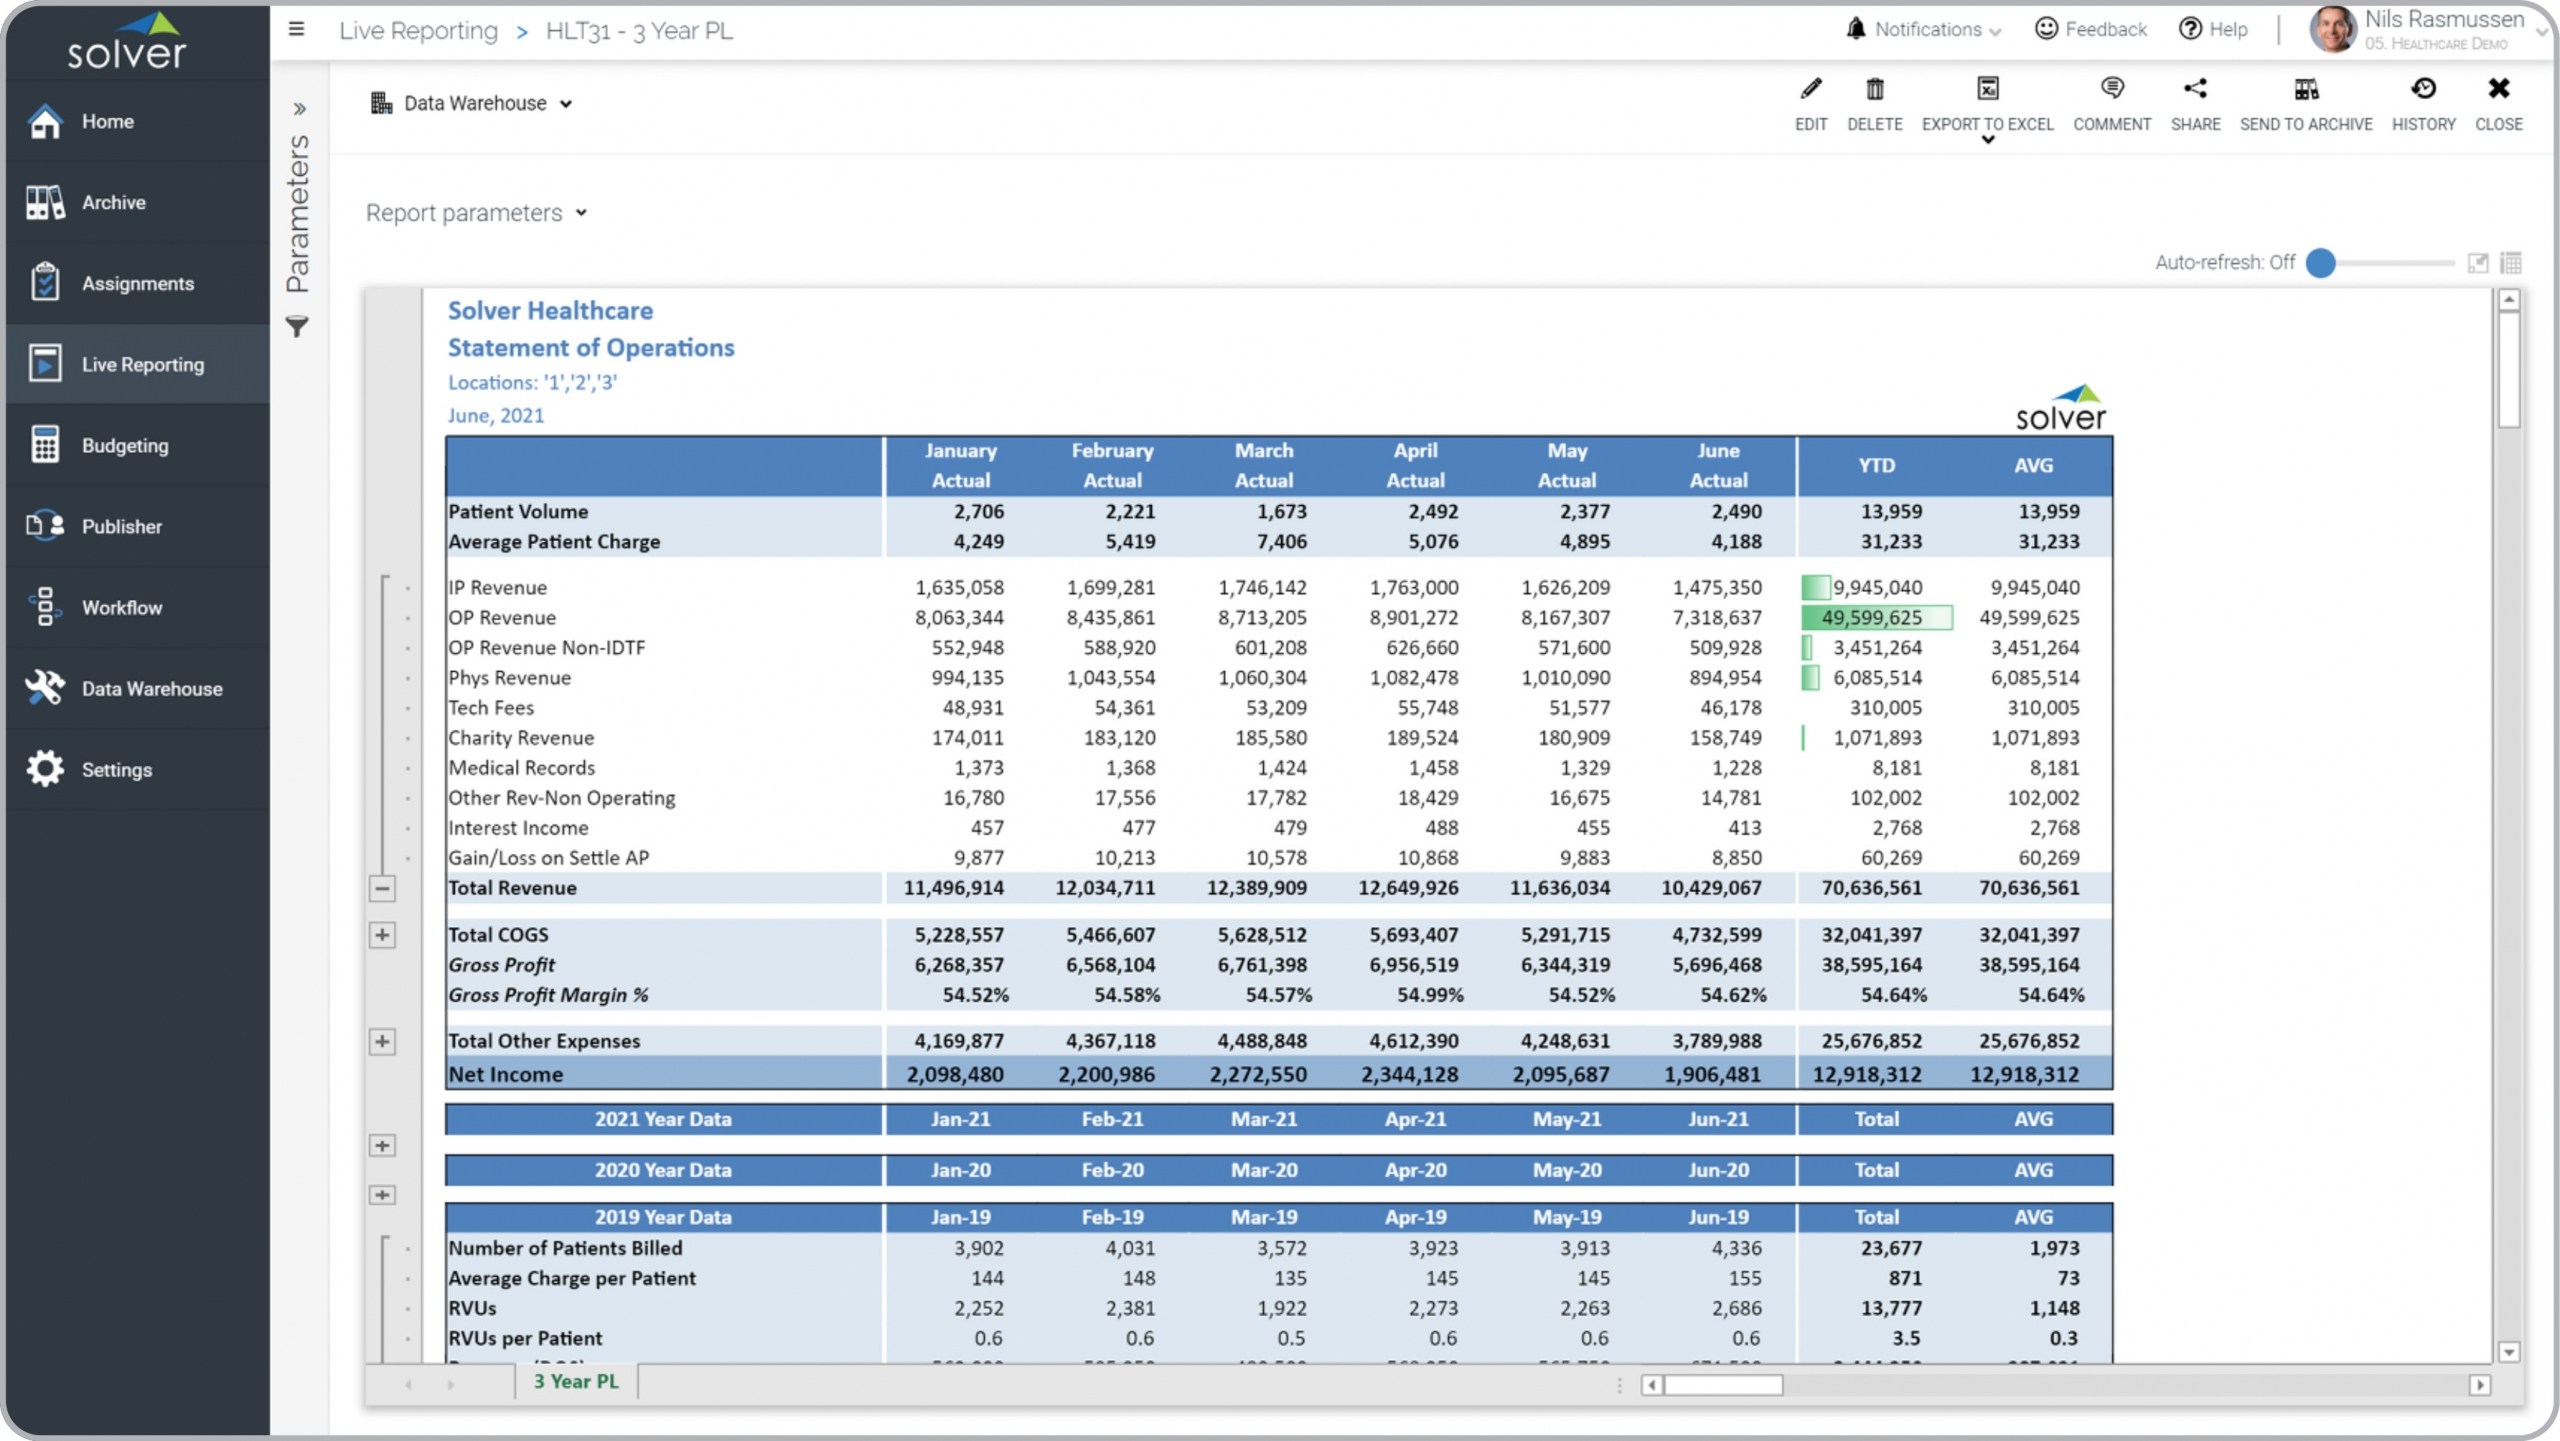
Statement of Operations for a Healthcare Provider
What is a Statement of Operations ? Statement of Operations reports with multi-year KPIs are ...
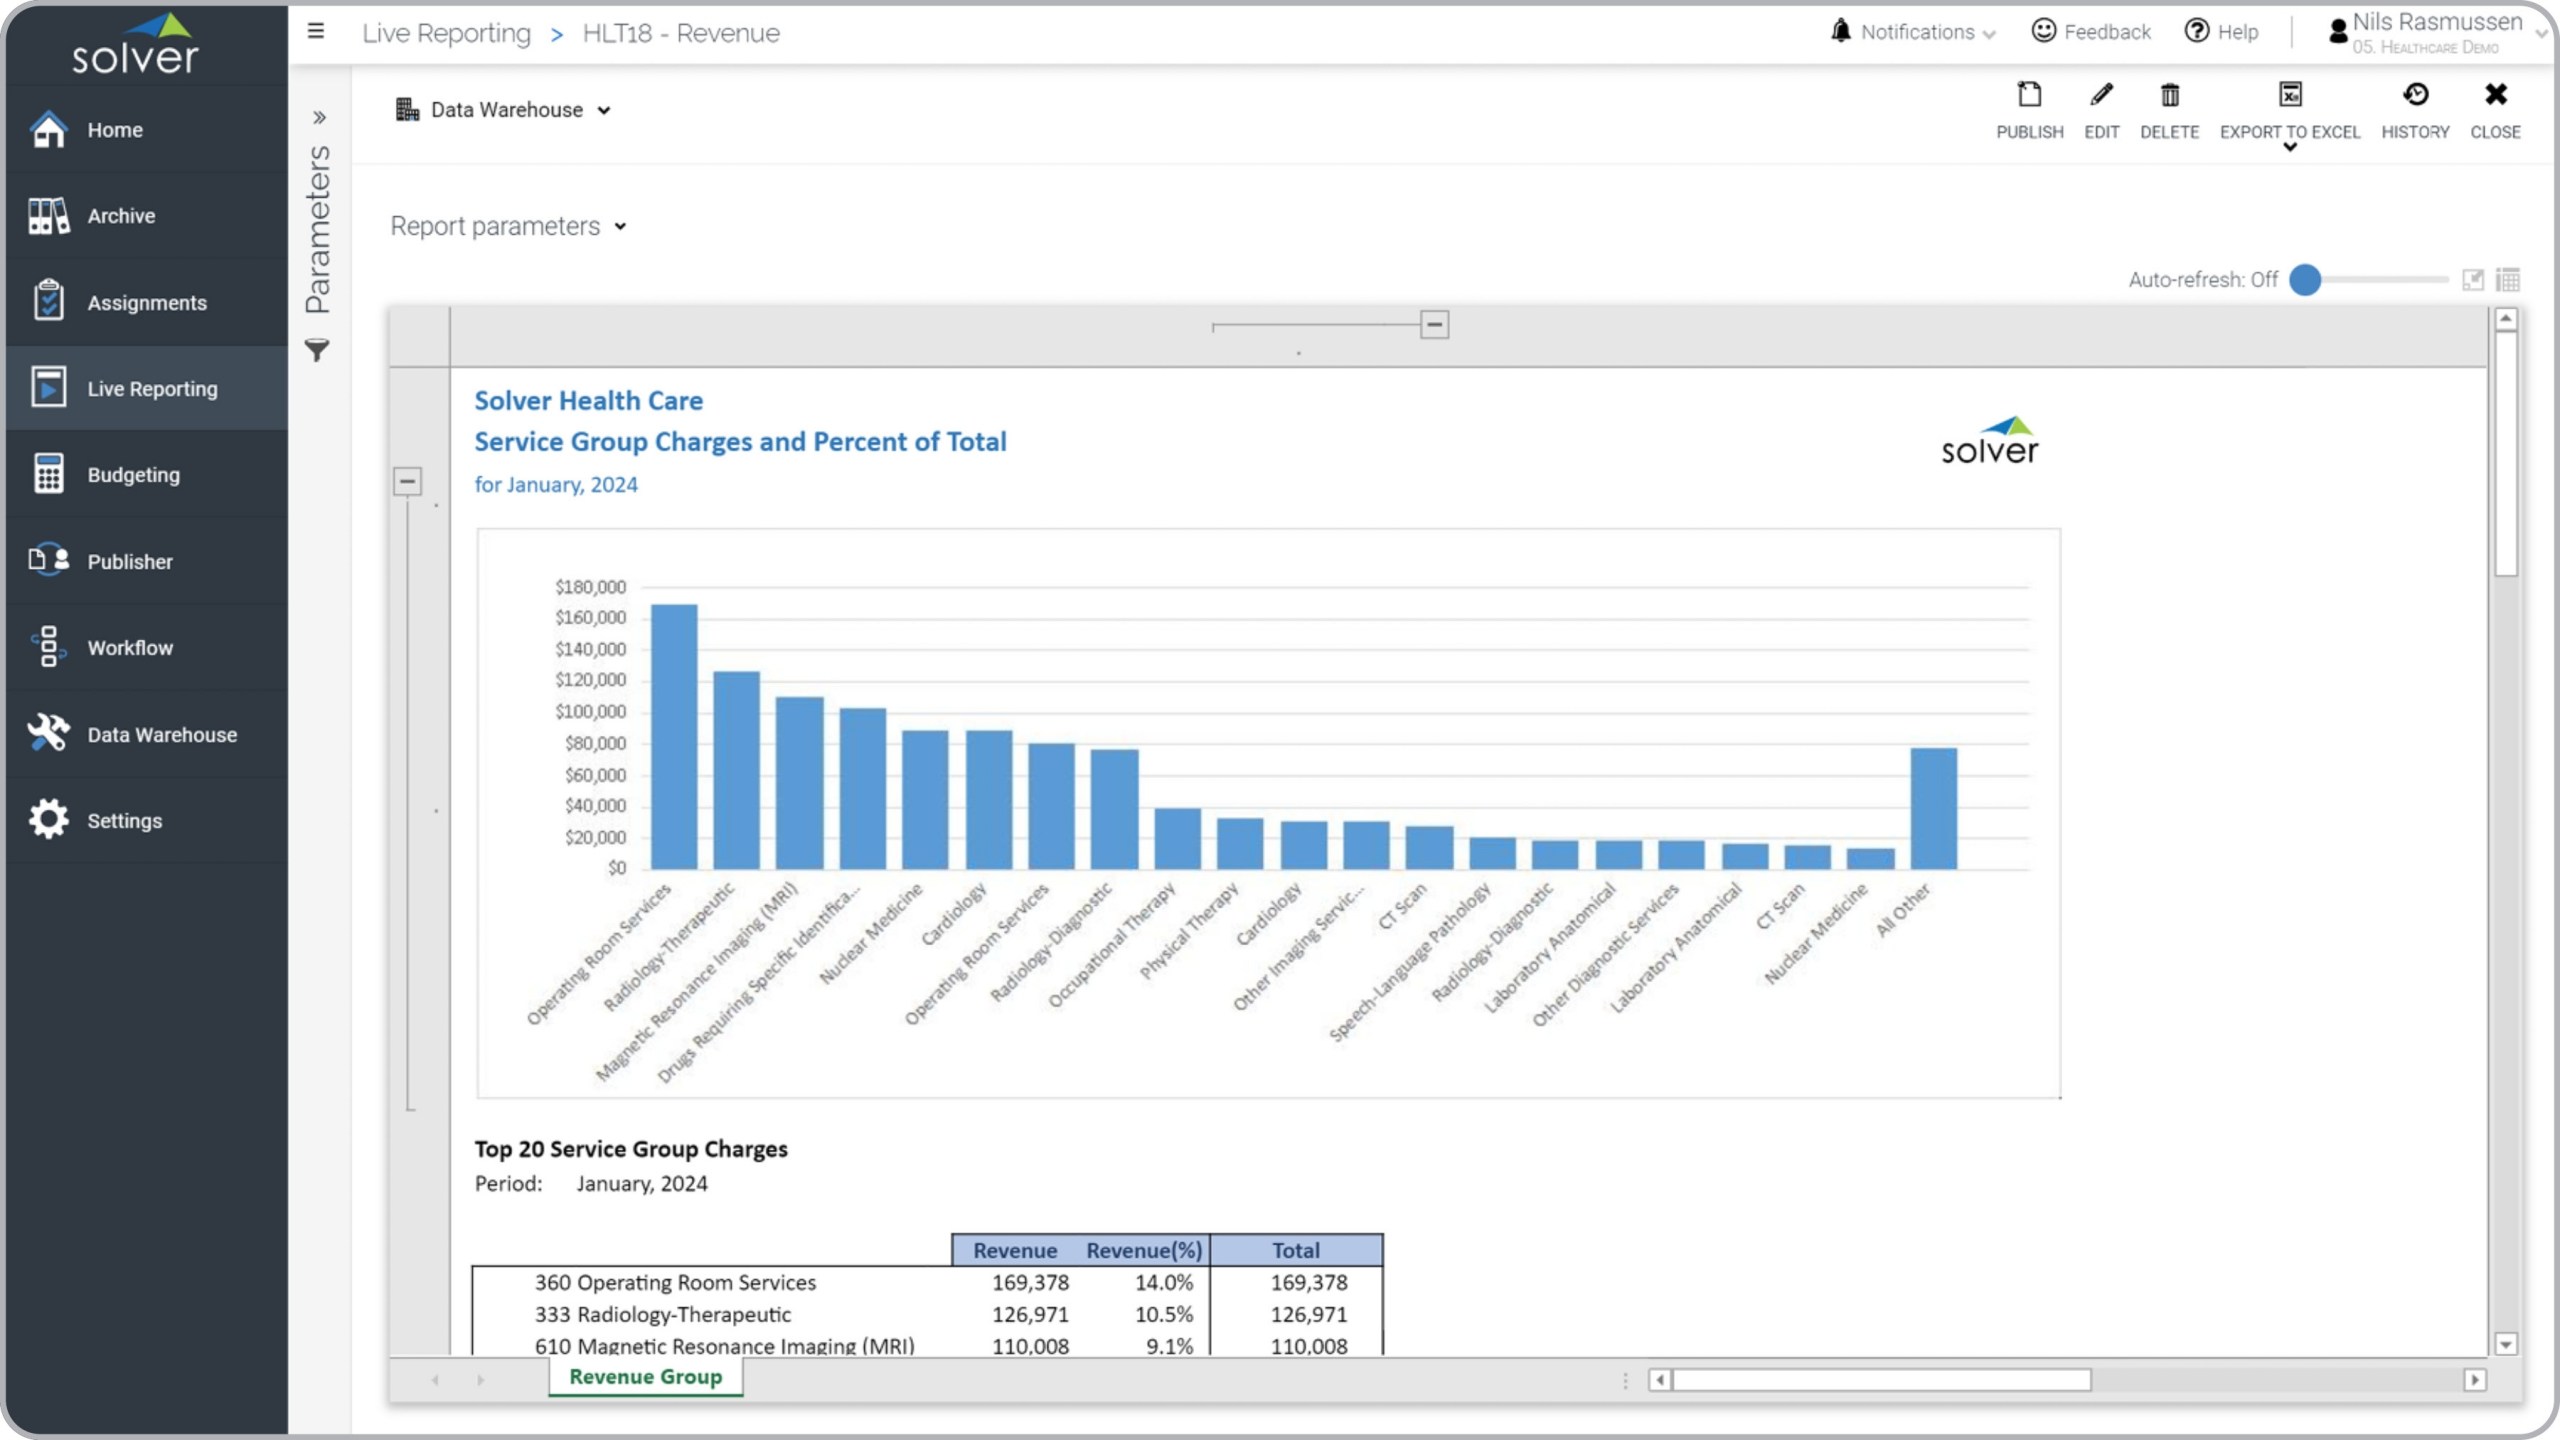
Revenue by Service Group Report for Healthcare Providers
What is a Revenue by Service Group Report for a Healthcare Provider ? Revenue by service group ...
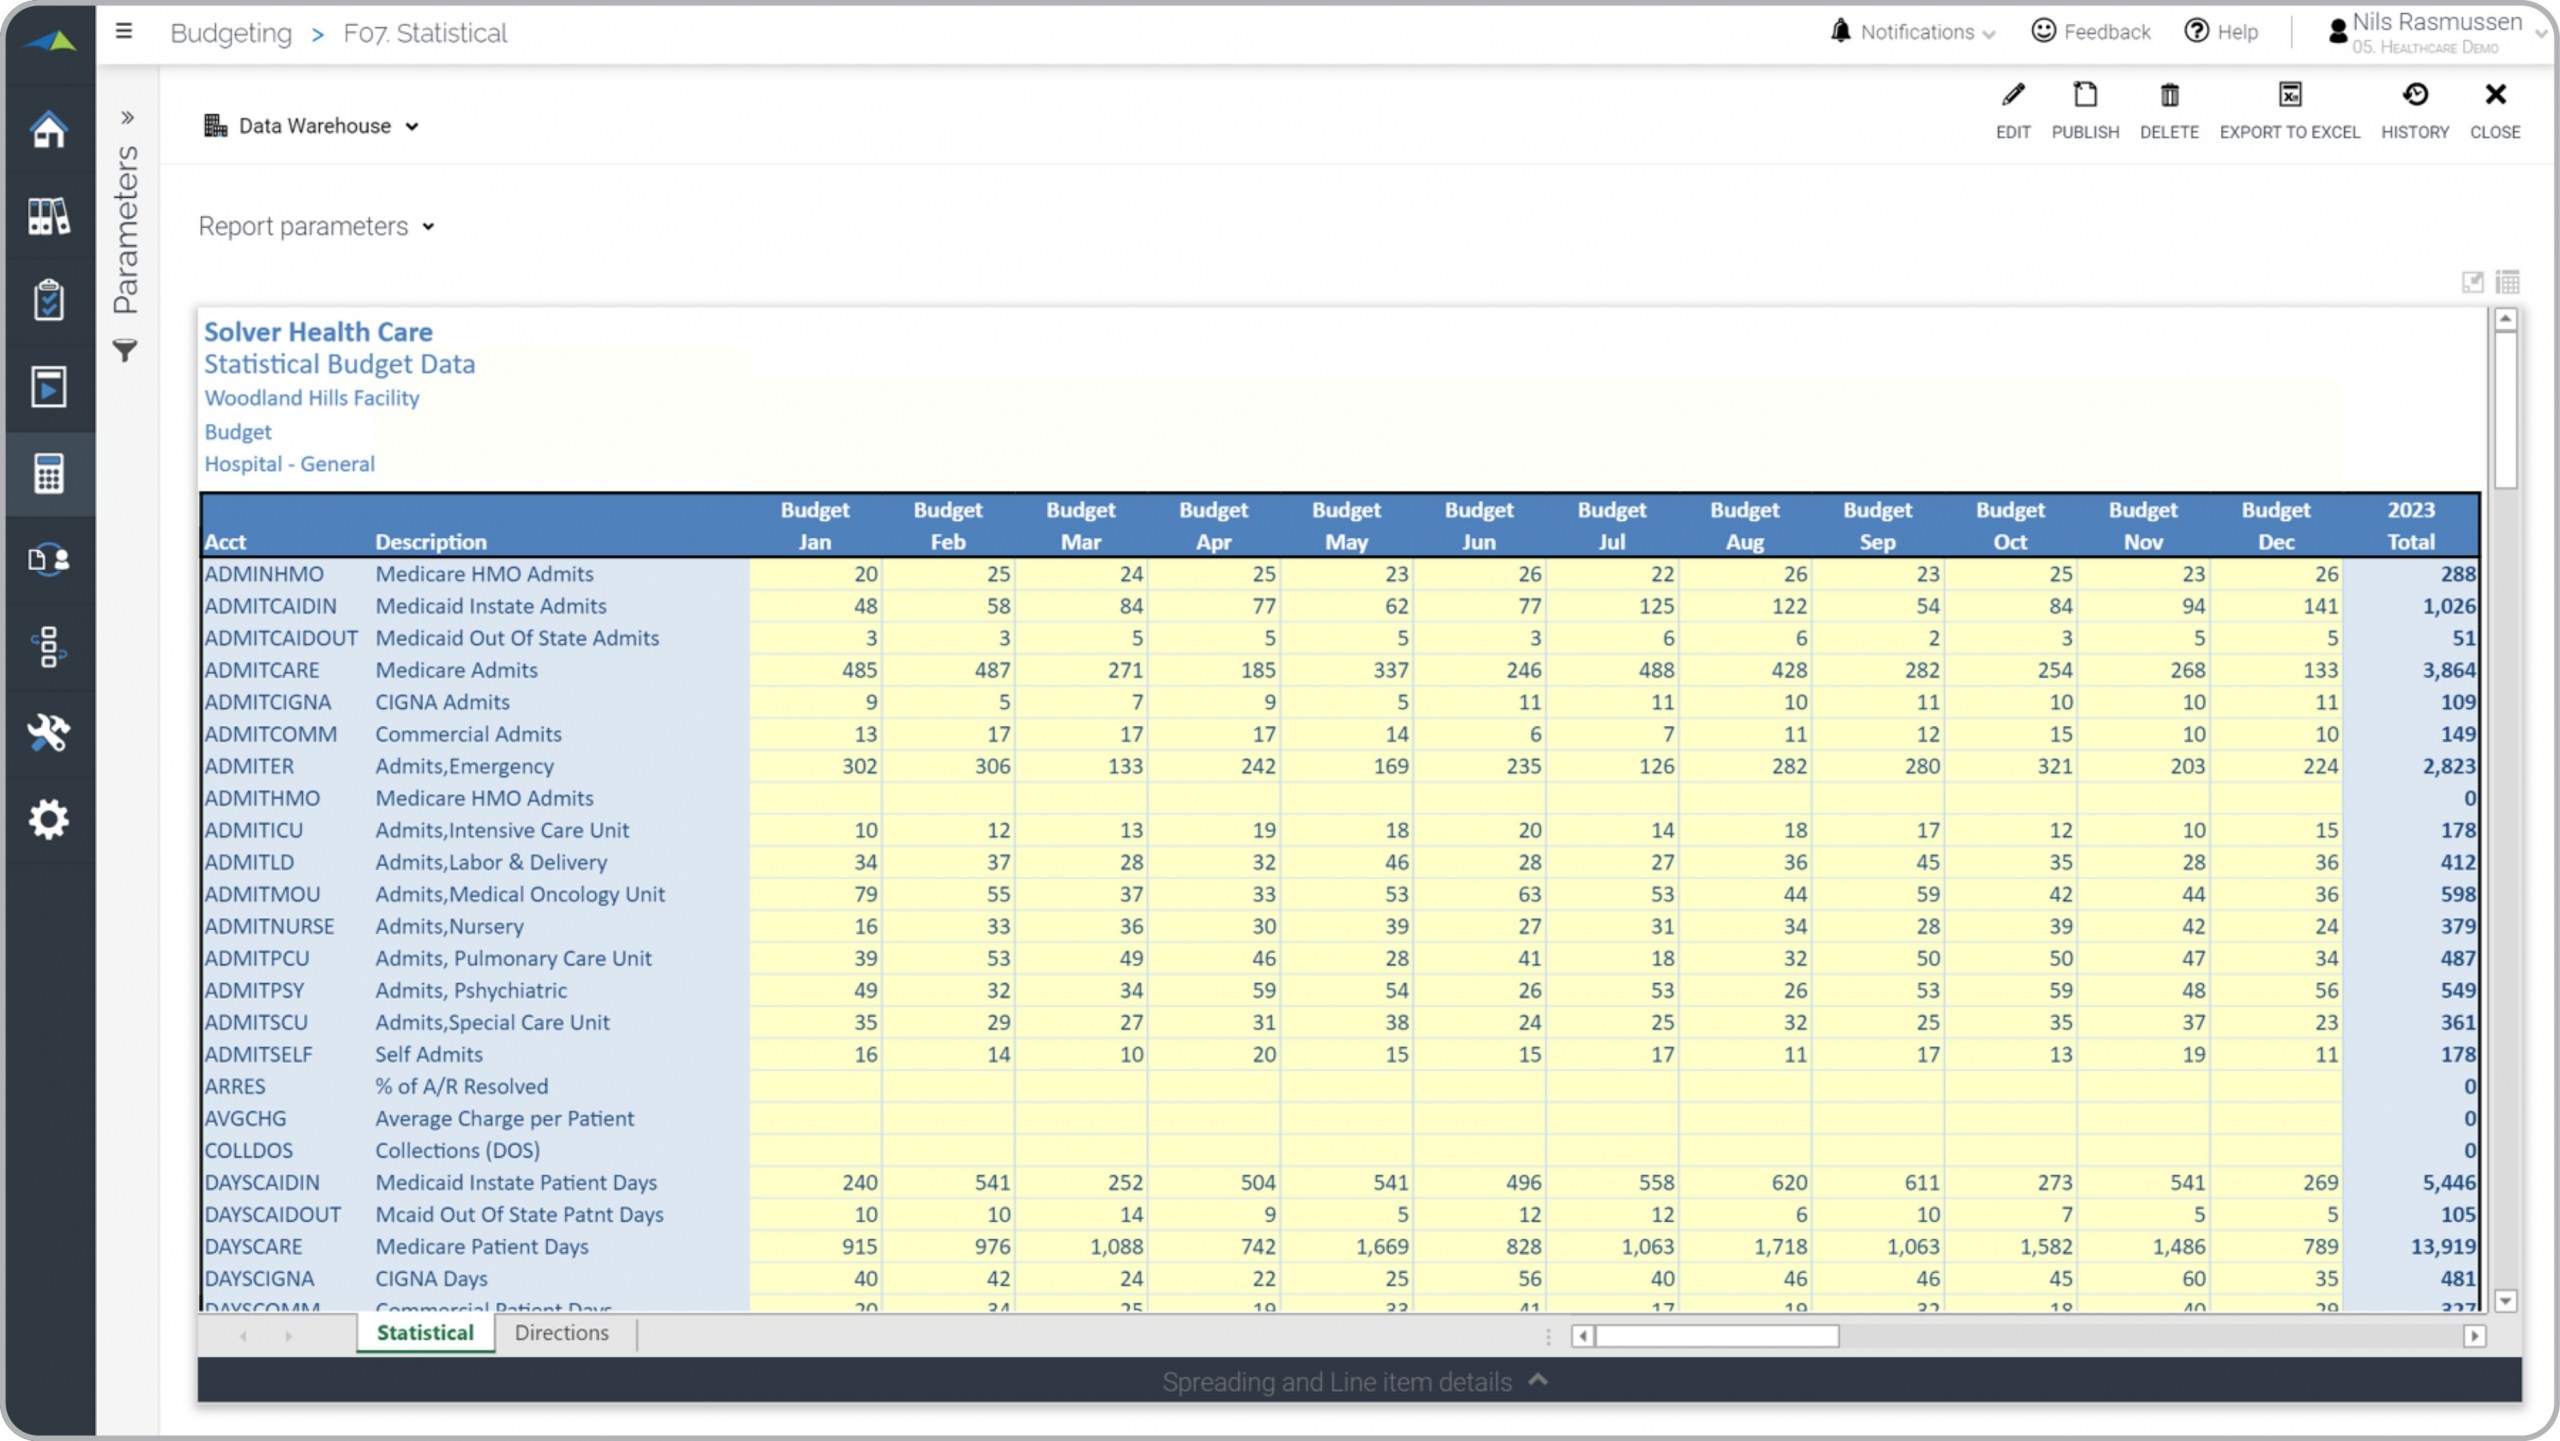
Statistical Budget Model for Healthcare Providers
What is a Statistical Budget Model for a Healthcare Provider ? Statistical budgets are considered ...
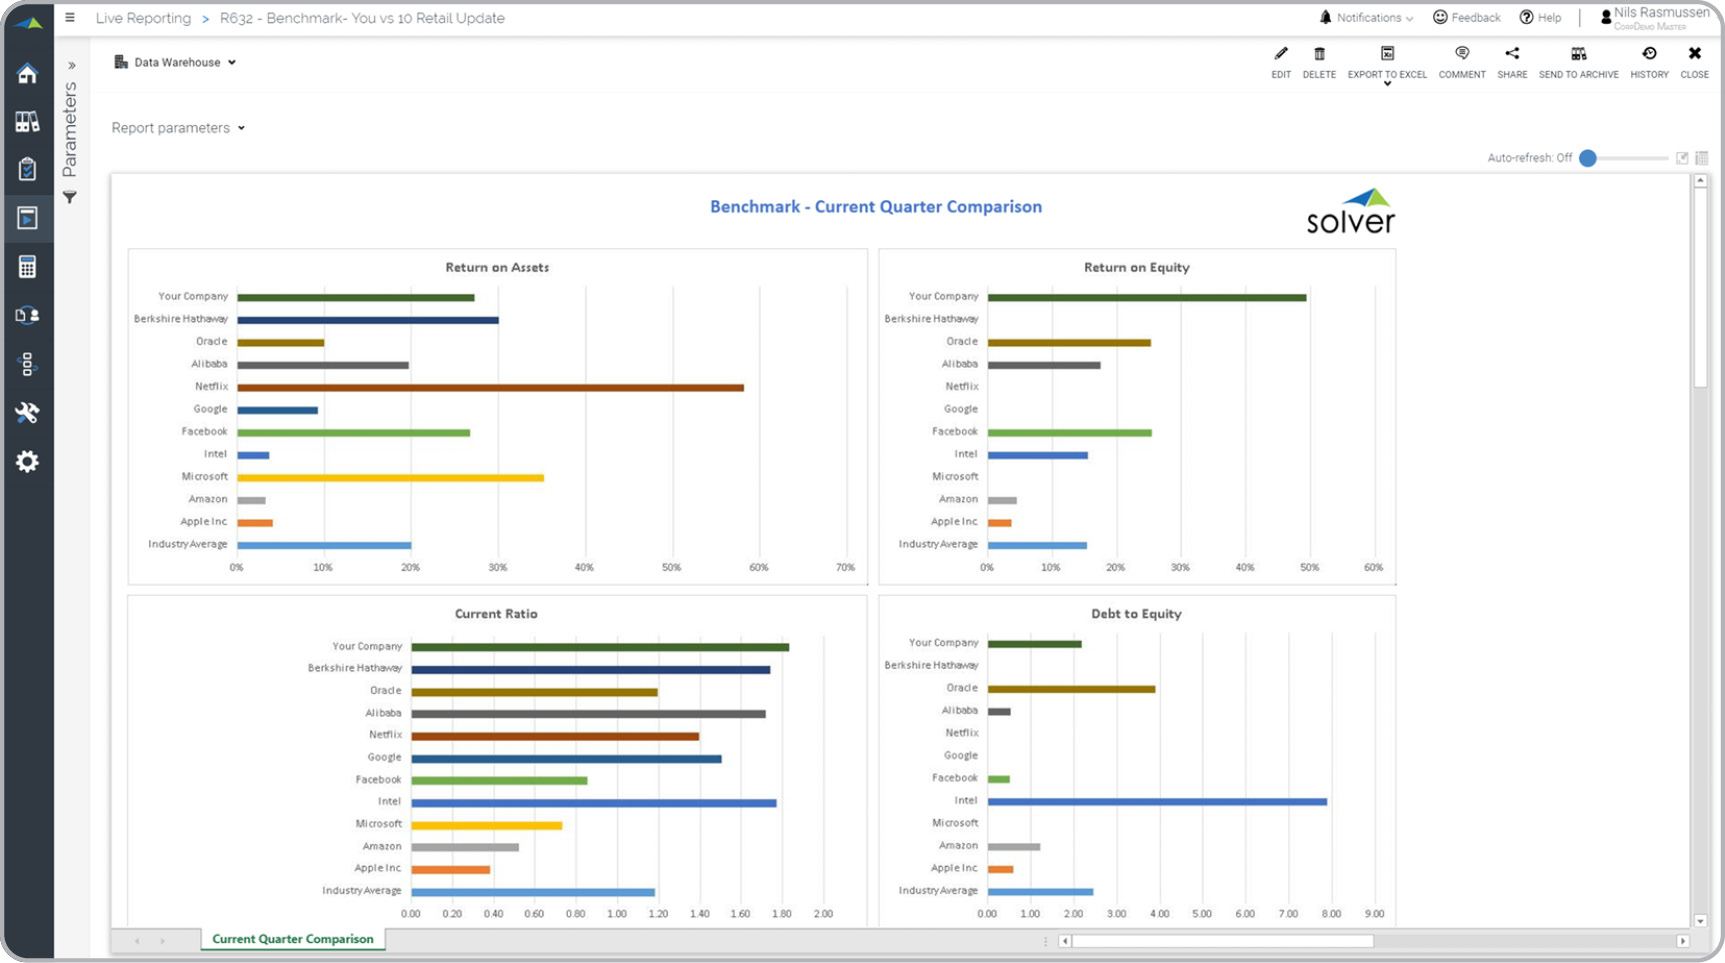
Benchmarking Your Own Company versus an Industry Average
What is a Report that Benchmarks Your Business versus an Industry Average ? Industry benchmarking ...
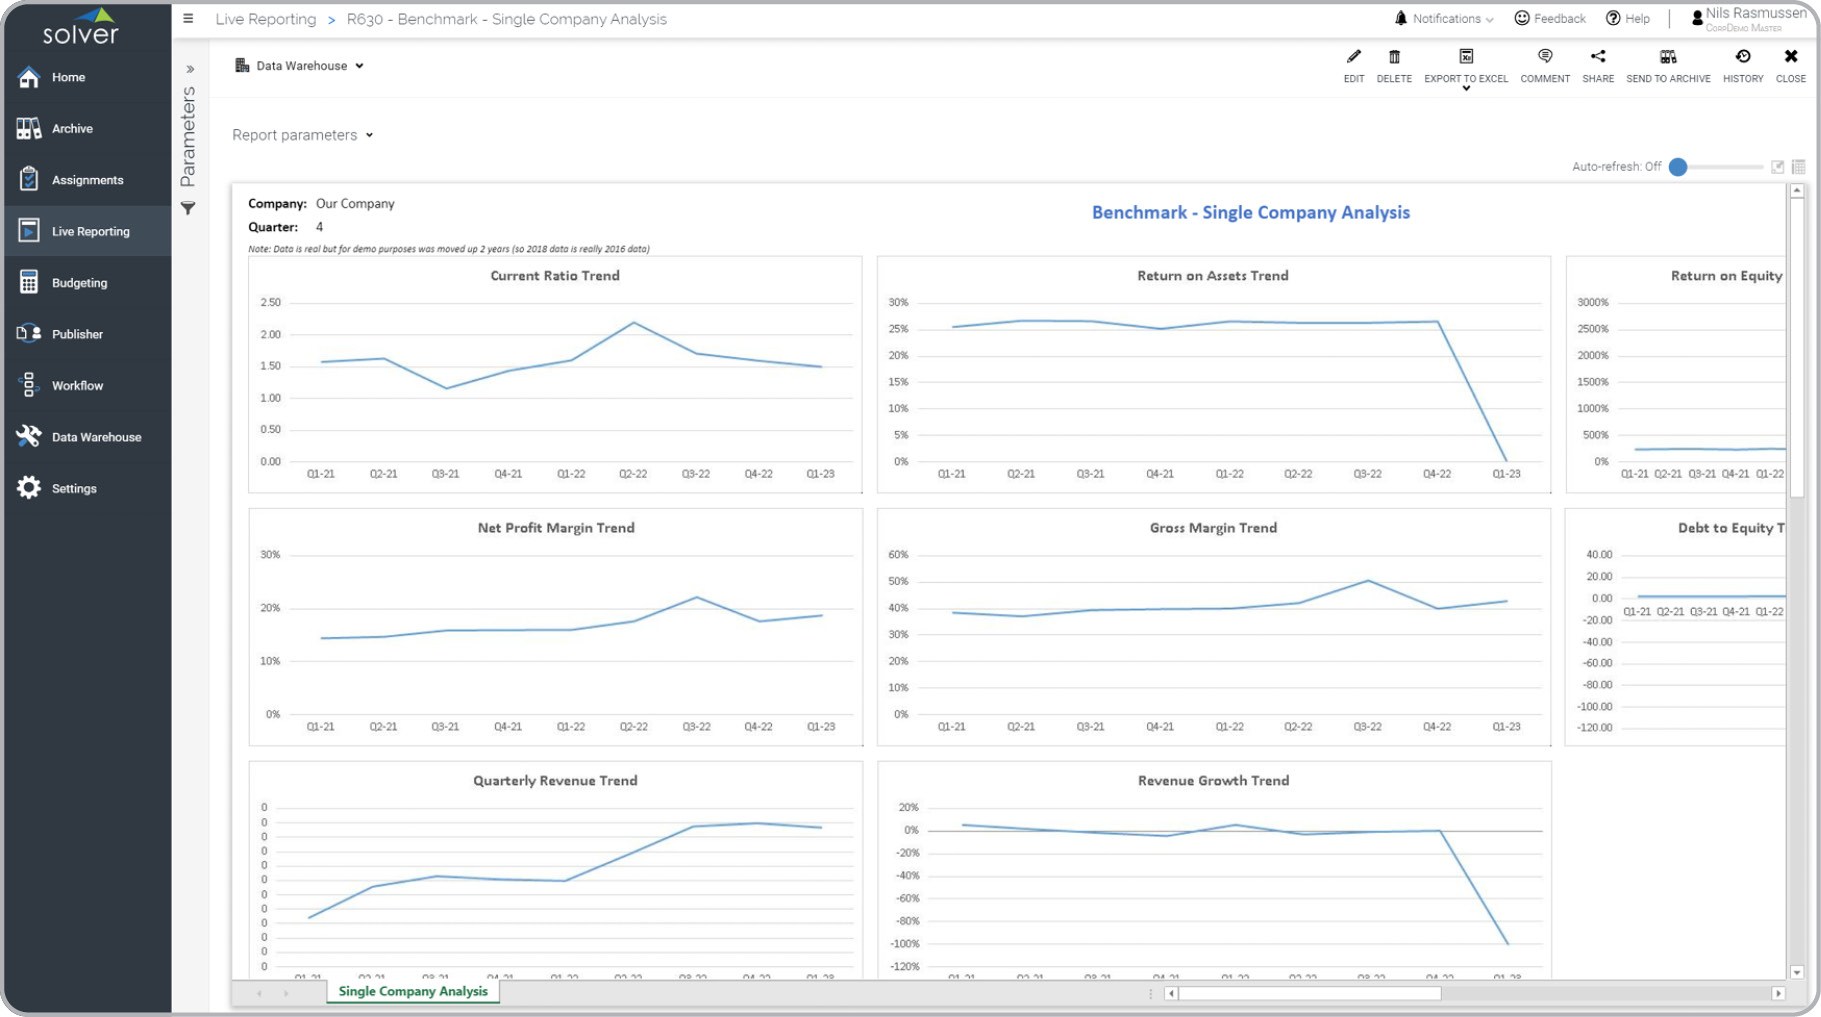
Competitor Benchmark Analysis Report
What is a Competitor Benchmark Analysis Report ? Competitor benchmark reports are considered ...
Competitor Trend Analysis Report
What is a Competitor Trend Analysis Report? Competitor analysis reports are considered benchmarking ...
Return on Investment Report for a Corporate Web-site
What is a Return on Investment (ROI) Report for a Web-site and Related Marketing? Website ...
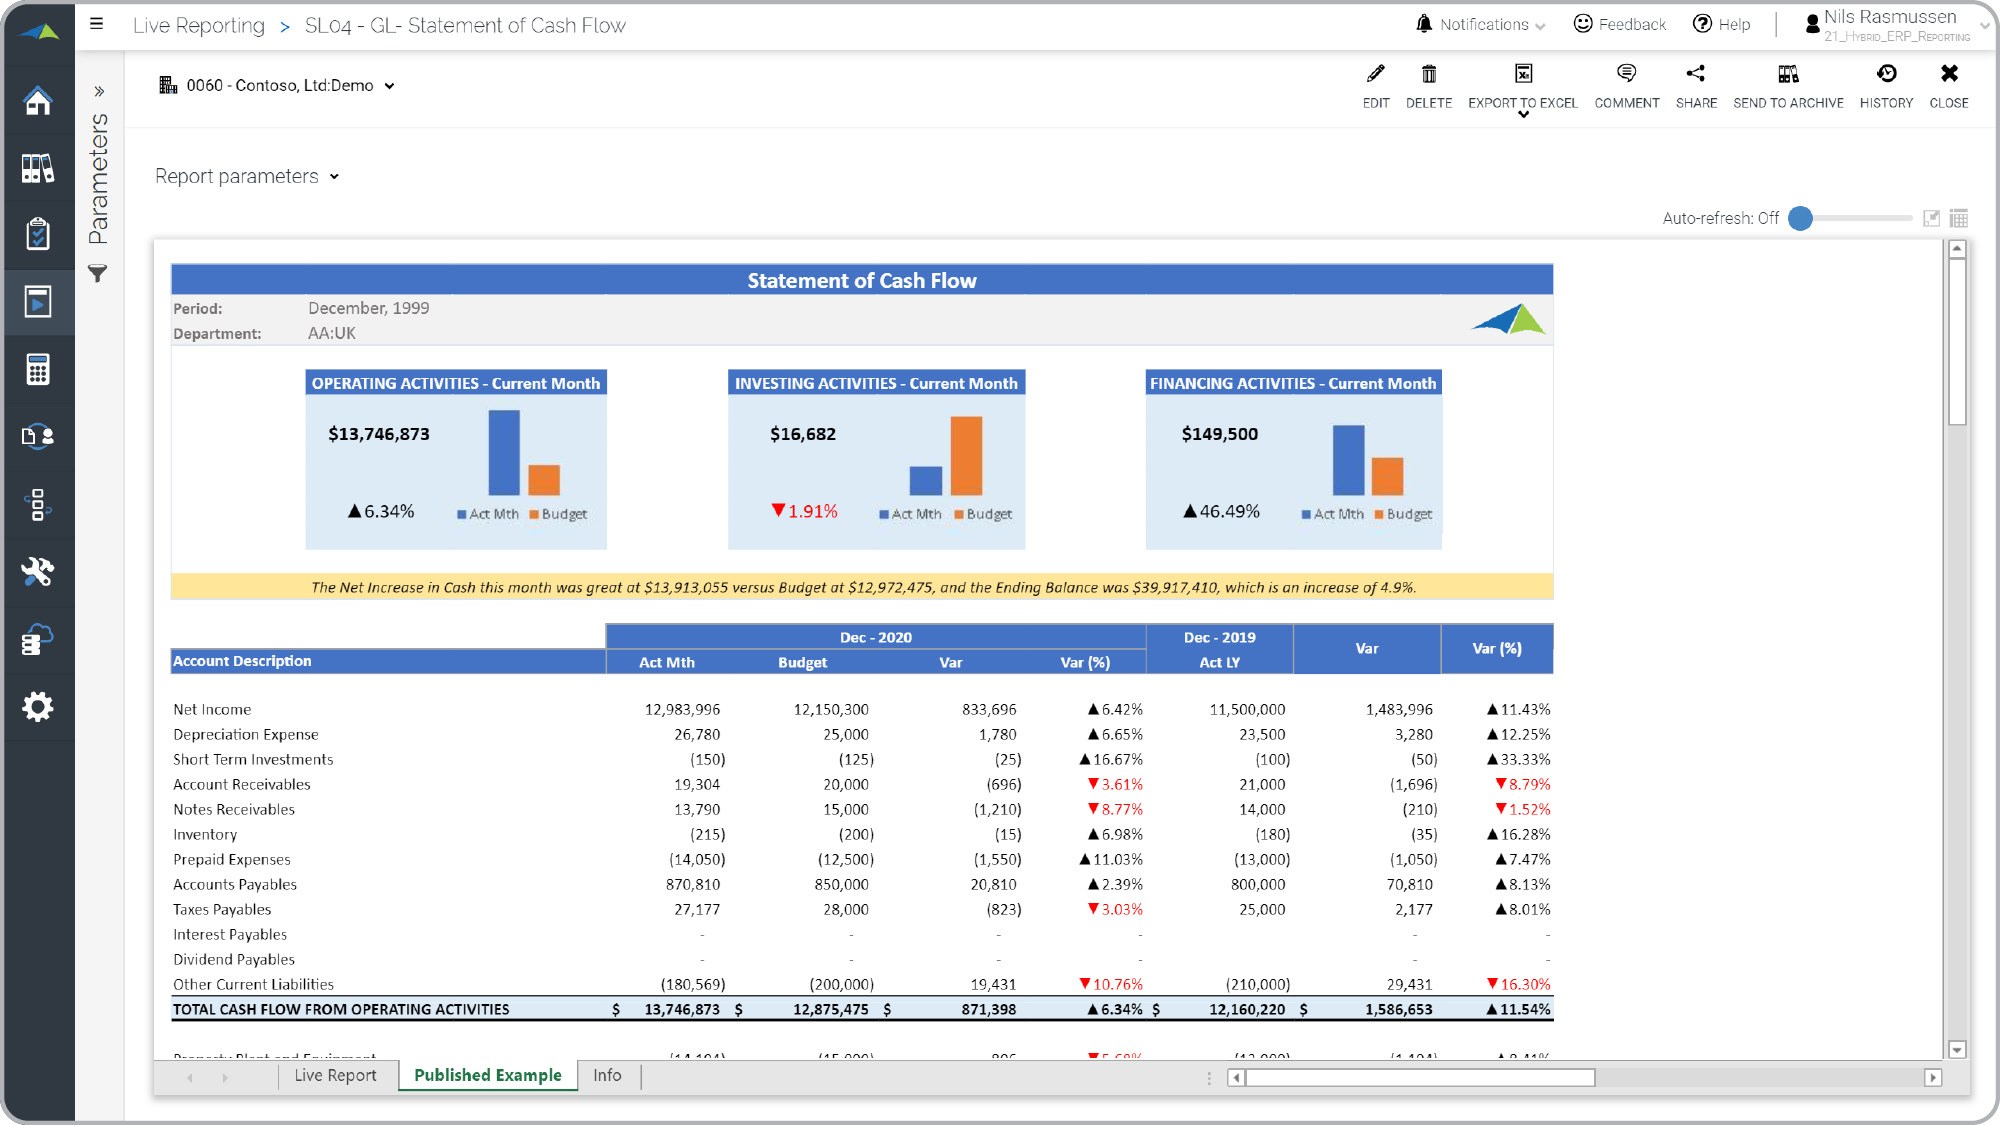
Cash Flow Variance Report with KPI Analysis
What is a Cash Flow Report with KPI Analysis ? Cash Flow variance reports are considered essential ...
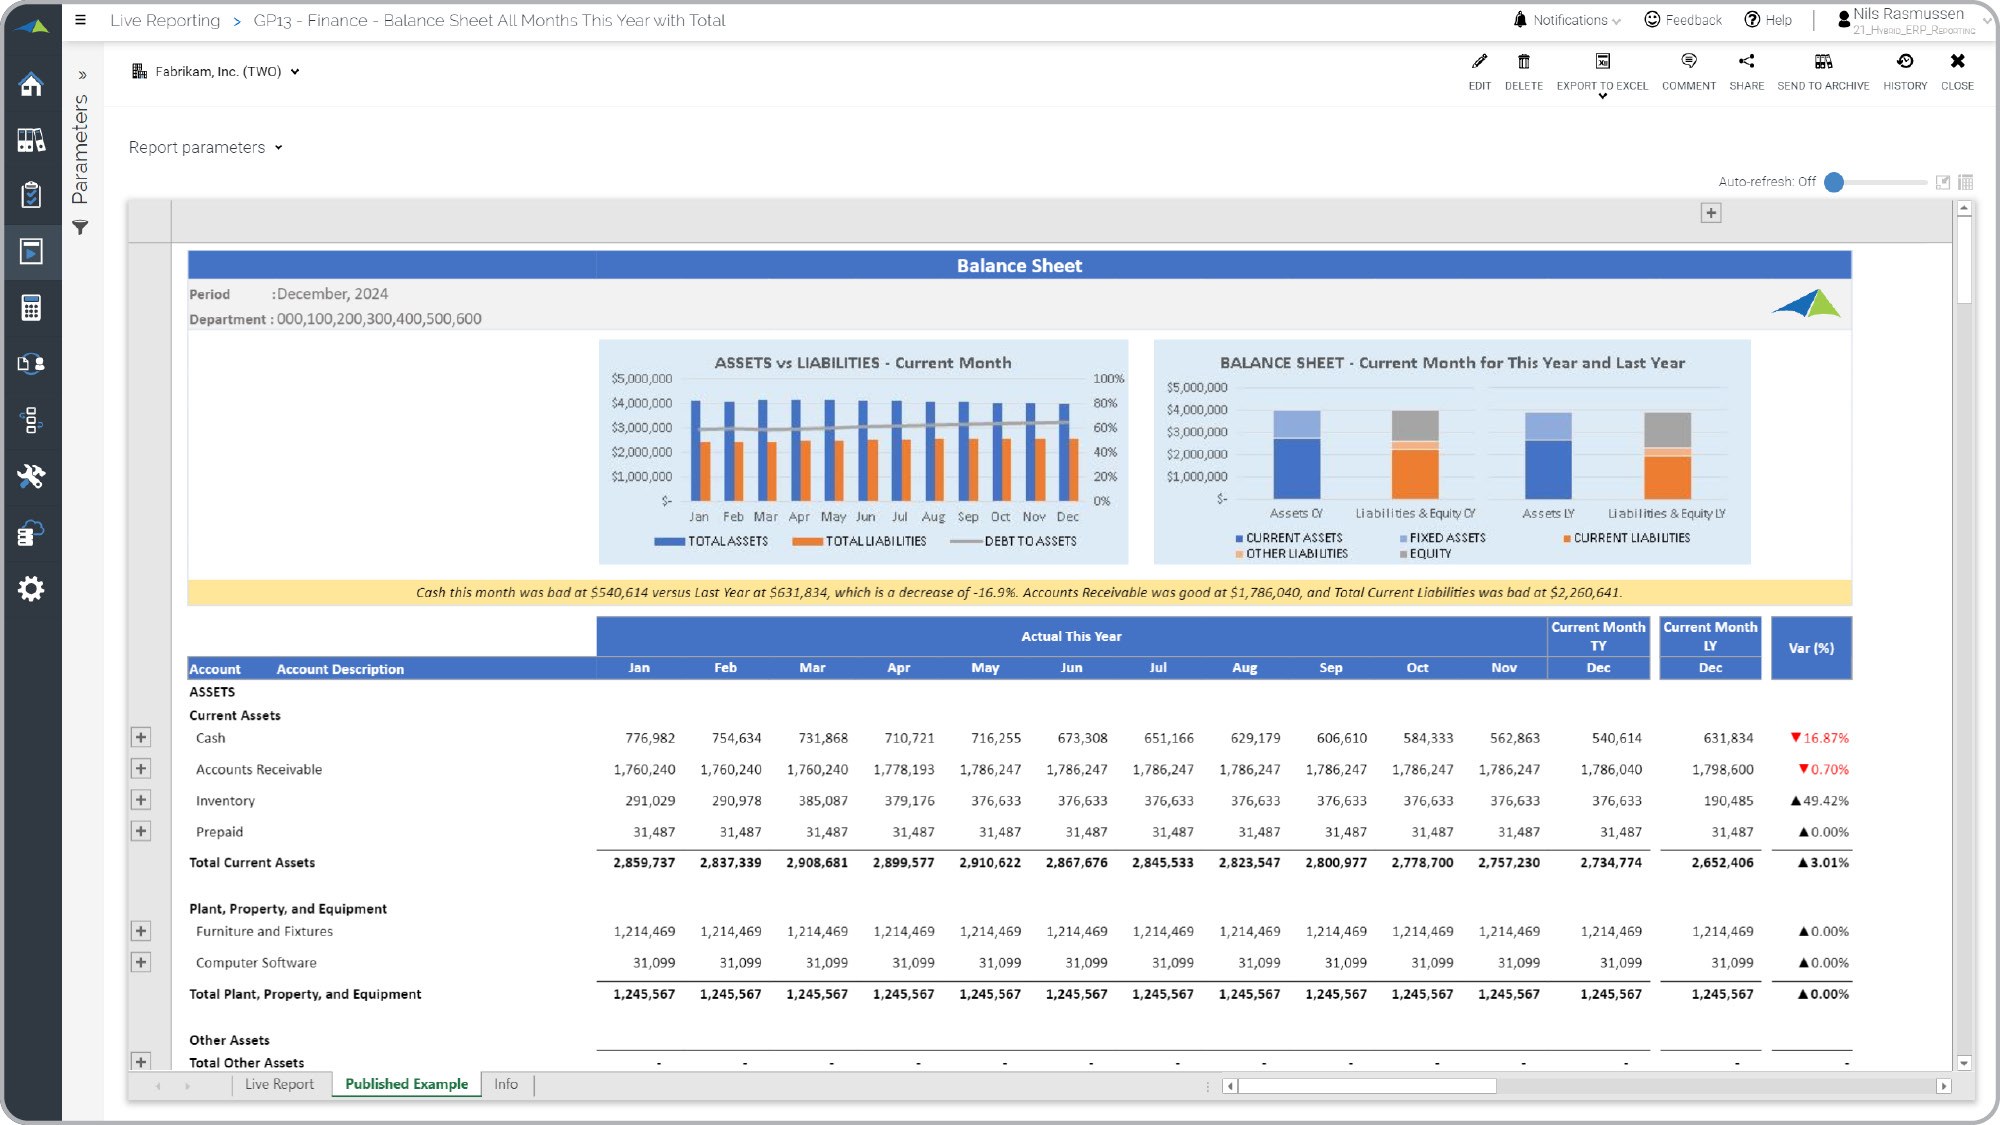
Trended Balance Sheet with KPIs
What is a Trended Balance Sheet with KPIs ? Trended Balance Sheet reports are considered month end ...
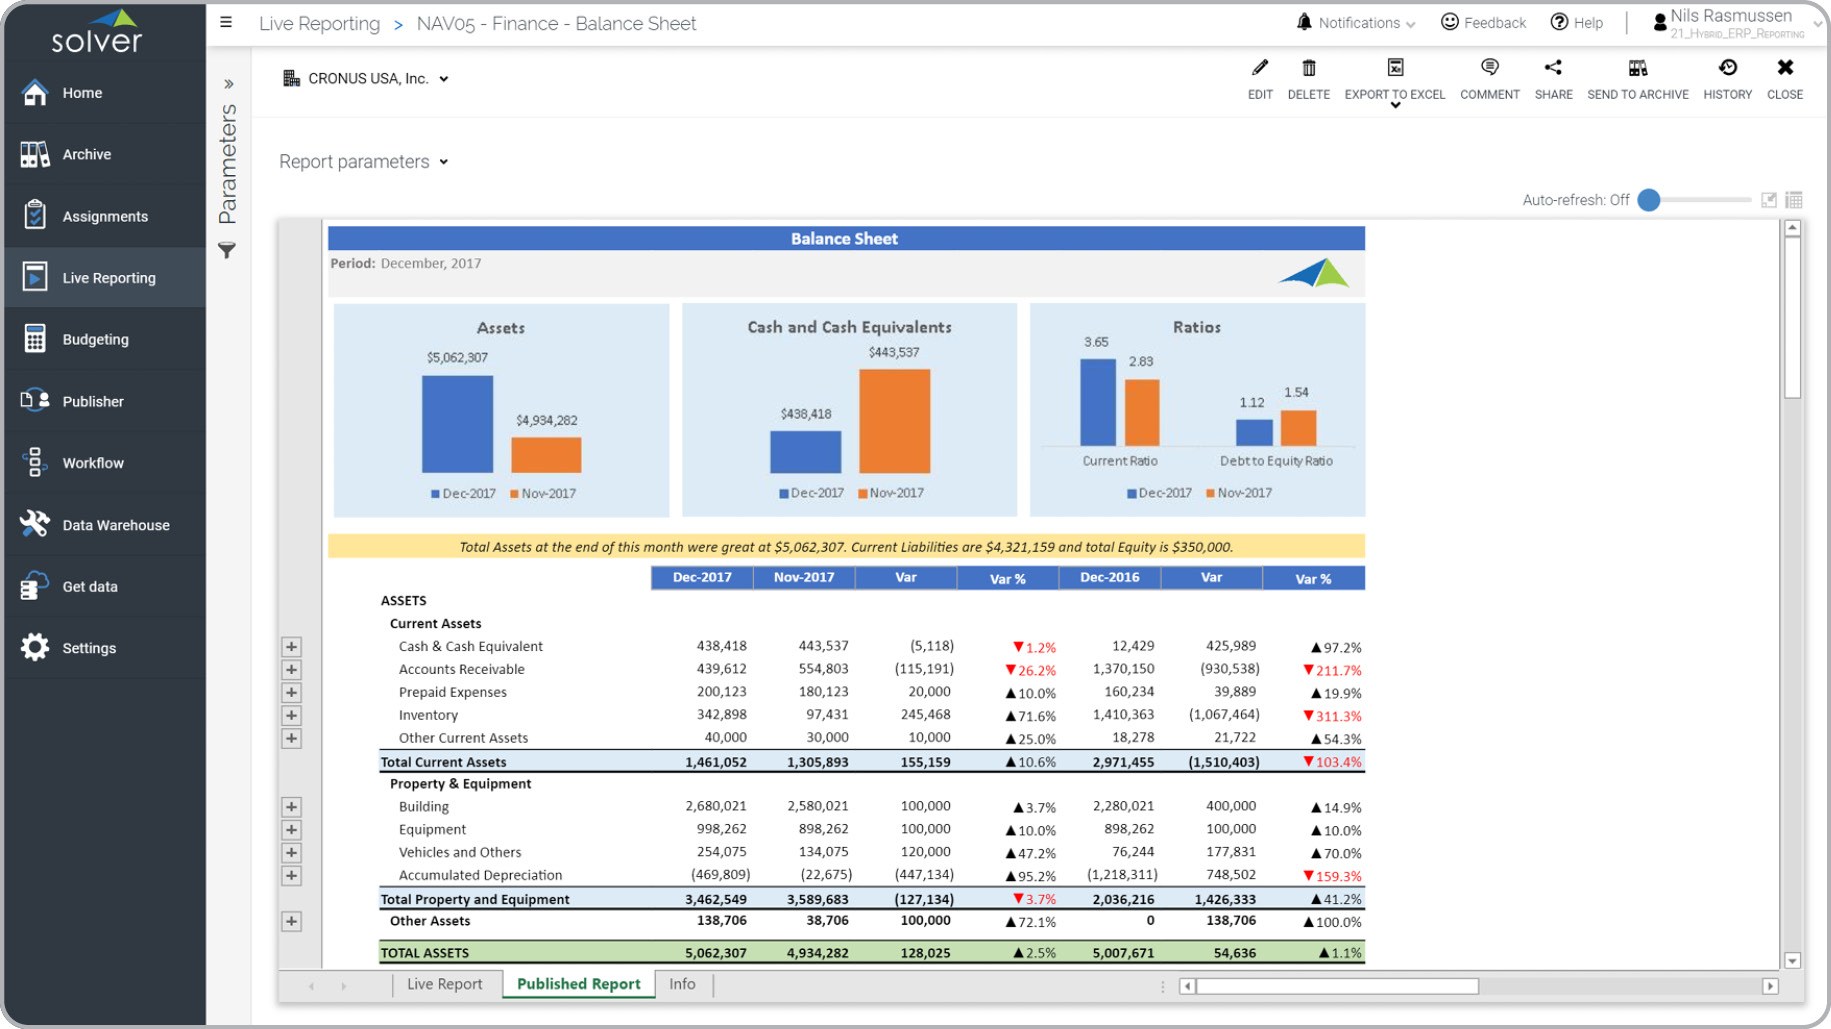
Modern Balance Sheet Variance Report with KPIs
What is a Modern Balance Sheet Variance Report with KPIs ? Balance Sheet variance reports are ...
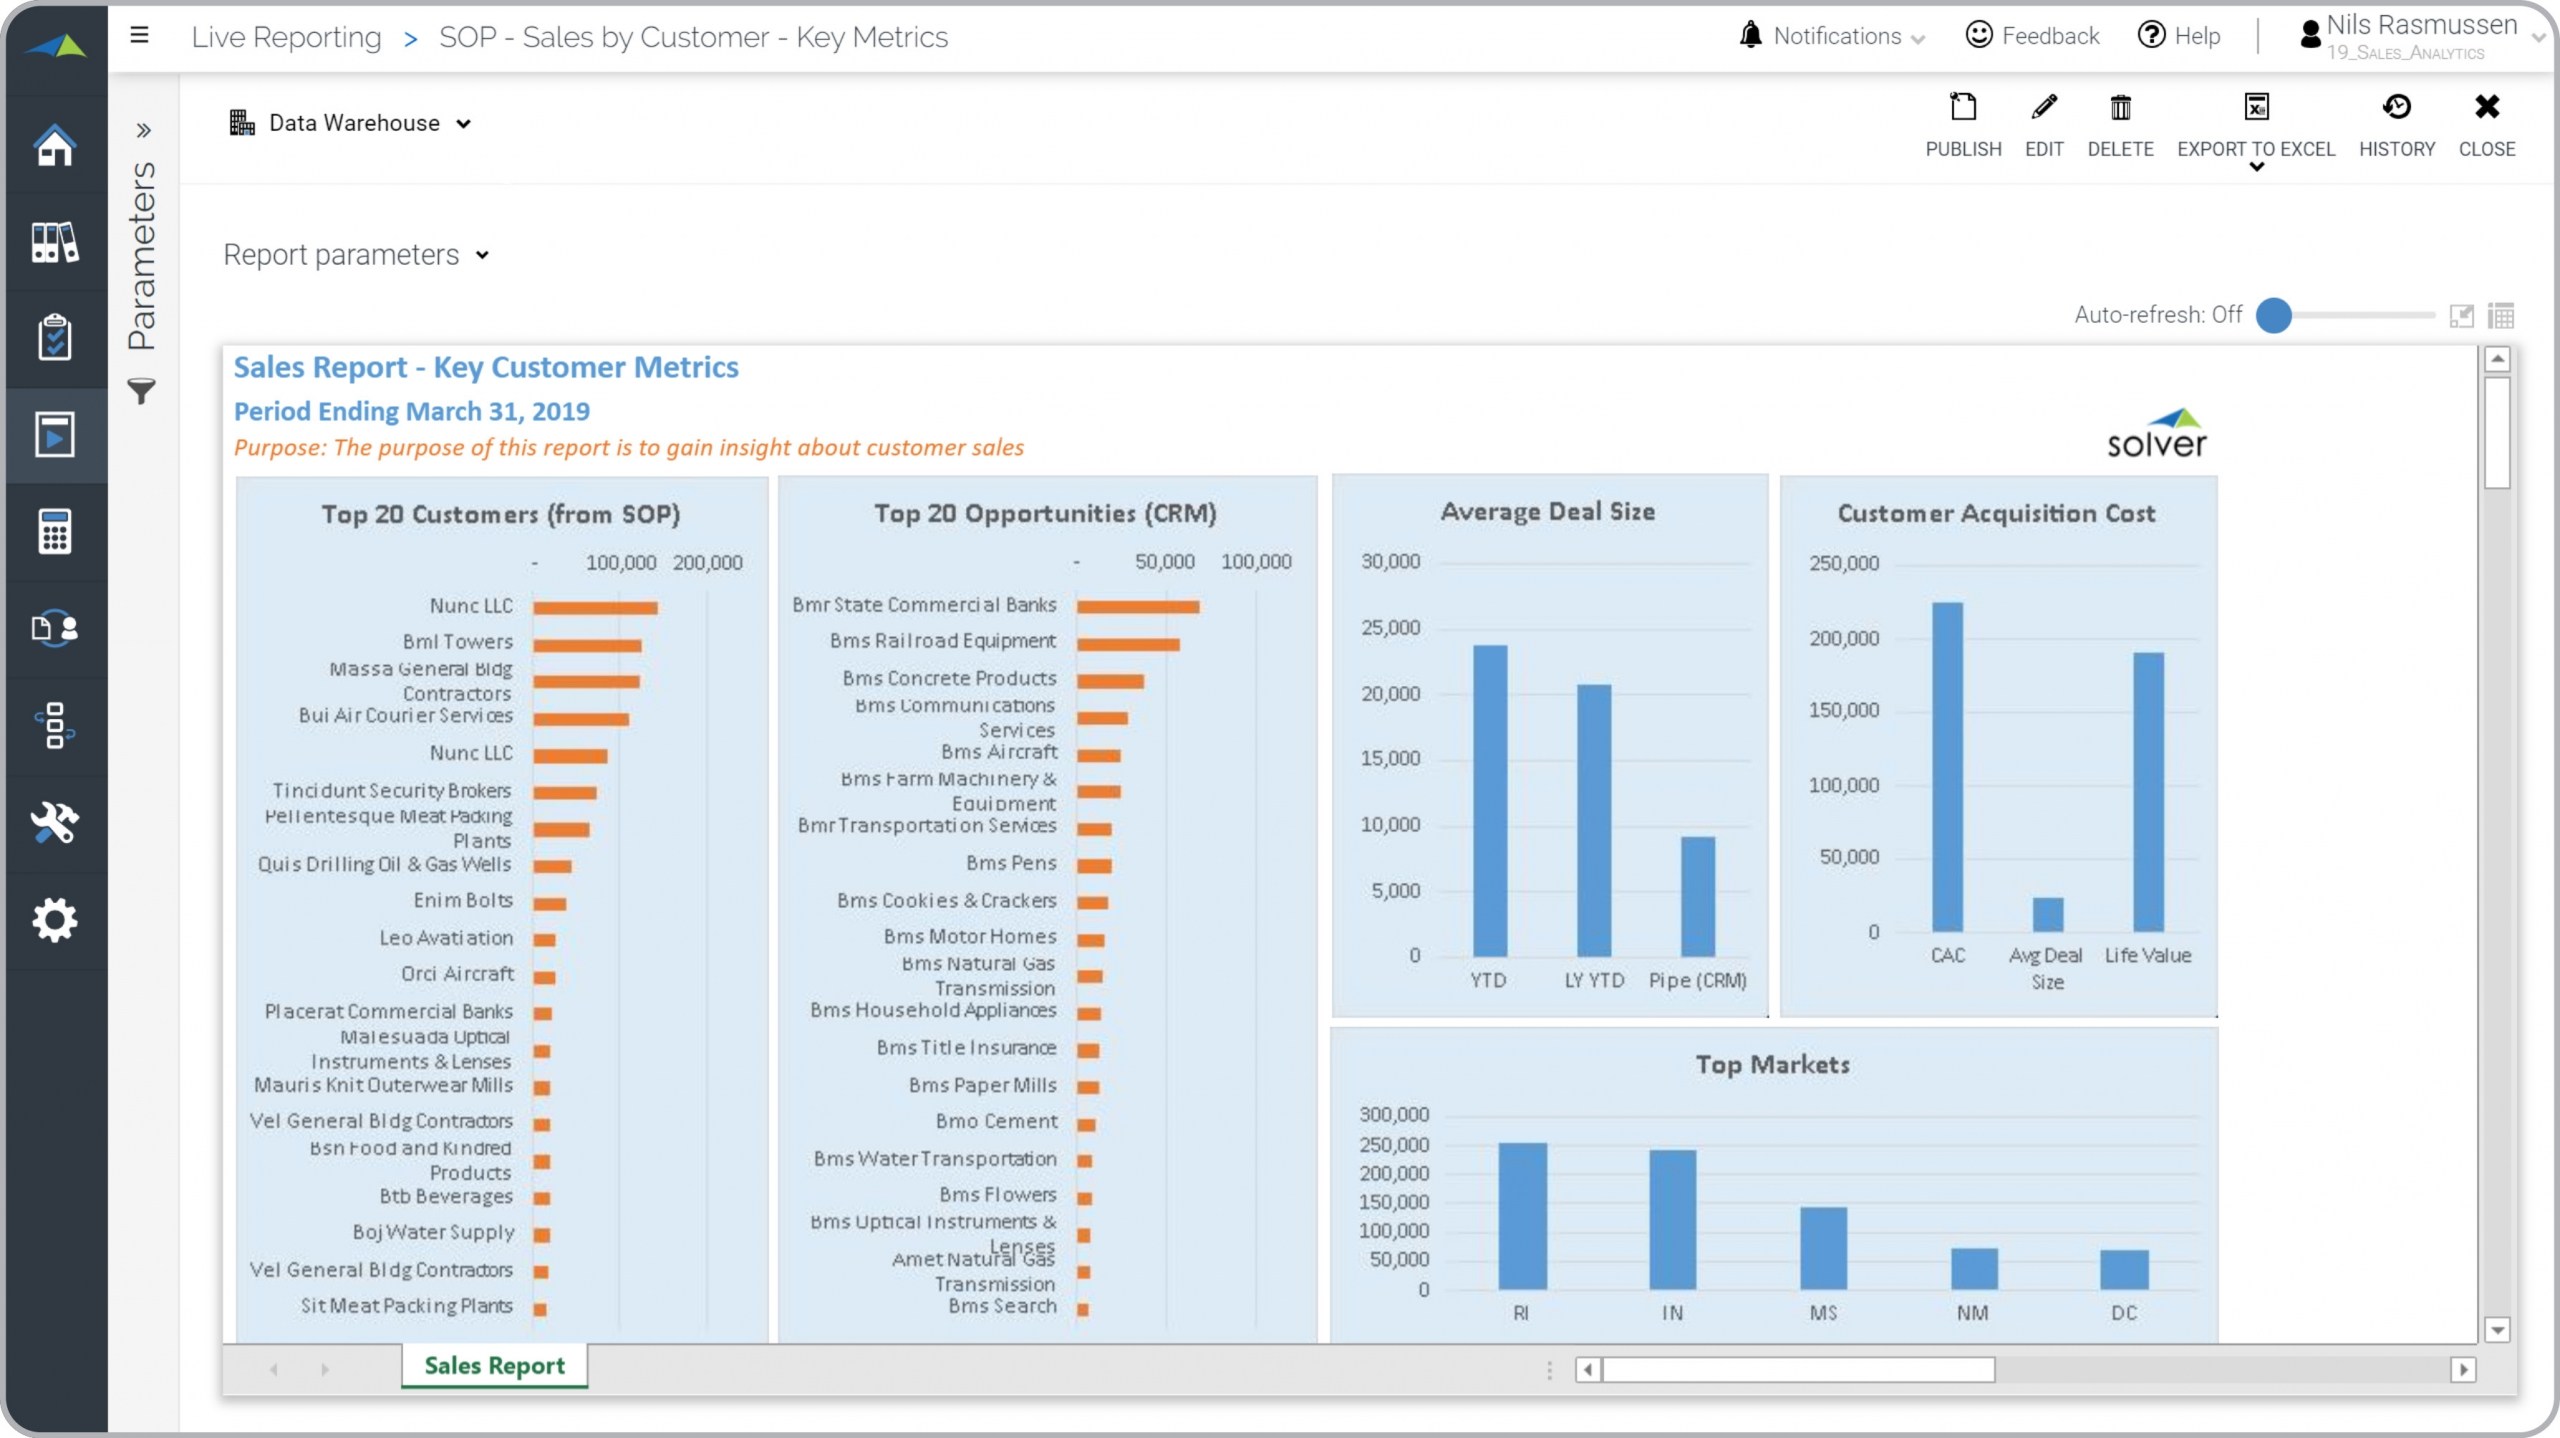
Sales and Opportunity Report with Customer Metrics
What is a Sales and Opportunity Report with Customer Metrics ? Graphical reports that combine CRM ...
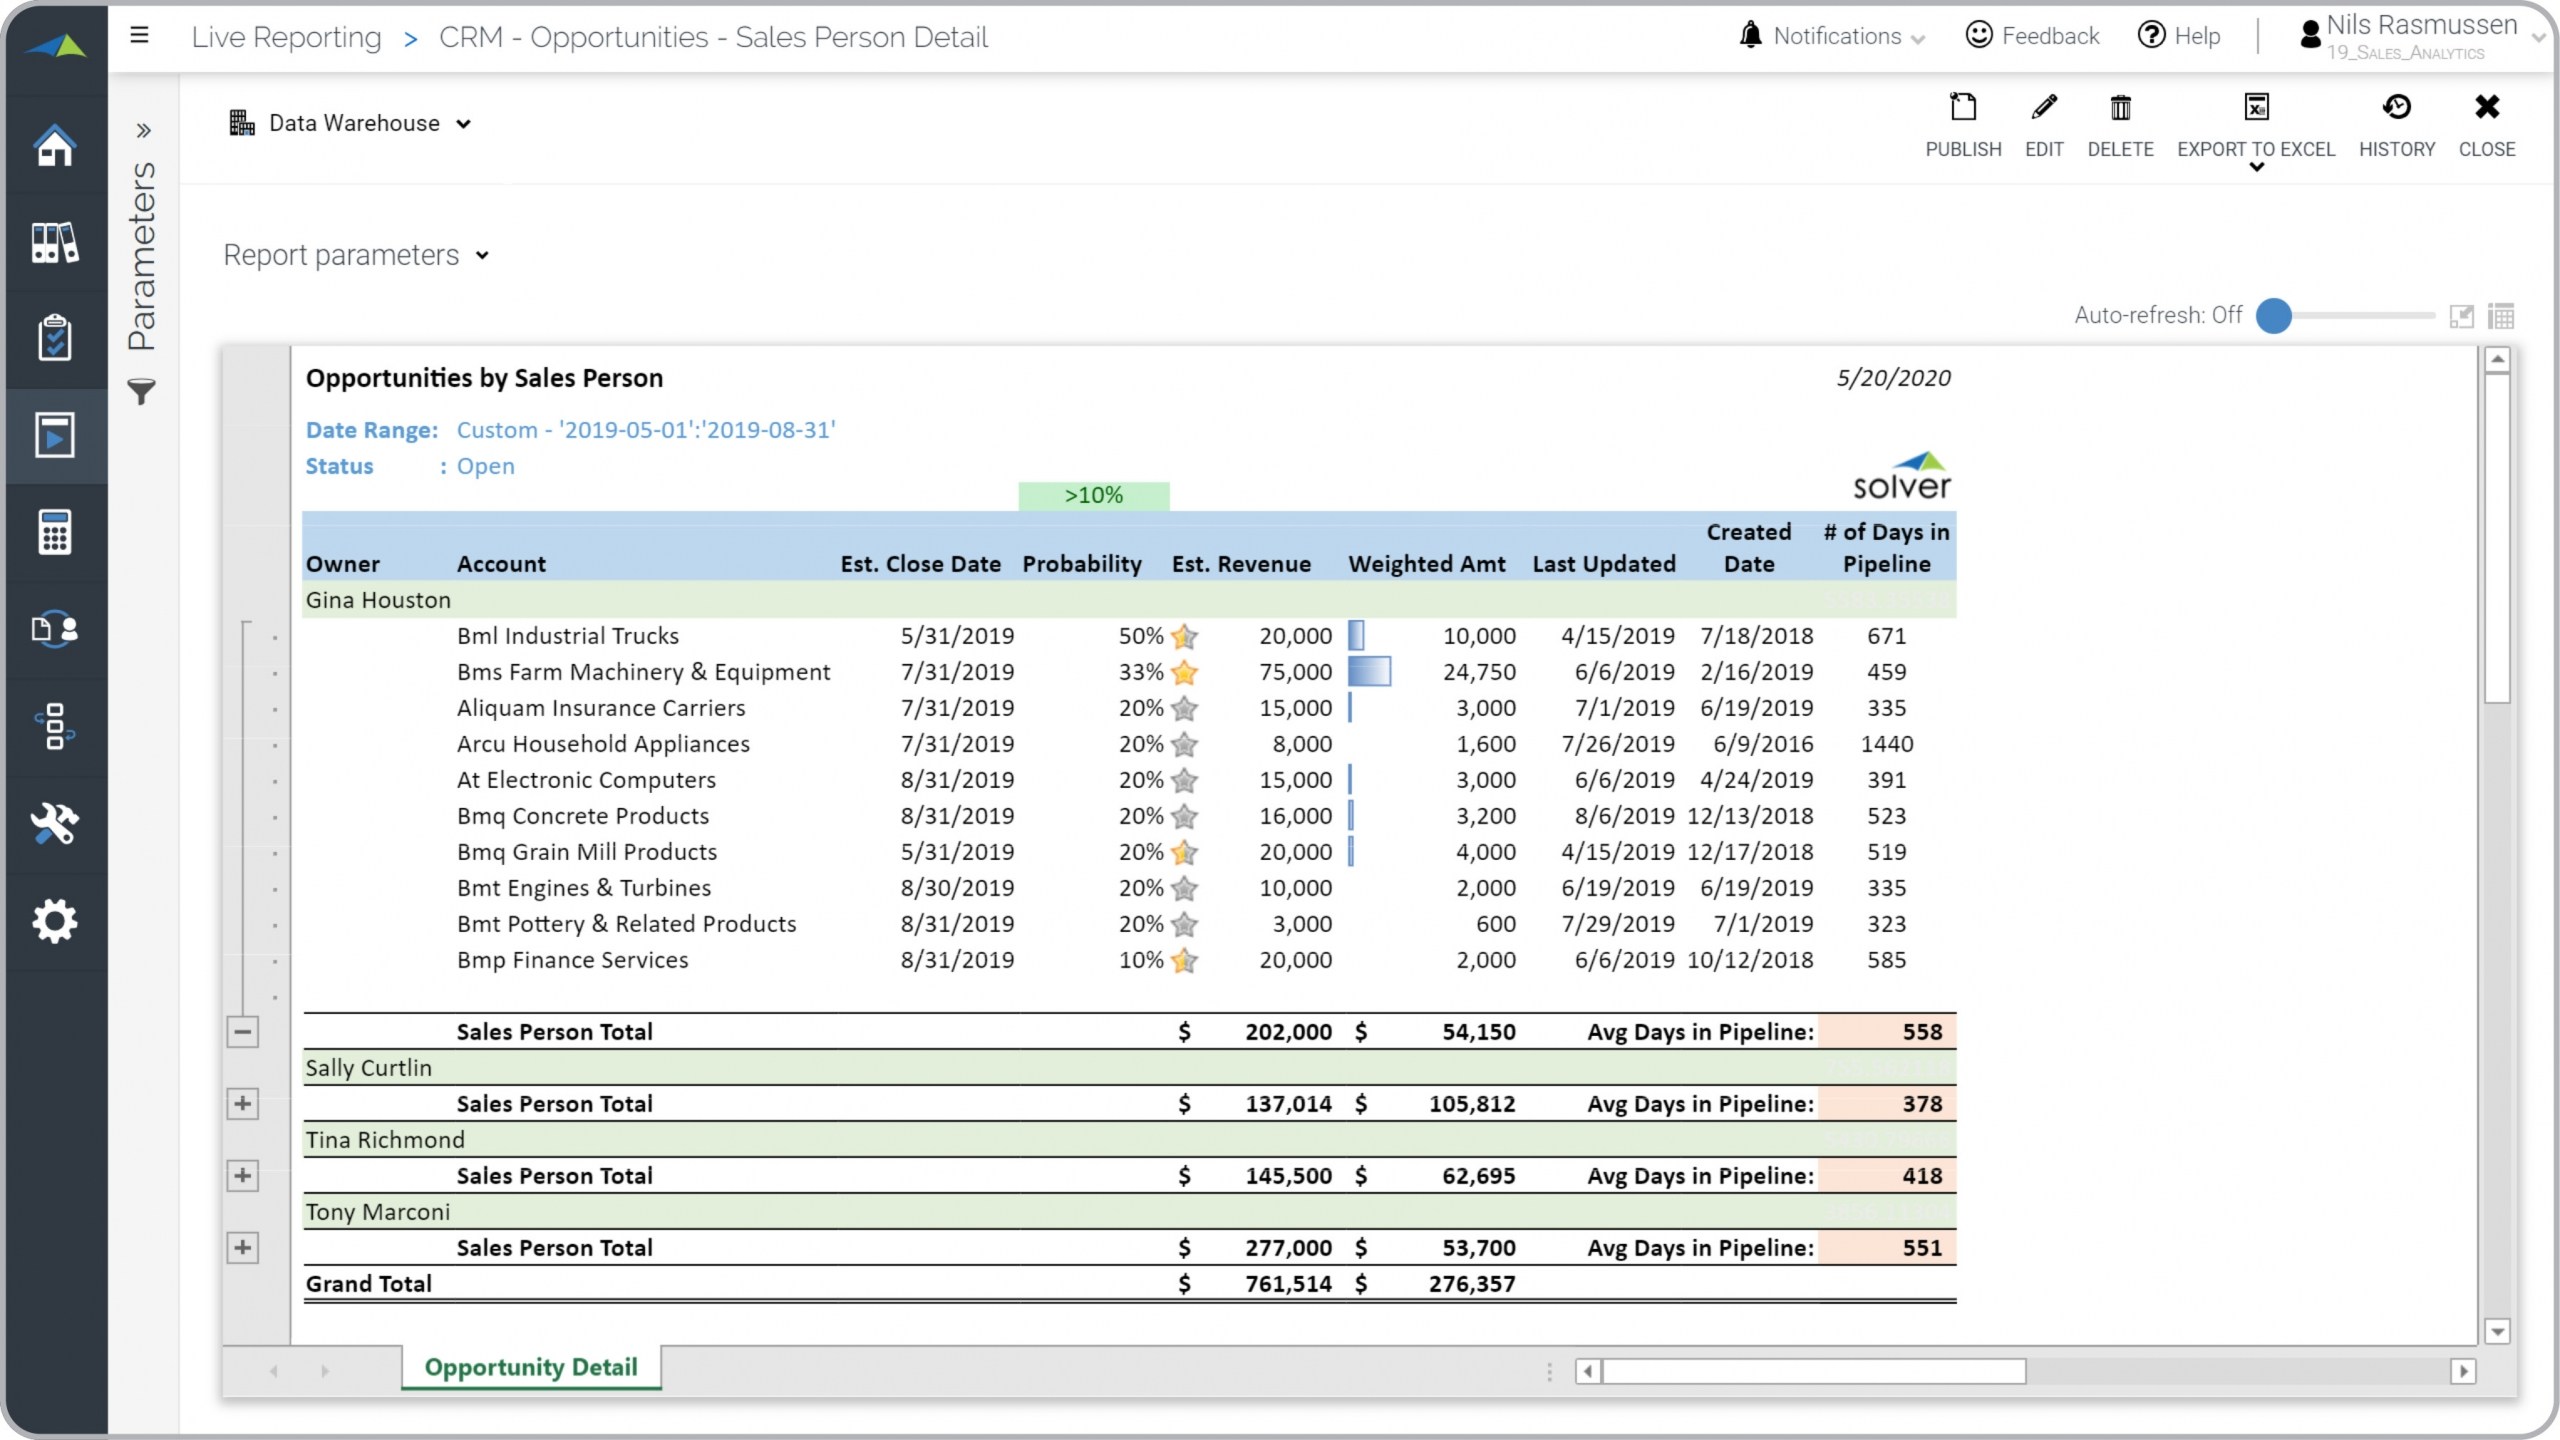
Opportunity Analysis by Sales Person Report Example
What is a Opportunity Analysis by Sales Person Report ? Opportunity by Sales Person reports are ...
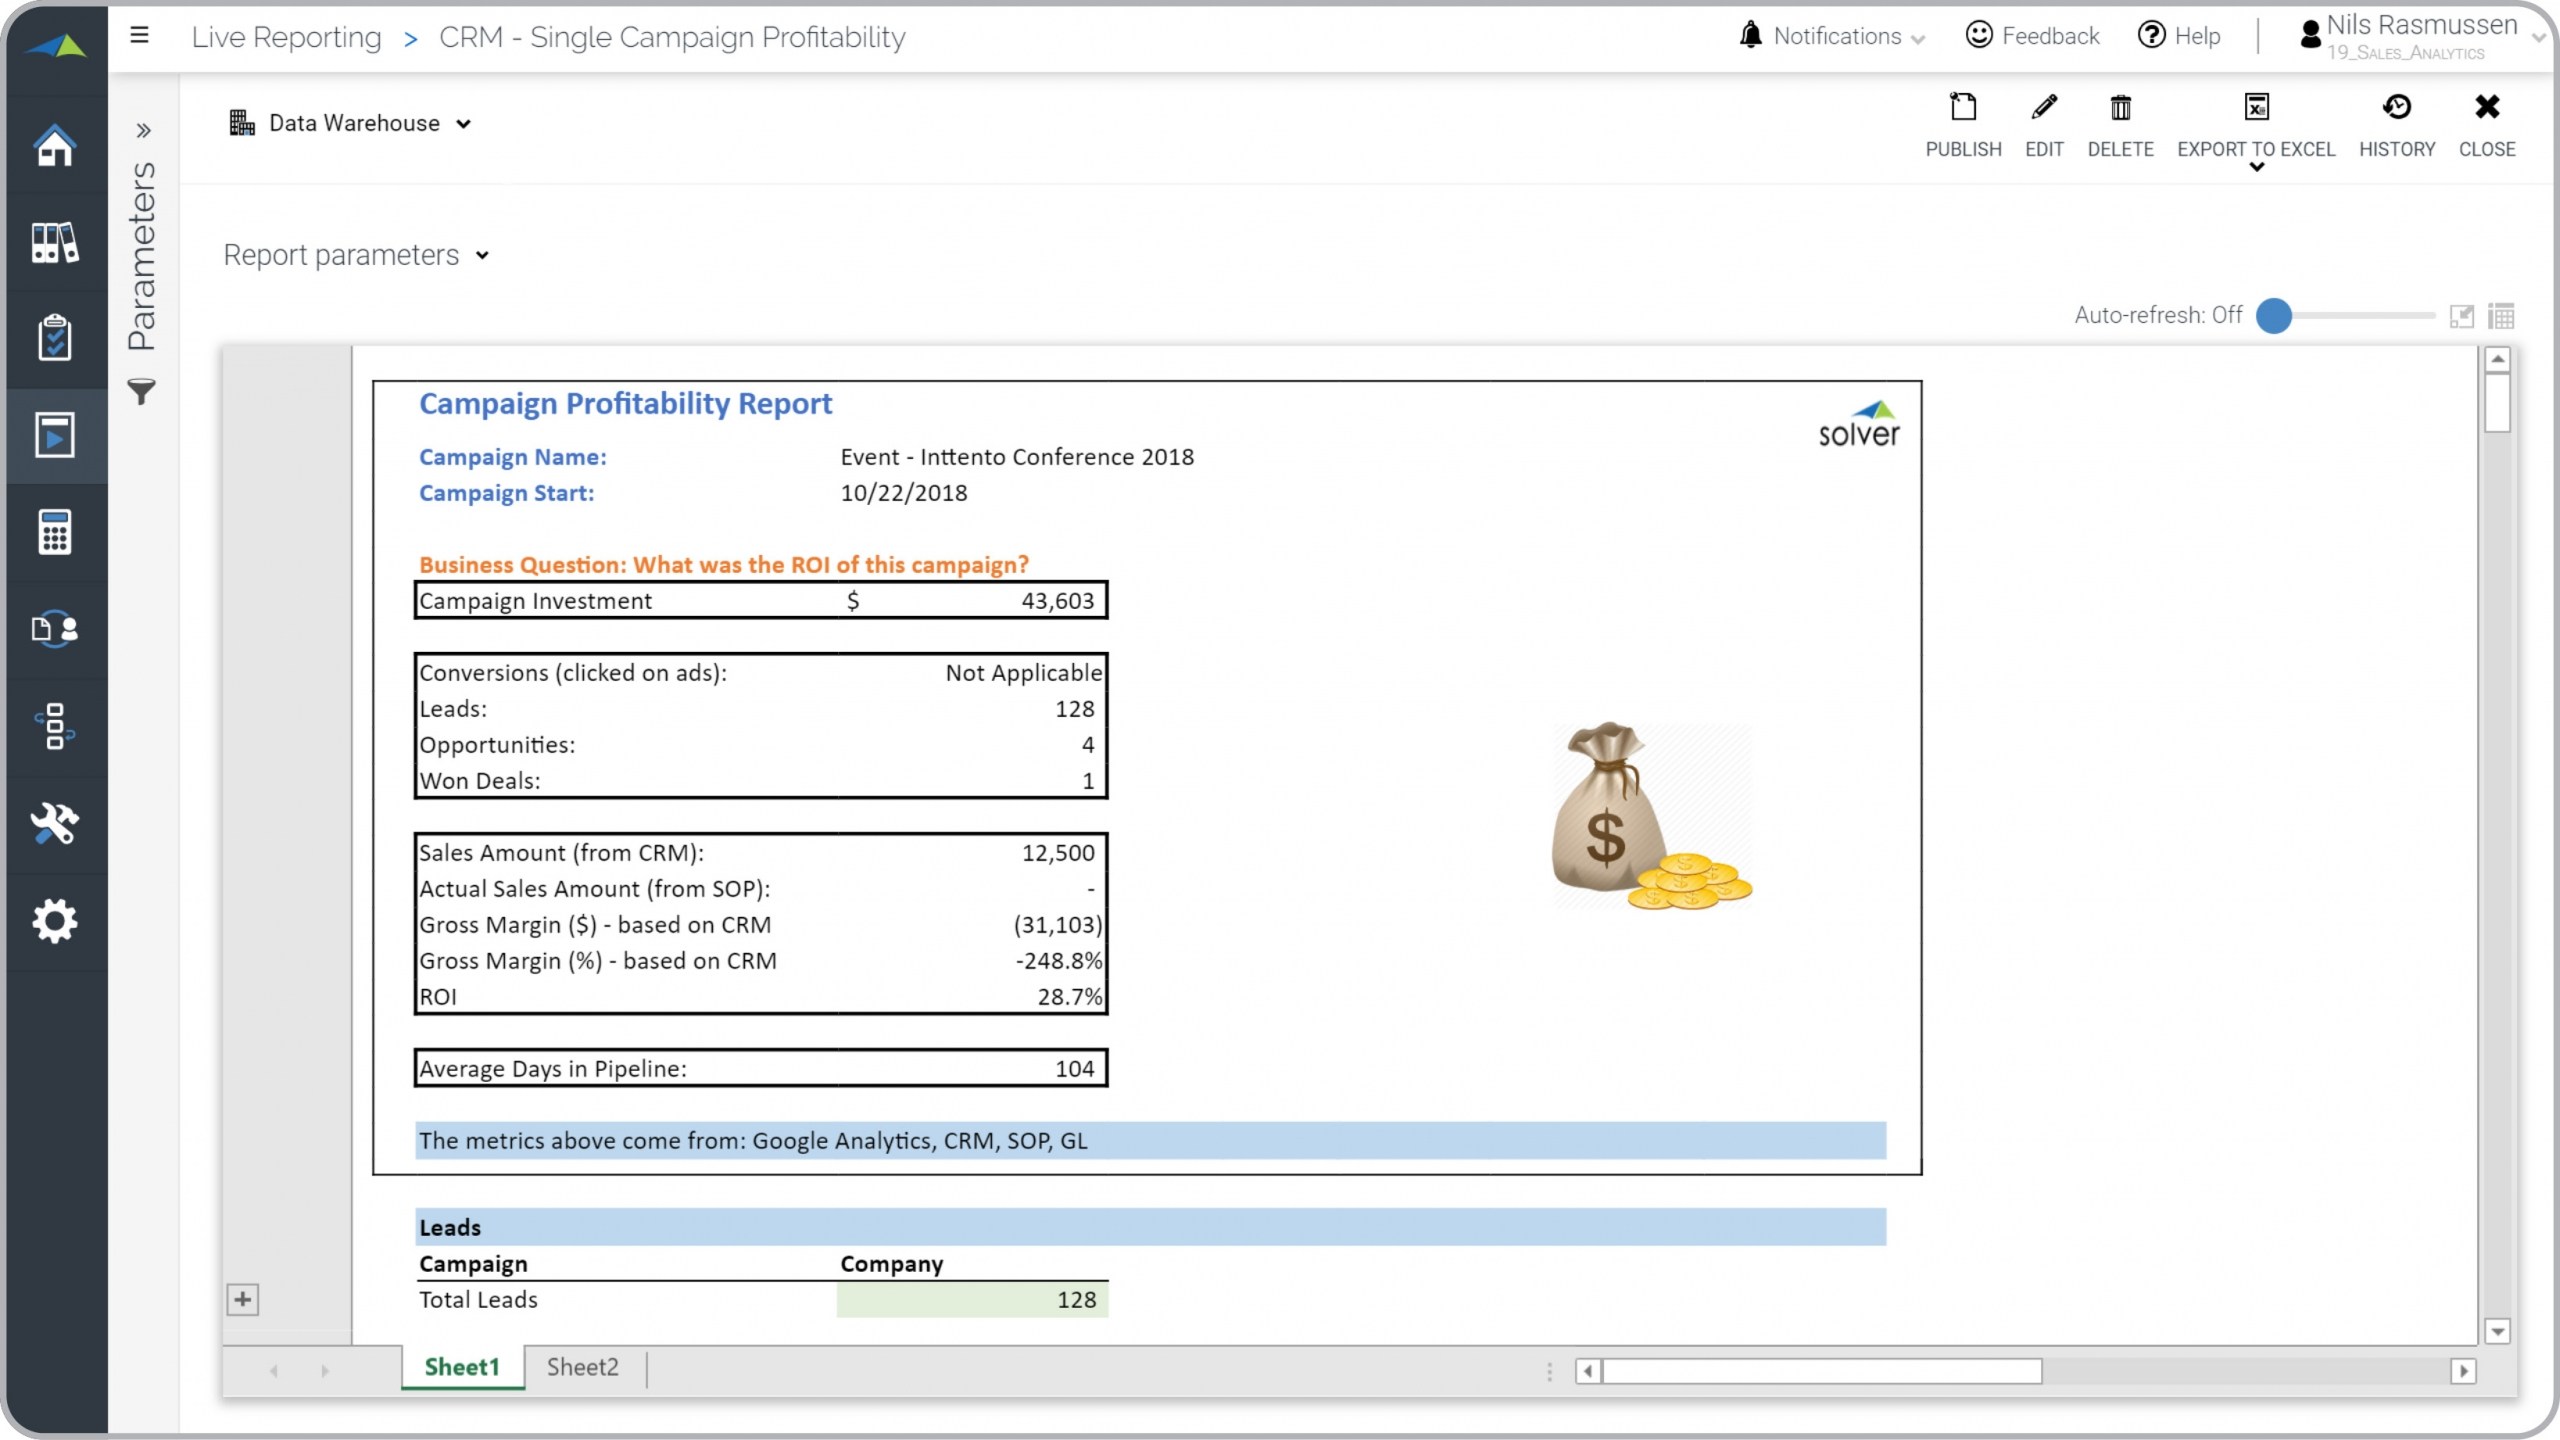
Marketing Campaign Profitability Report
What is a Marketing Campaign Profitability Report ? Campaign profitability reports are considered ...
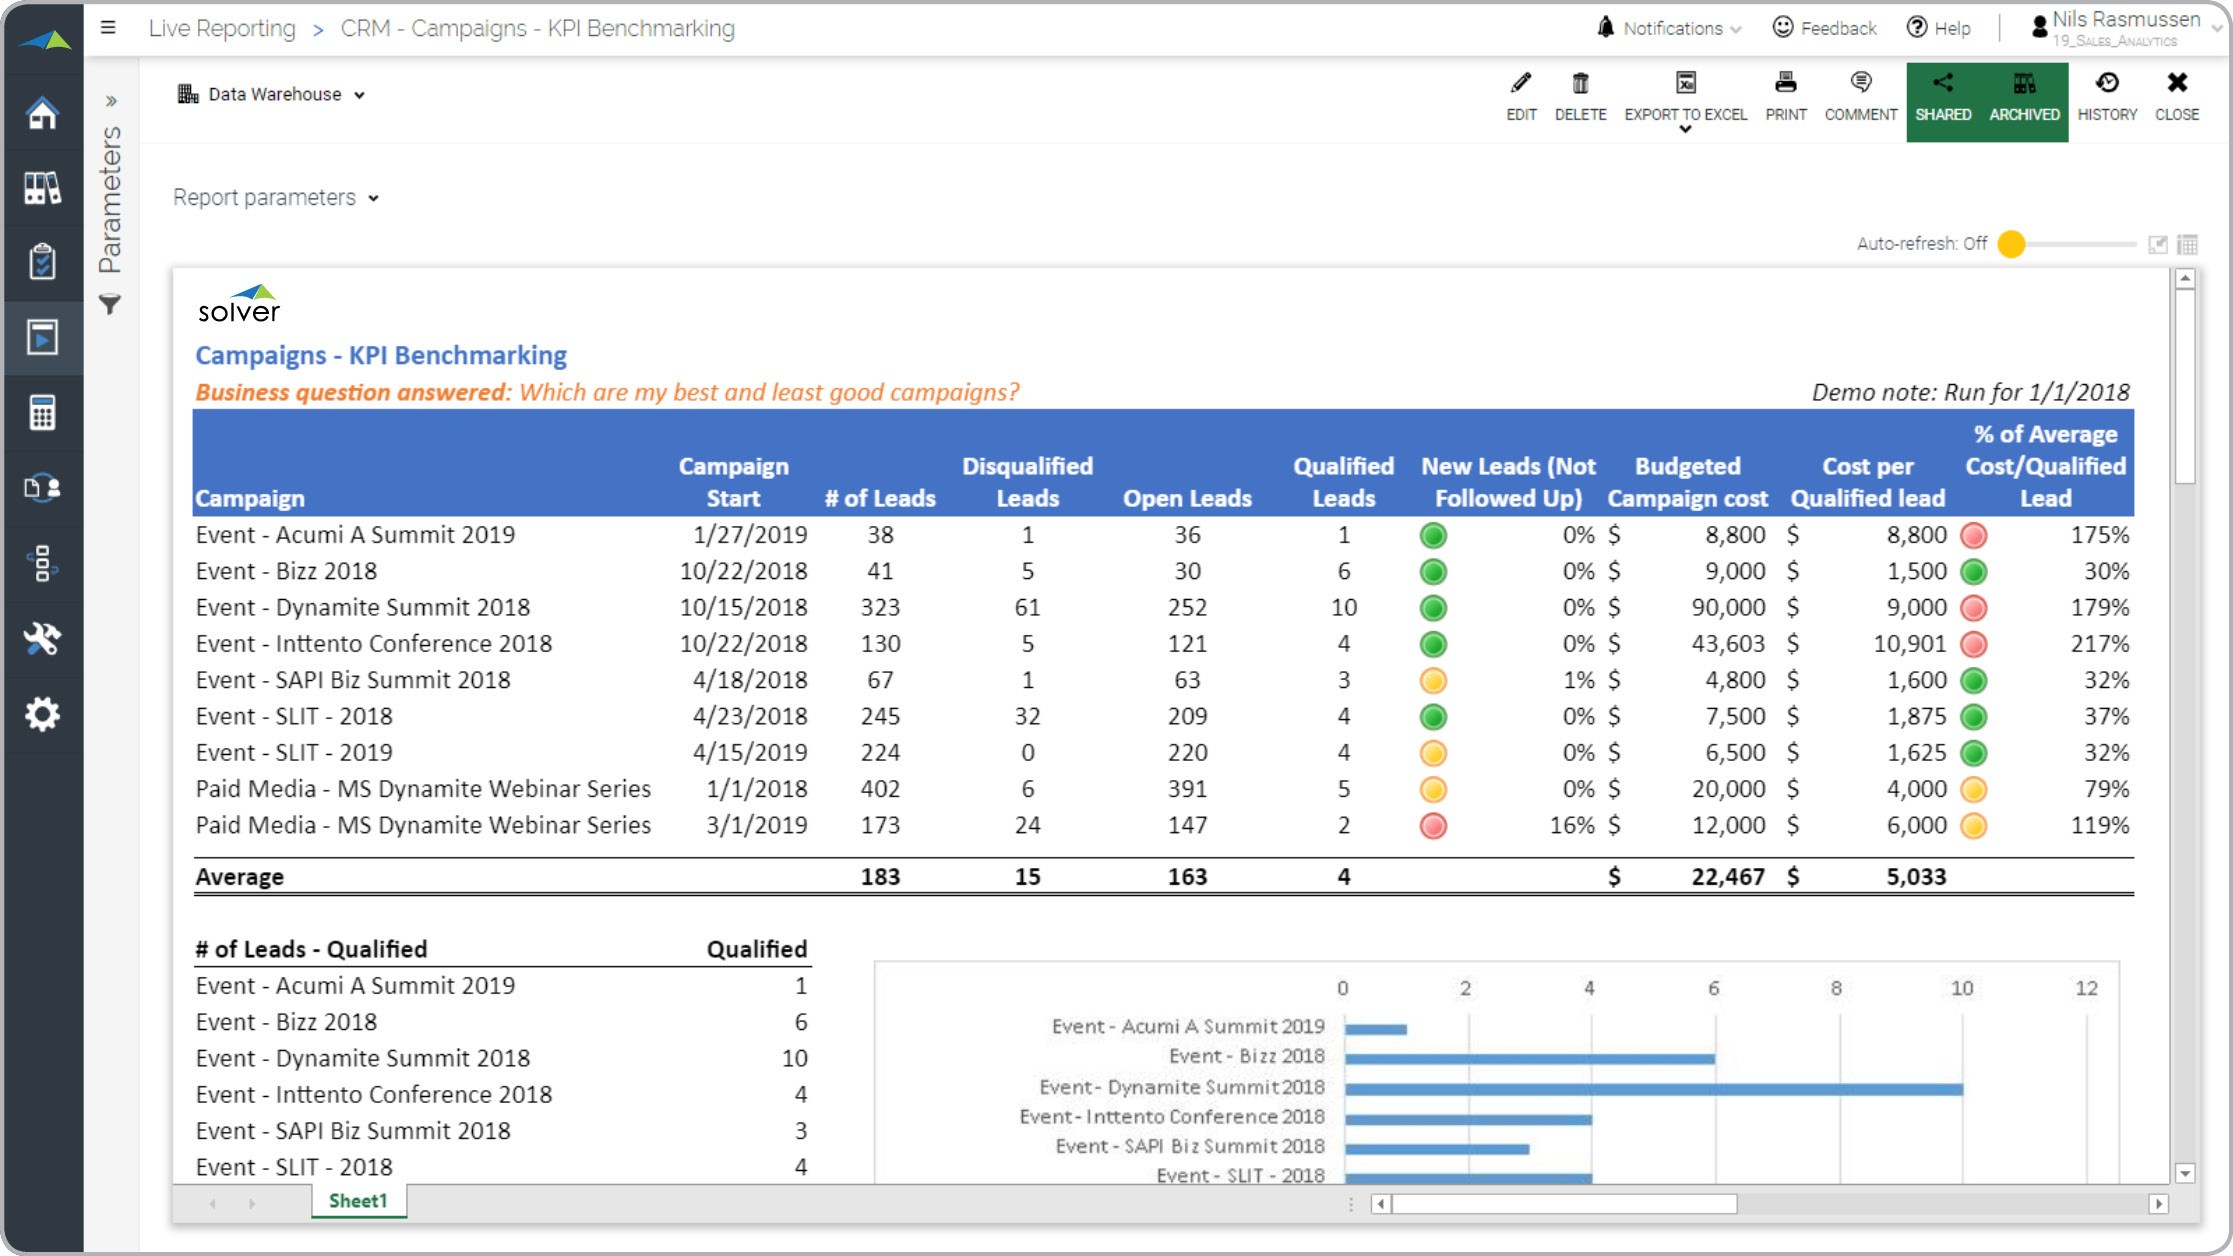
Marketing Campaign Analysis Report
What is a Marketing Campaign Analysis Report ? Campaign analysis reports are considered essential ...
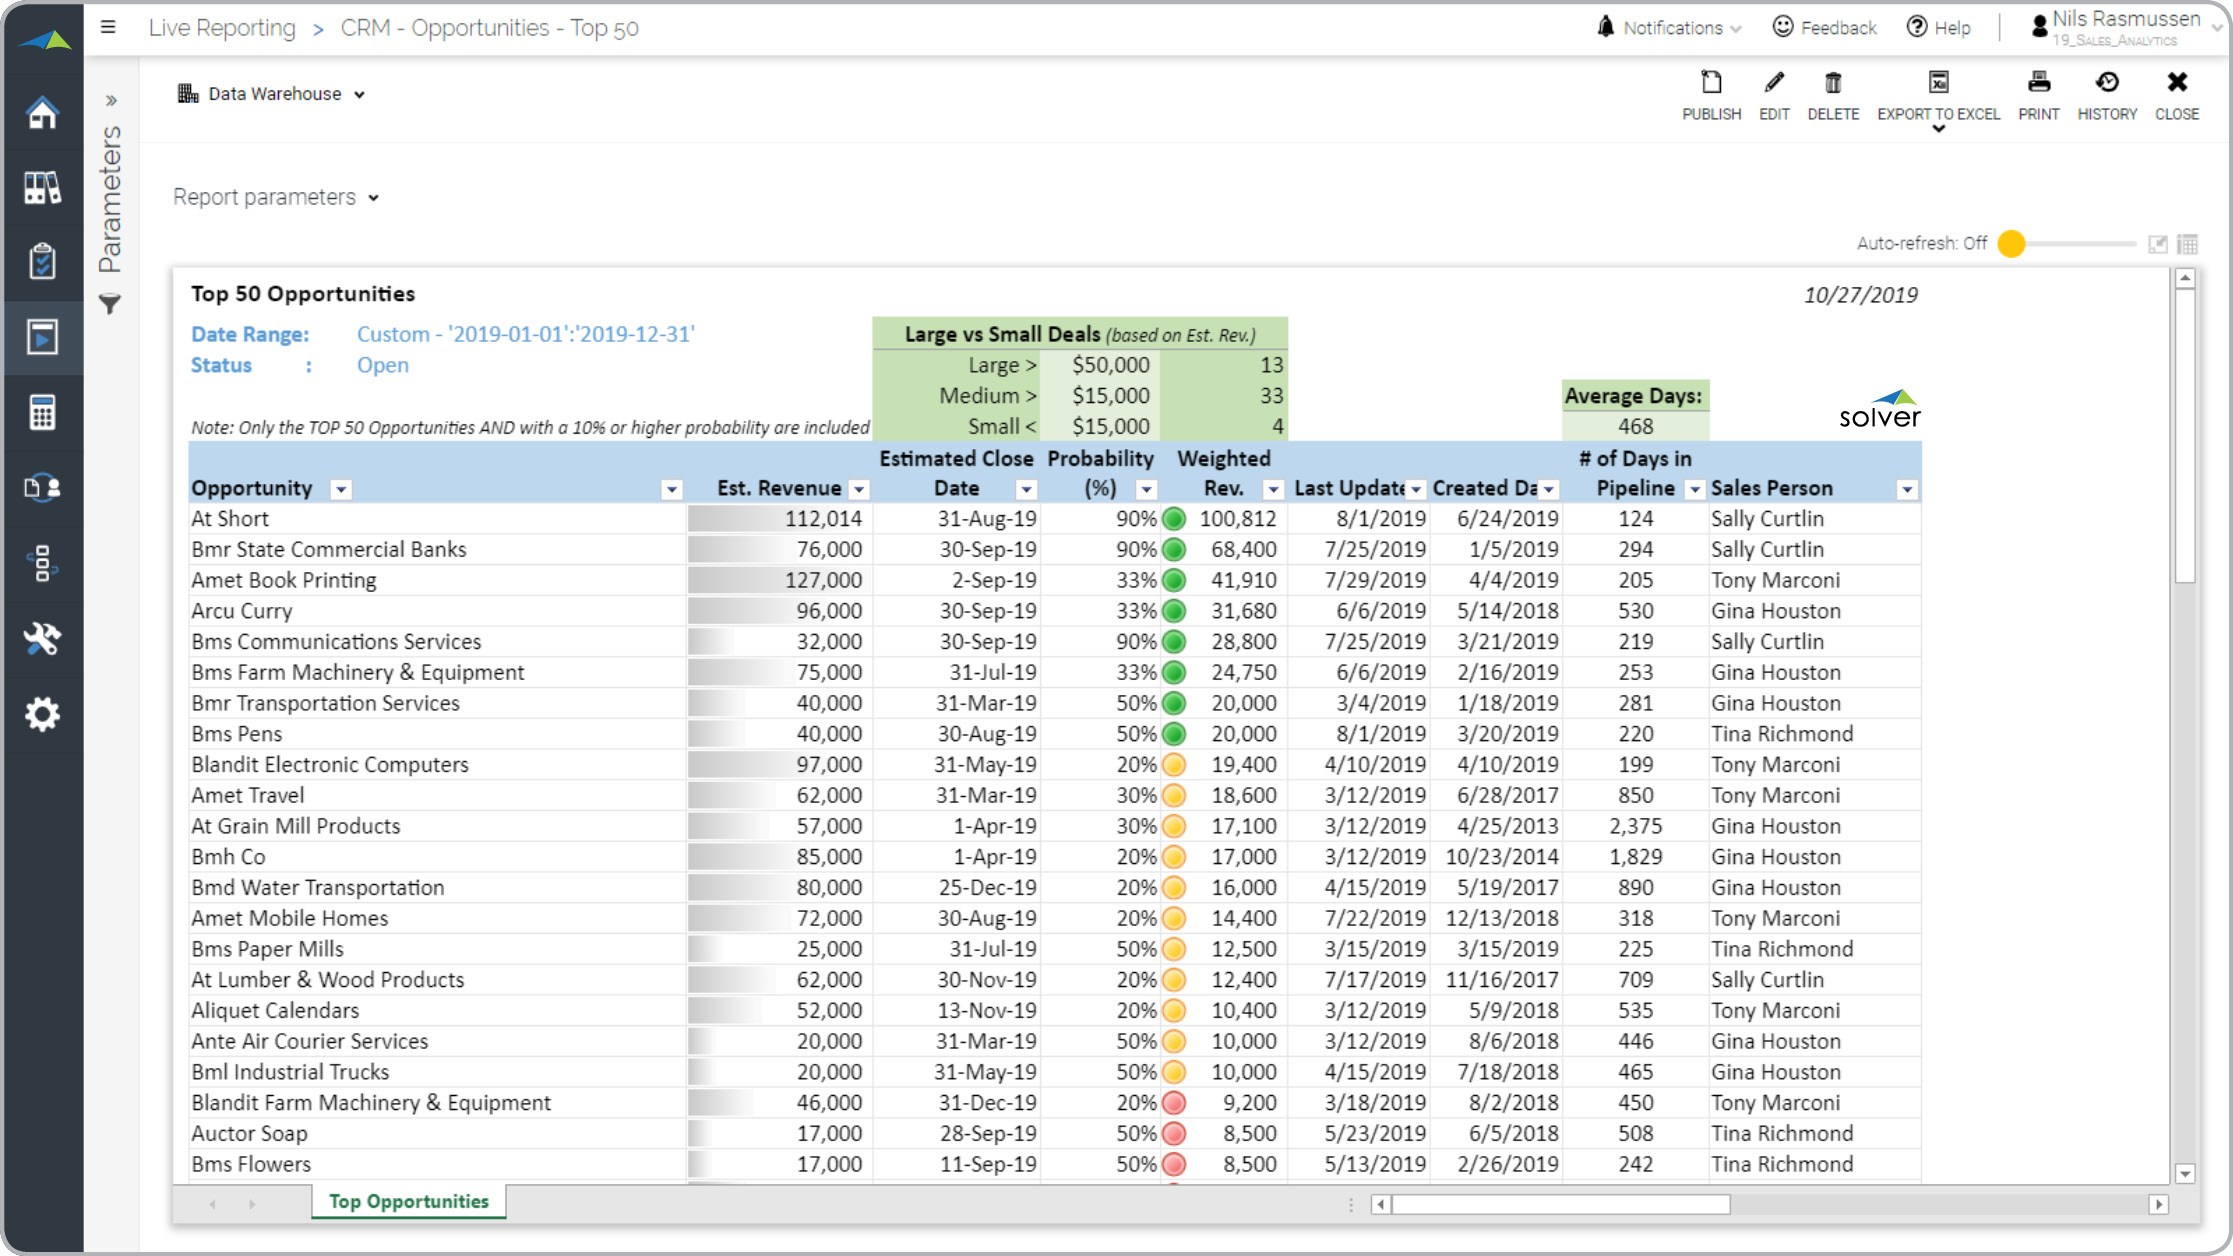
Top Sales Opportunities KPI Report
What is a Top Sales Opportunities KPI Report ? Top opportunity reports are considered pipeline ...
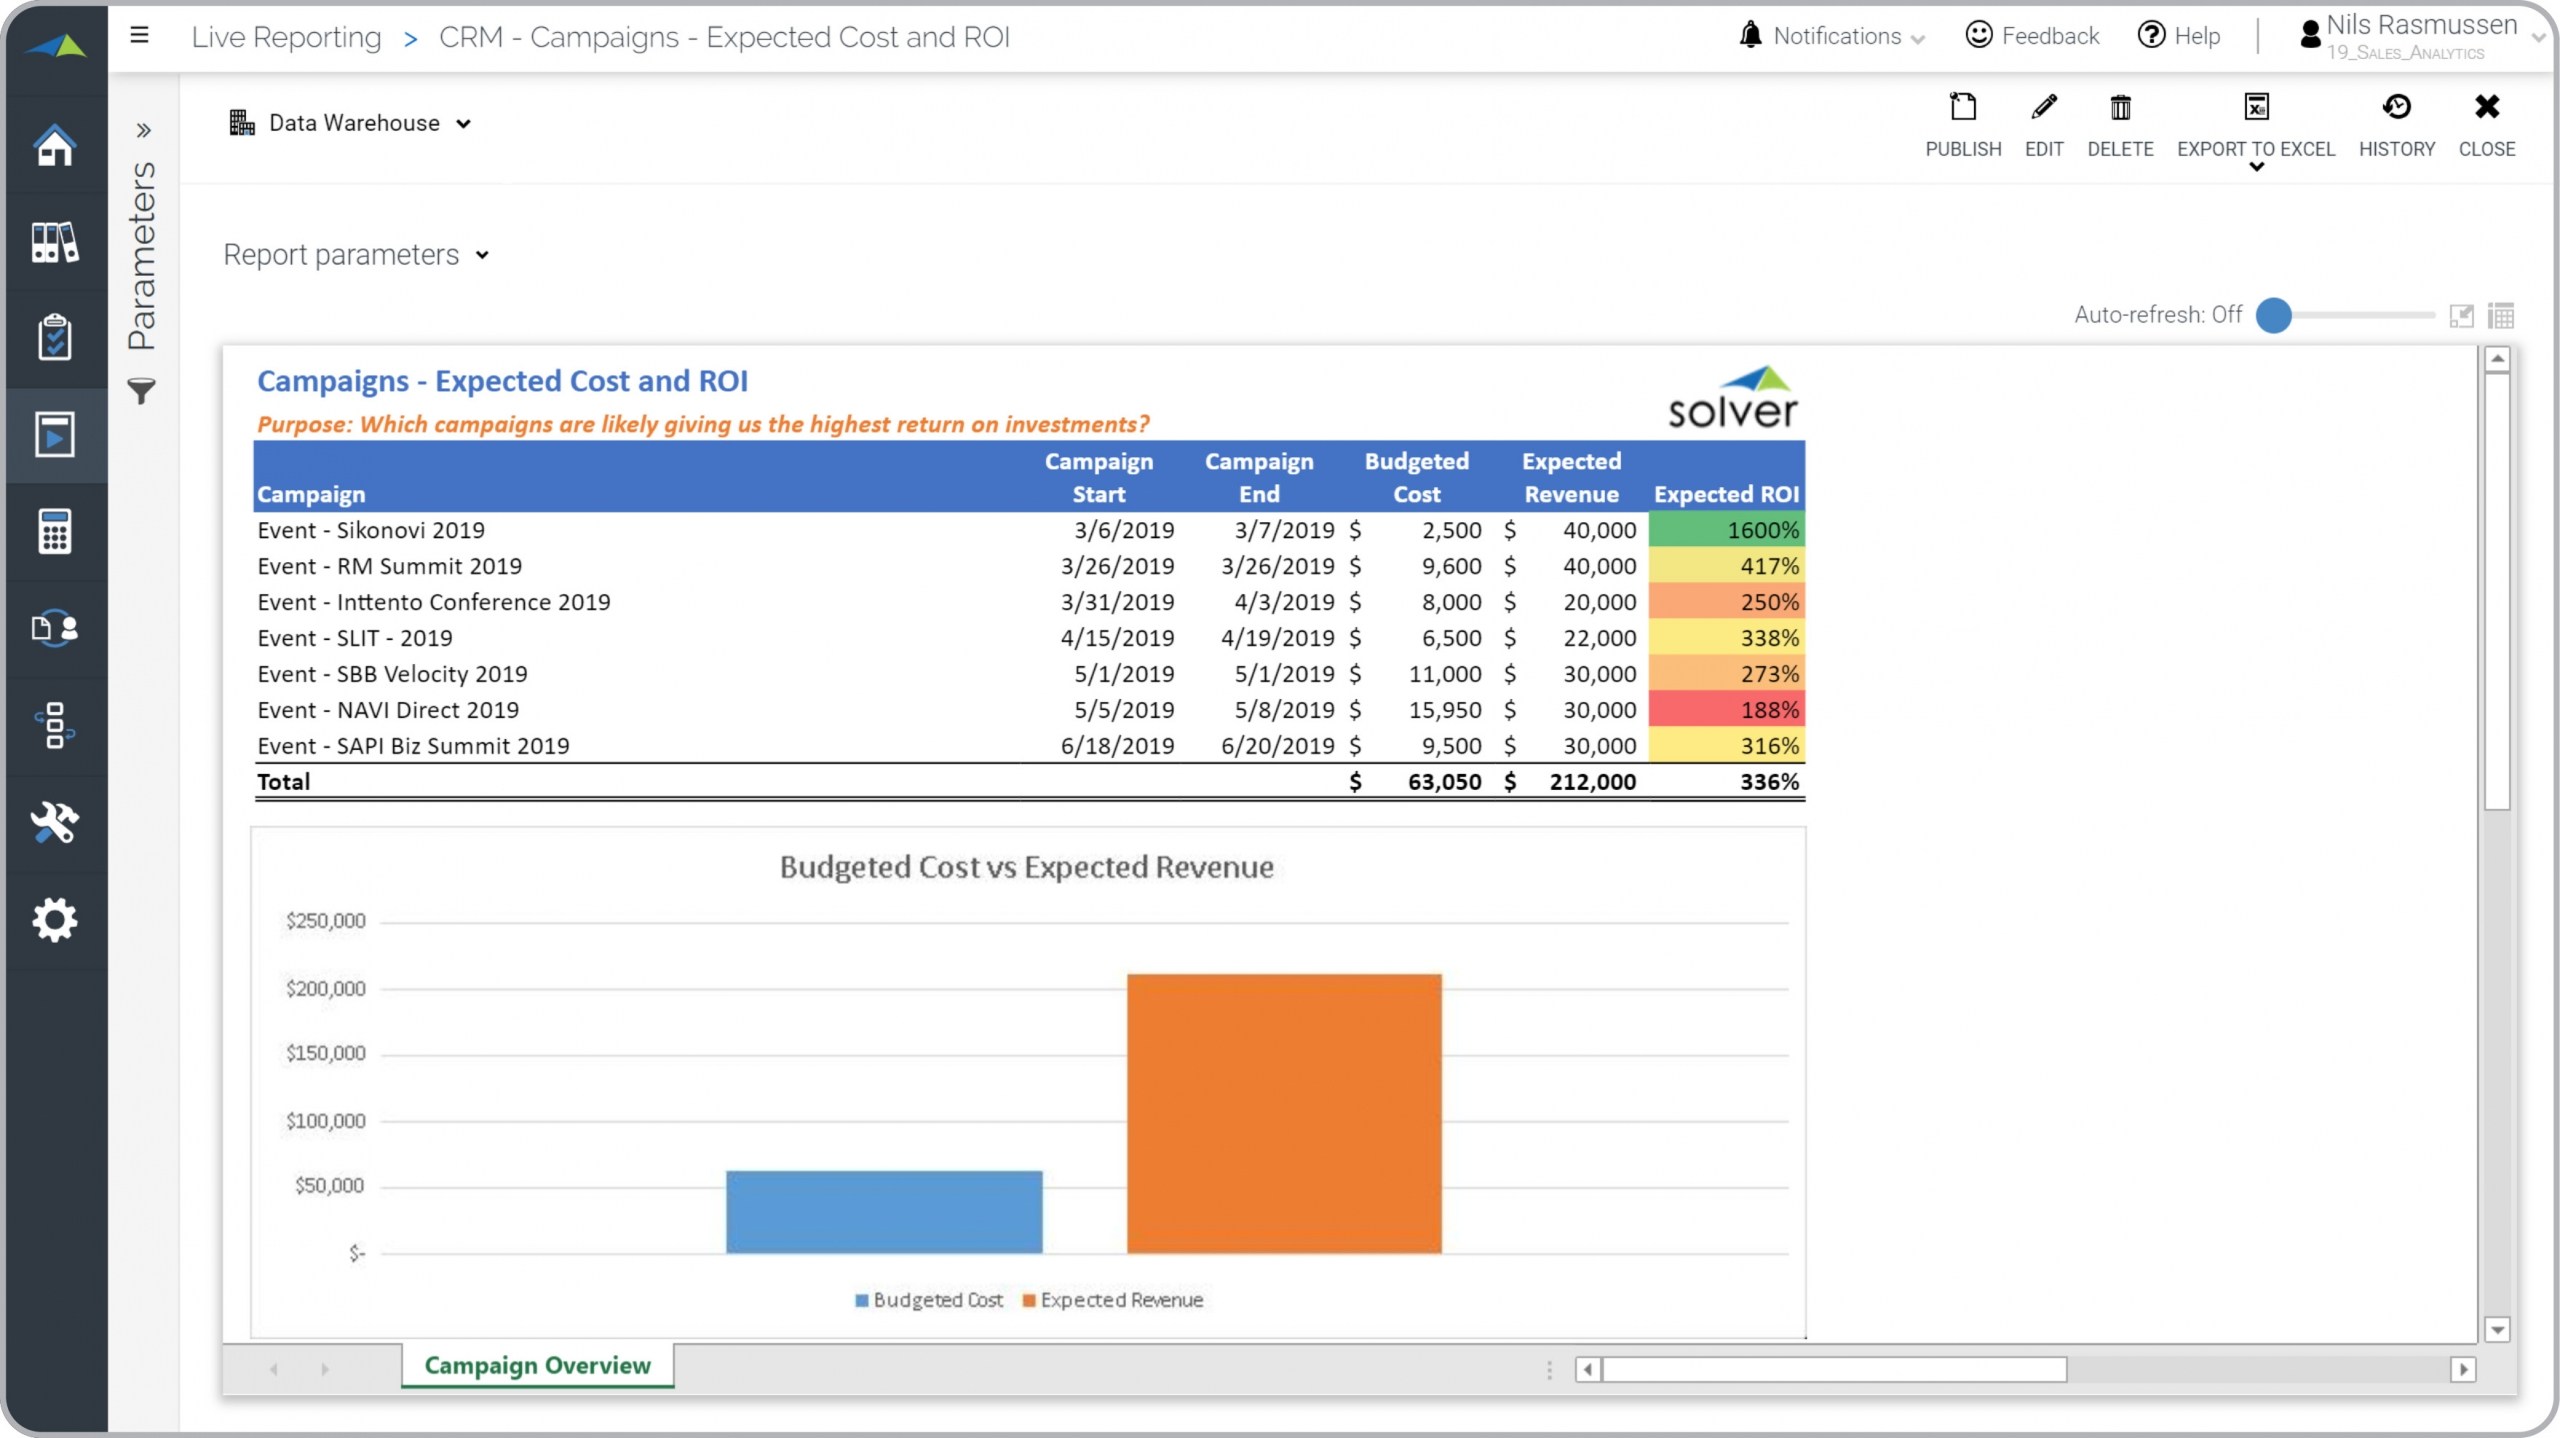
Marketing Campaign Report with Cost and ROI Analysis
What is a Marketing Campaign Report with Cost and ROI Analysis ? Marketing campaign cost and return ...
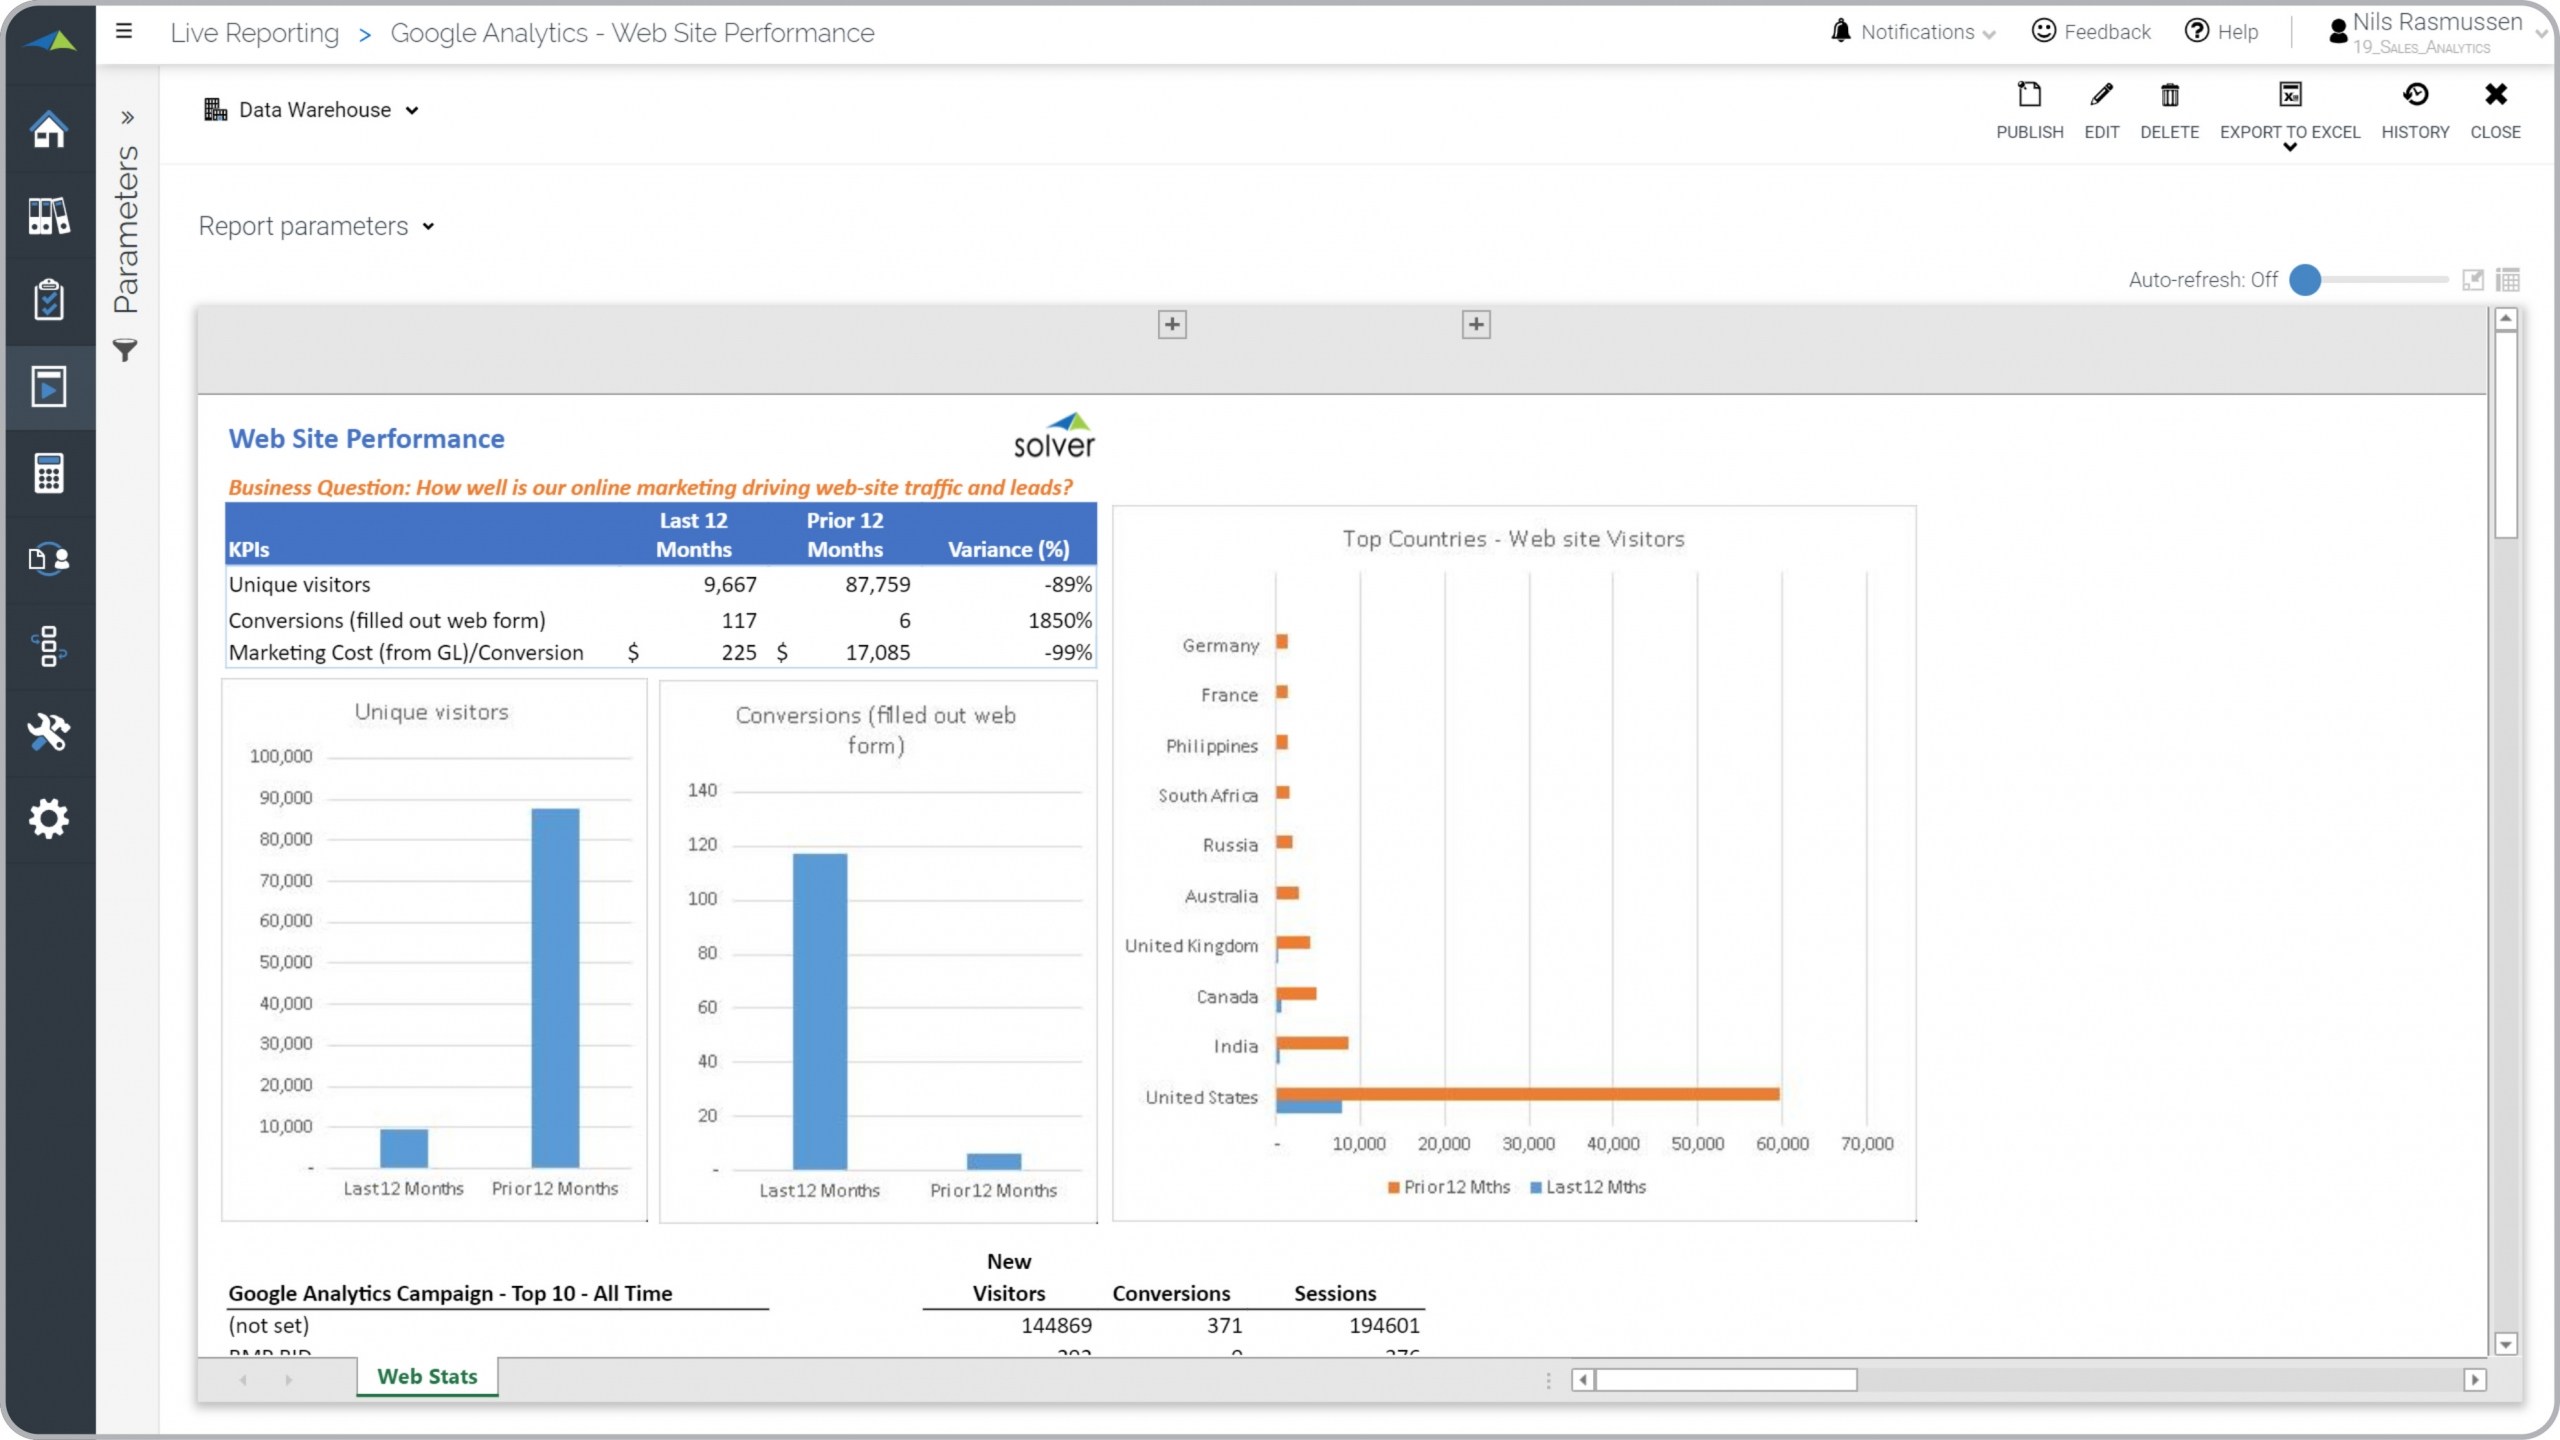
Website Efficiency Report
What is a Website Efficiency Report ? Website efficiency reports are considered web analytics tools ...
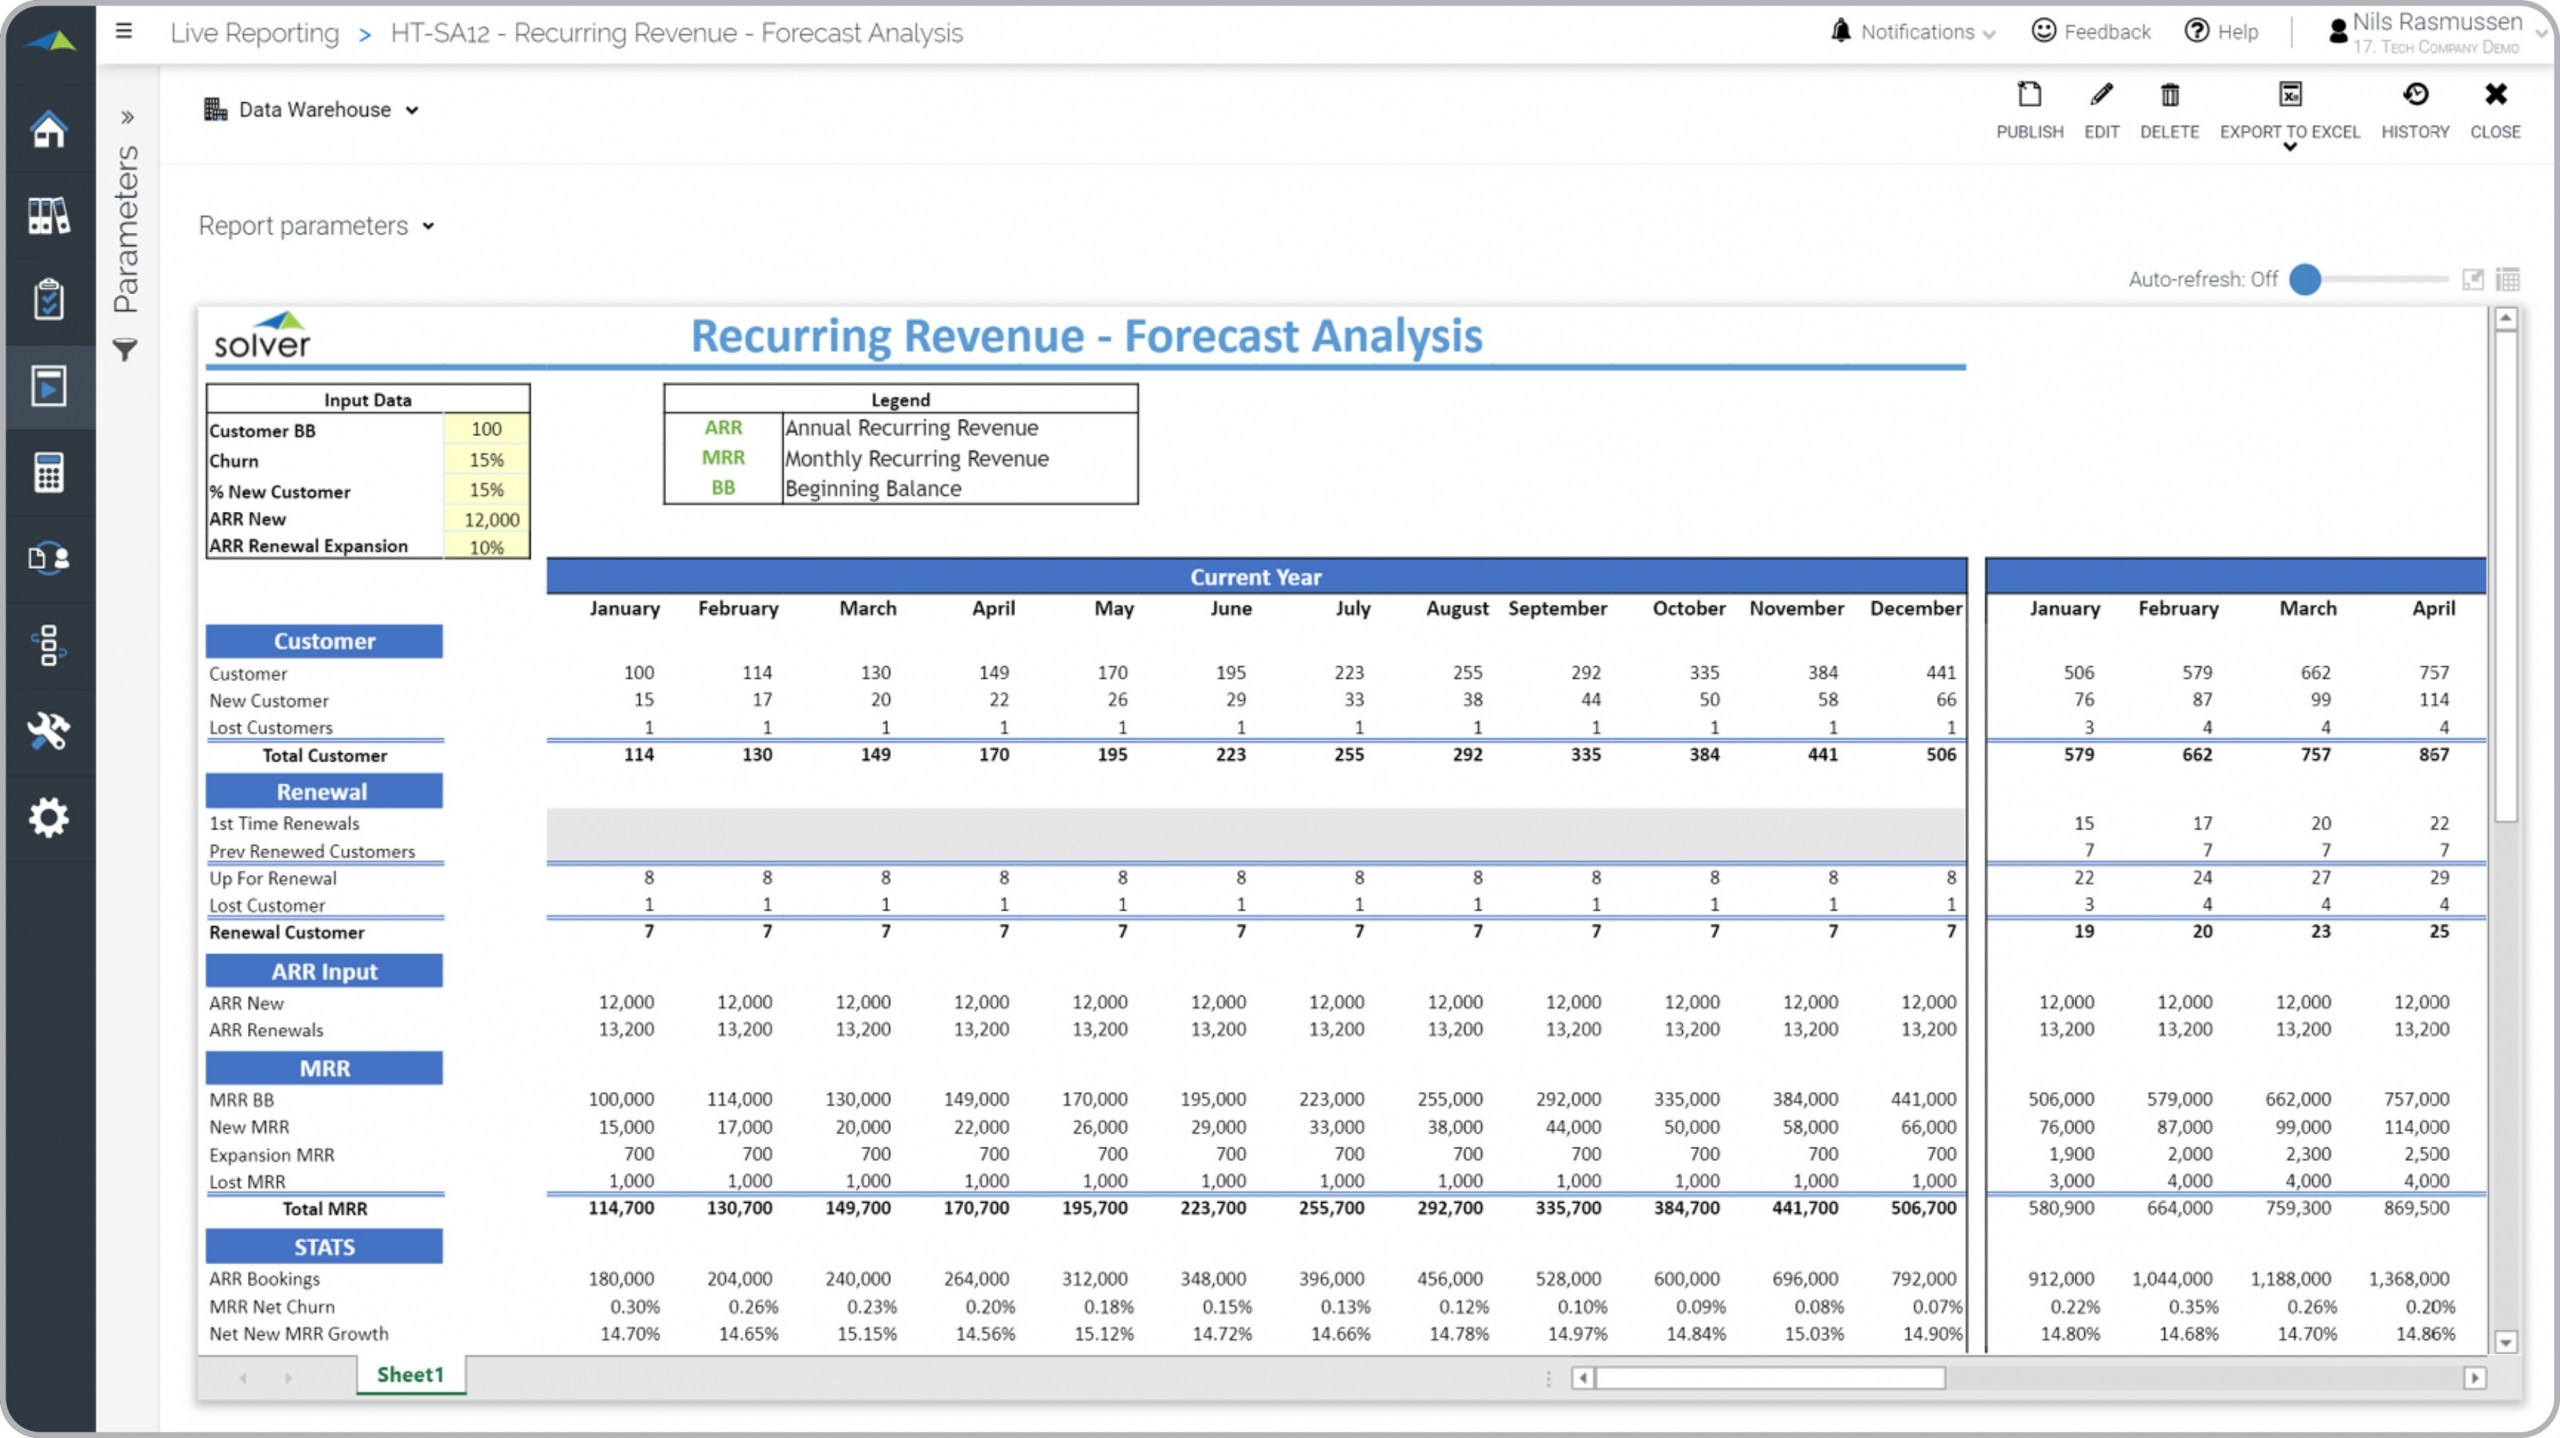
Recurring Revenue Forecast Model for a Technology Company
What is a Recurring Revenue Forecast Model ? Recurring revenue forecast models are considered ...
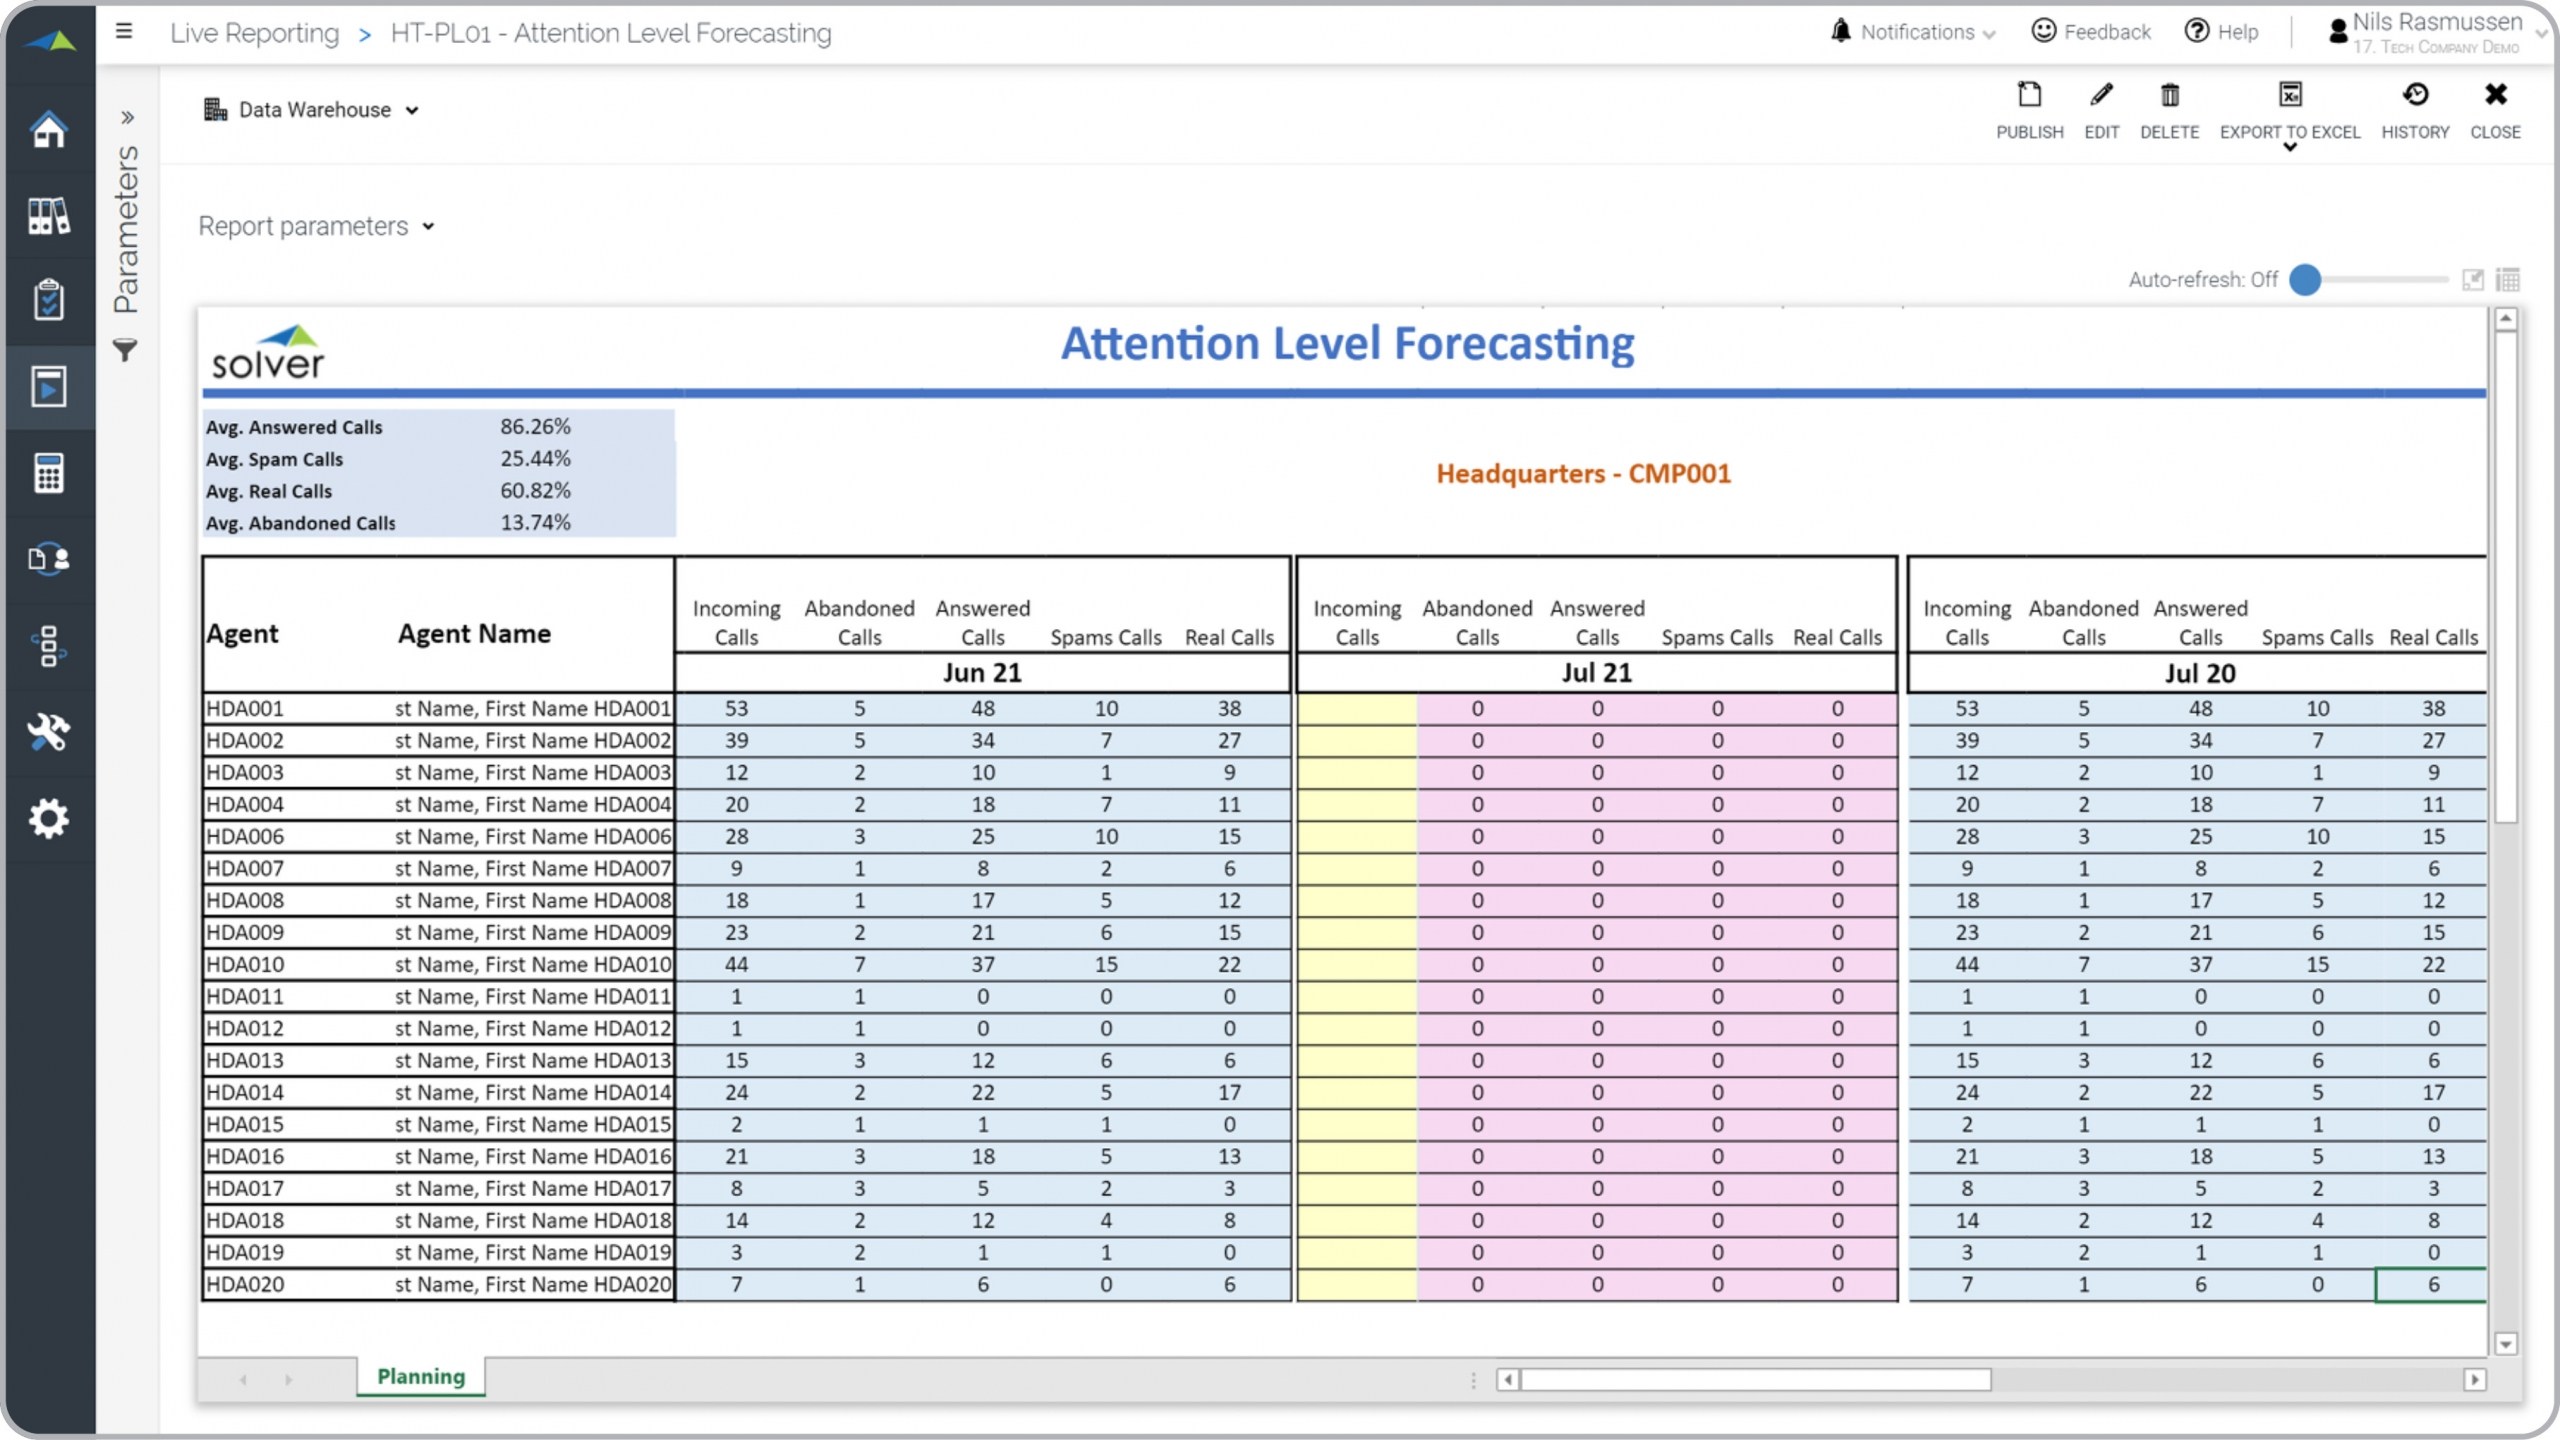
Helpdesk Service Goals and Call Volume Forecast
What is a Helpdesk Service Goals and Call Volume Forecast ? Hepdesk Service and Call Volume ...
Helpdesk Call Analysis Report for a Technology Company
What is a Helpdesk Call Analysis Report ? Call analytics reports are considered operational ...
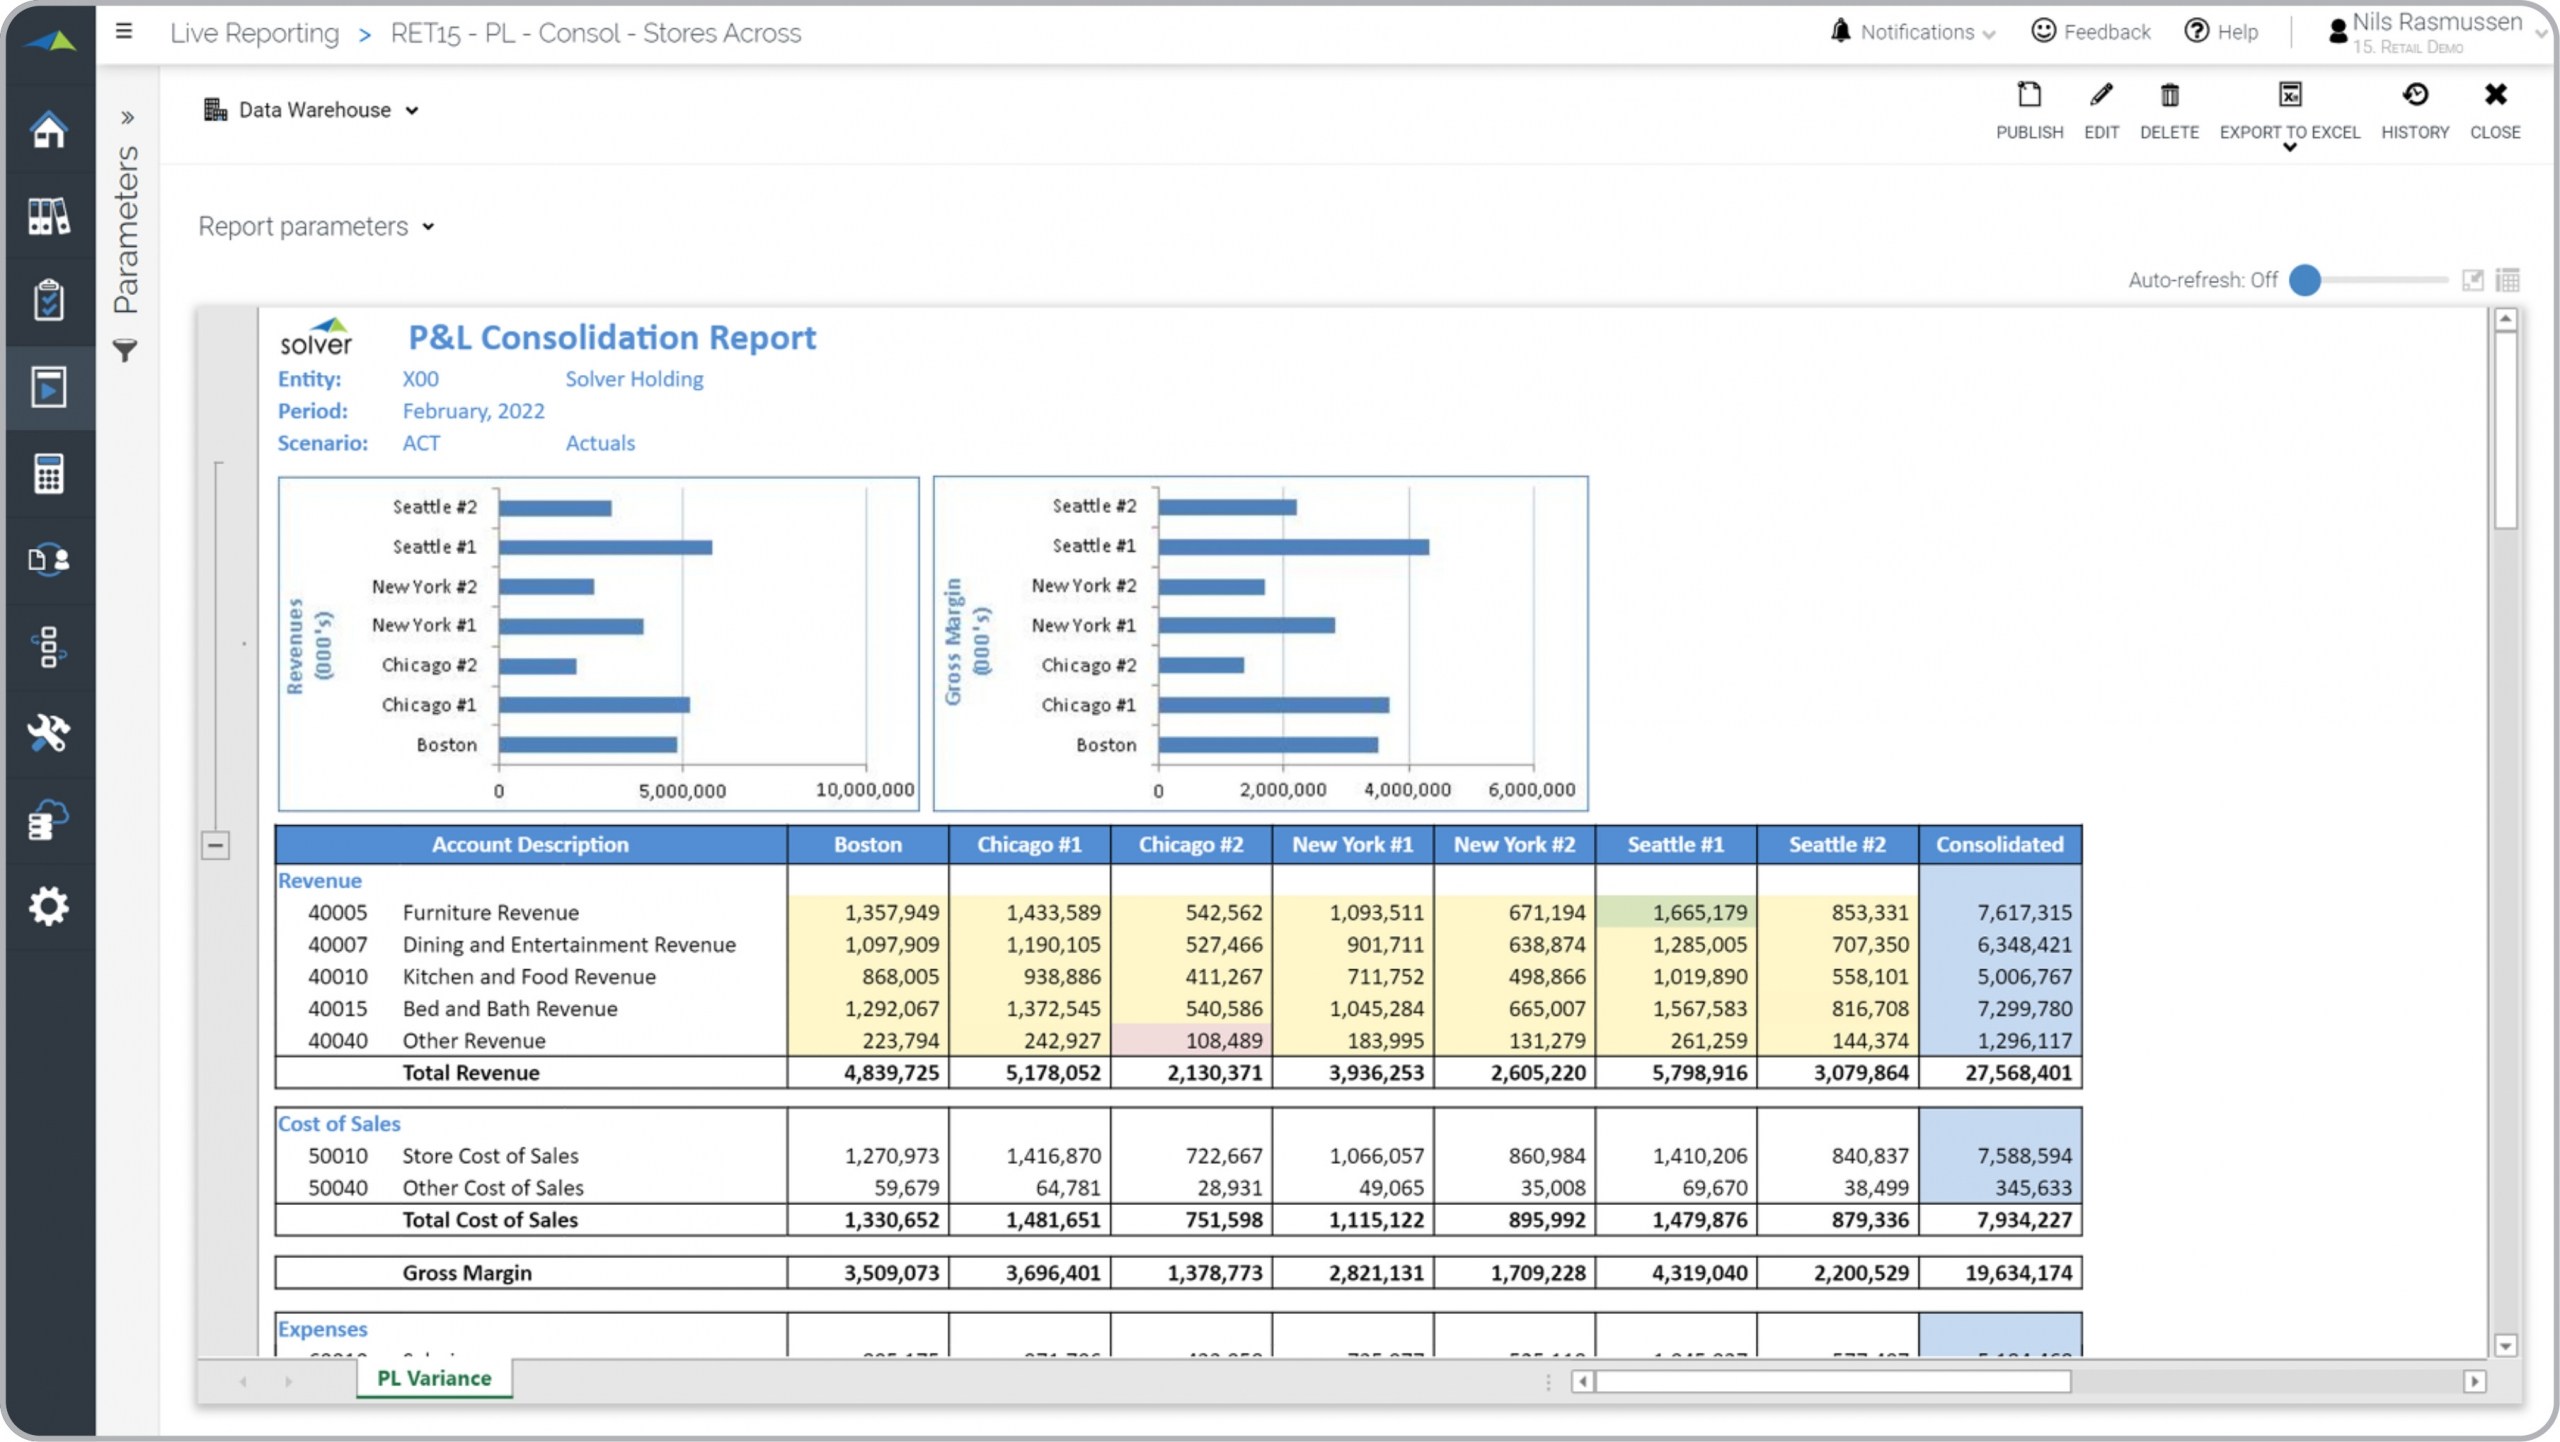
Consolidating Profit & Loss Report for a Retail Company
What is a Consolidating Profit & Loss Report for a Retail Company ? Consolidation reports are ...
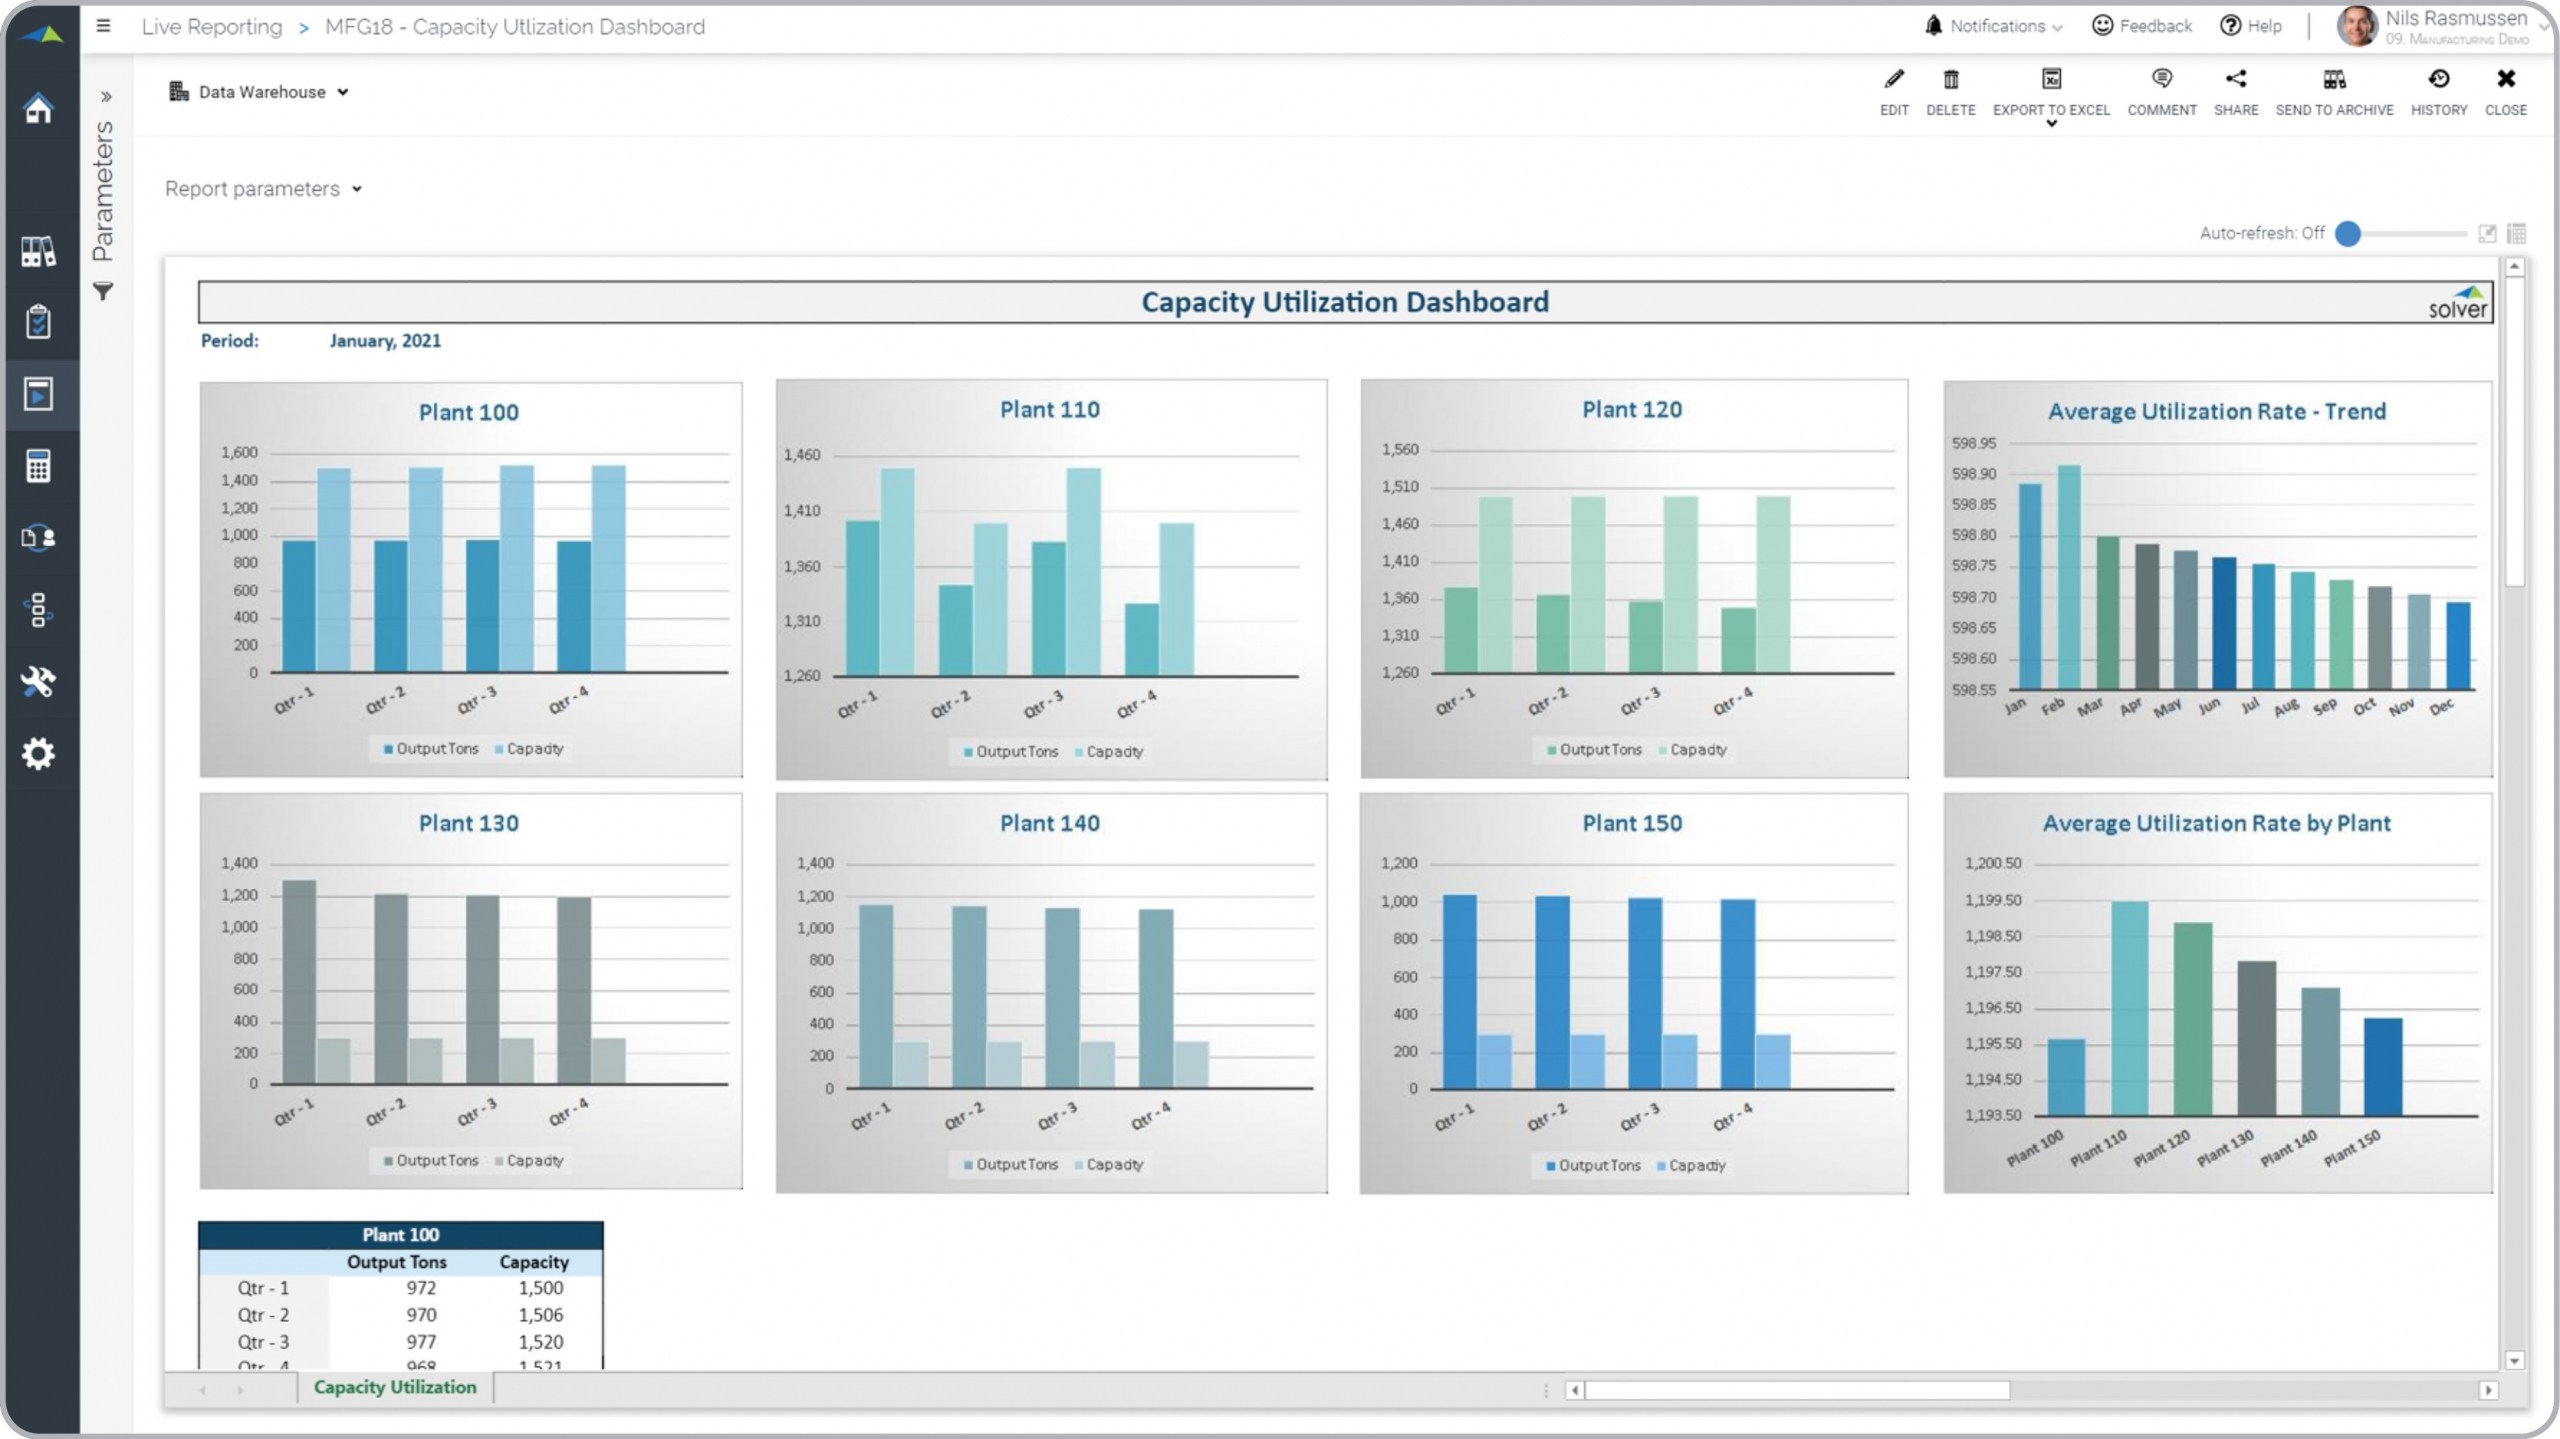
Capacity Utilization Dashboard with Manufacturing Plant Comparisons
What is a Capacity Utilization Dashboard ? Utilization analysis dashboards with comparative ...
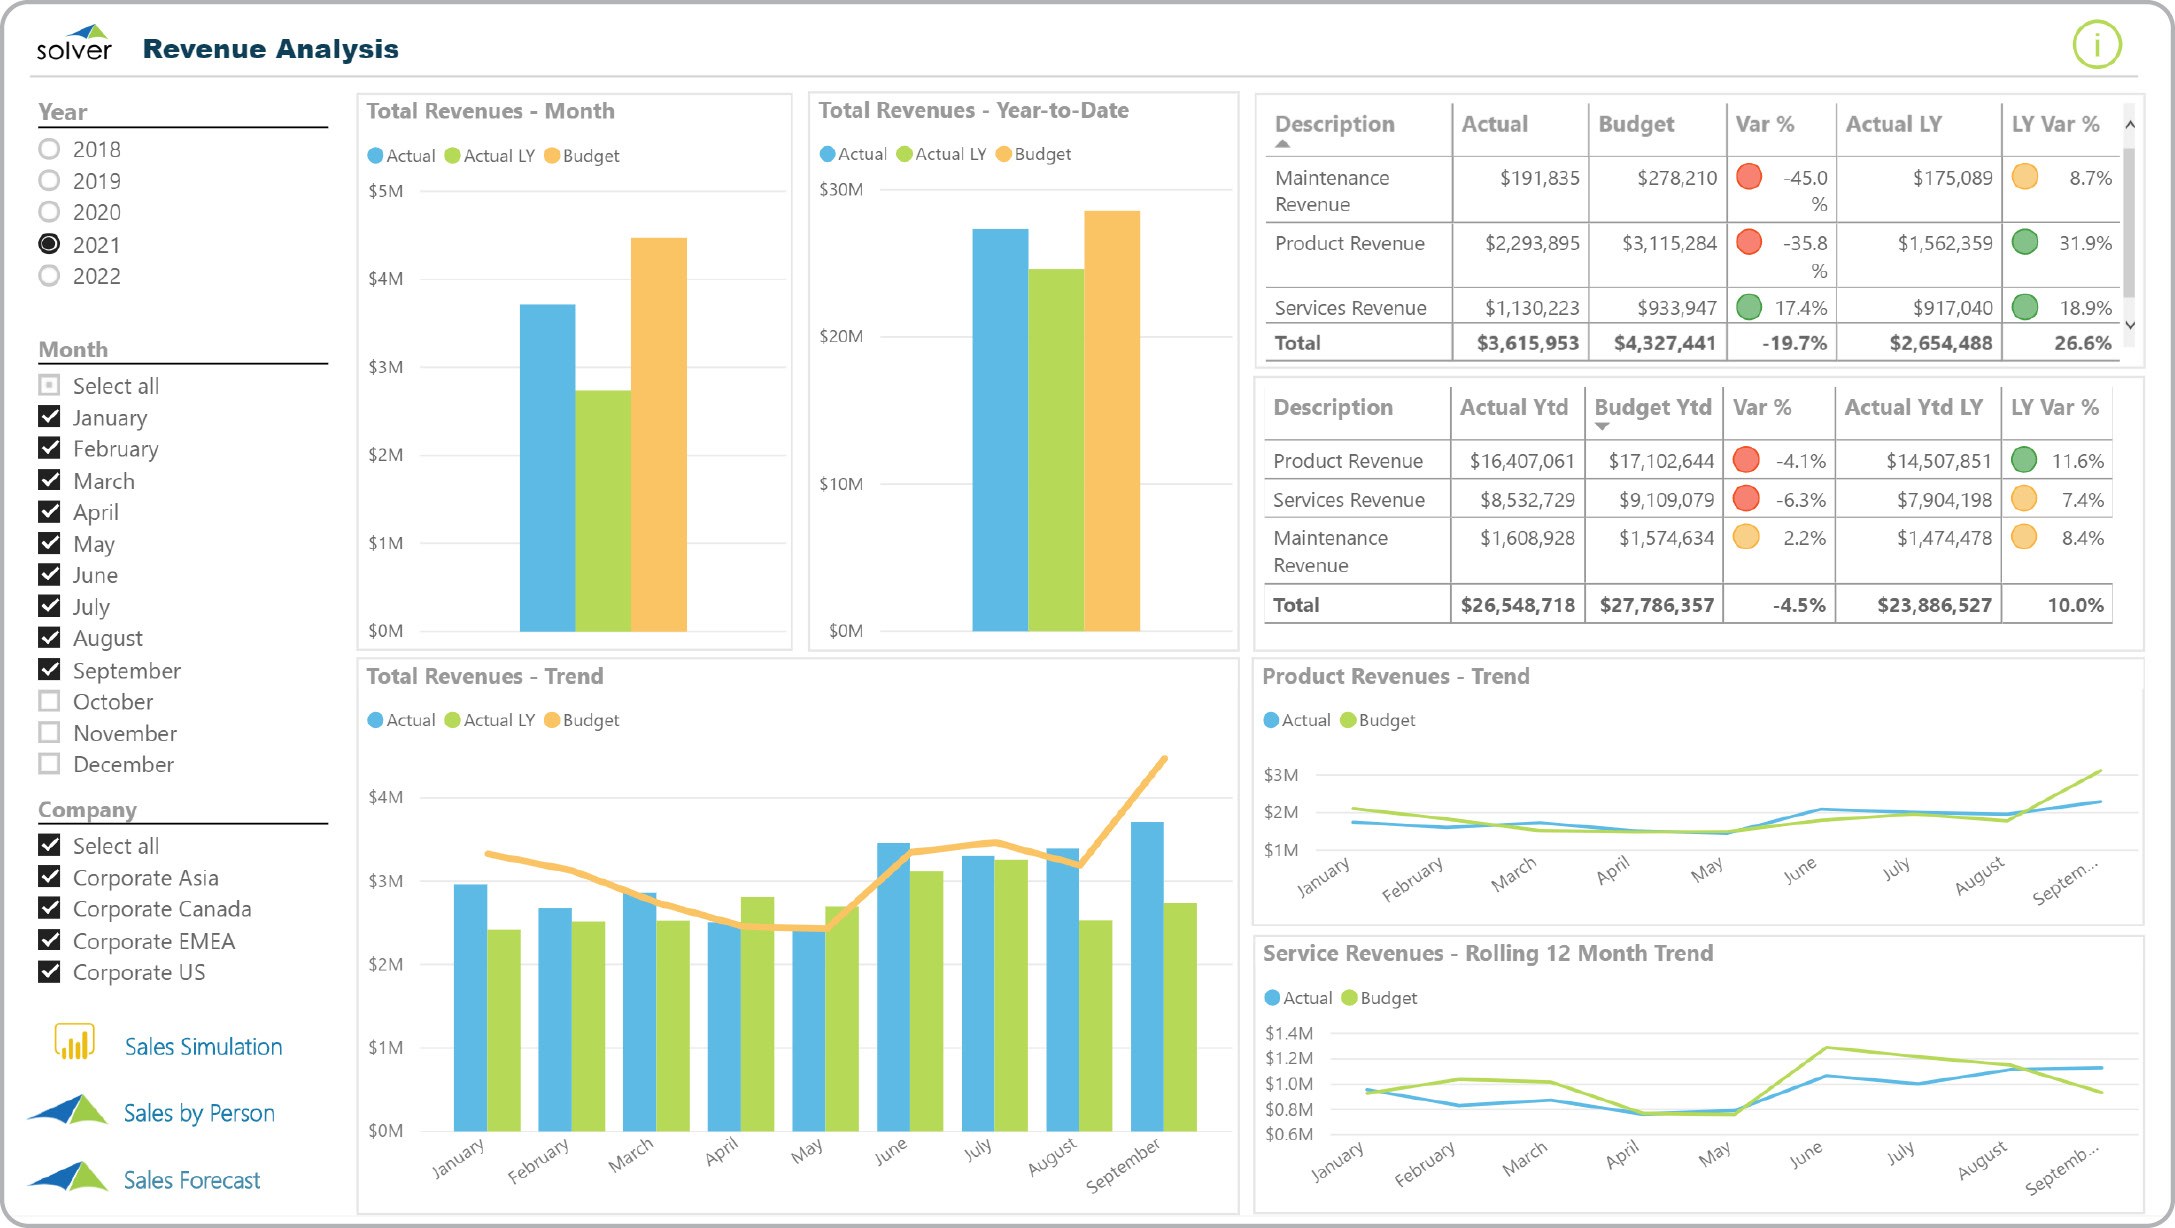
Revenue Analysis Dashboard
What is a Revenue Analysis Dashboard ? Revenue Dashboards are considered financial dashboards and ...
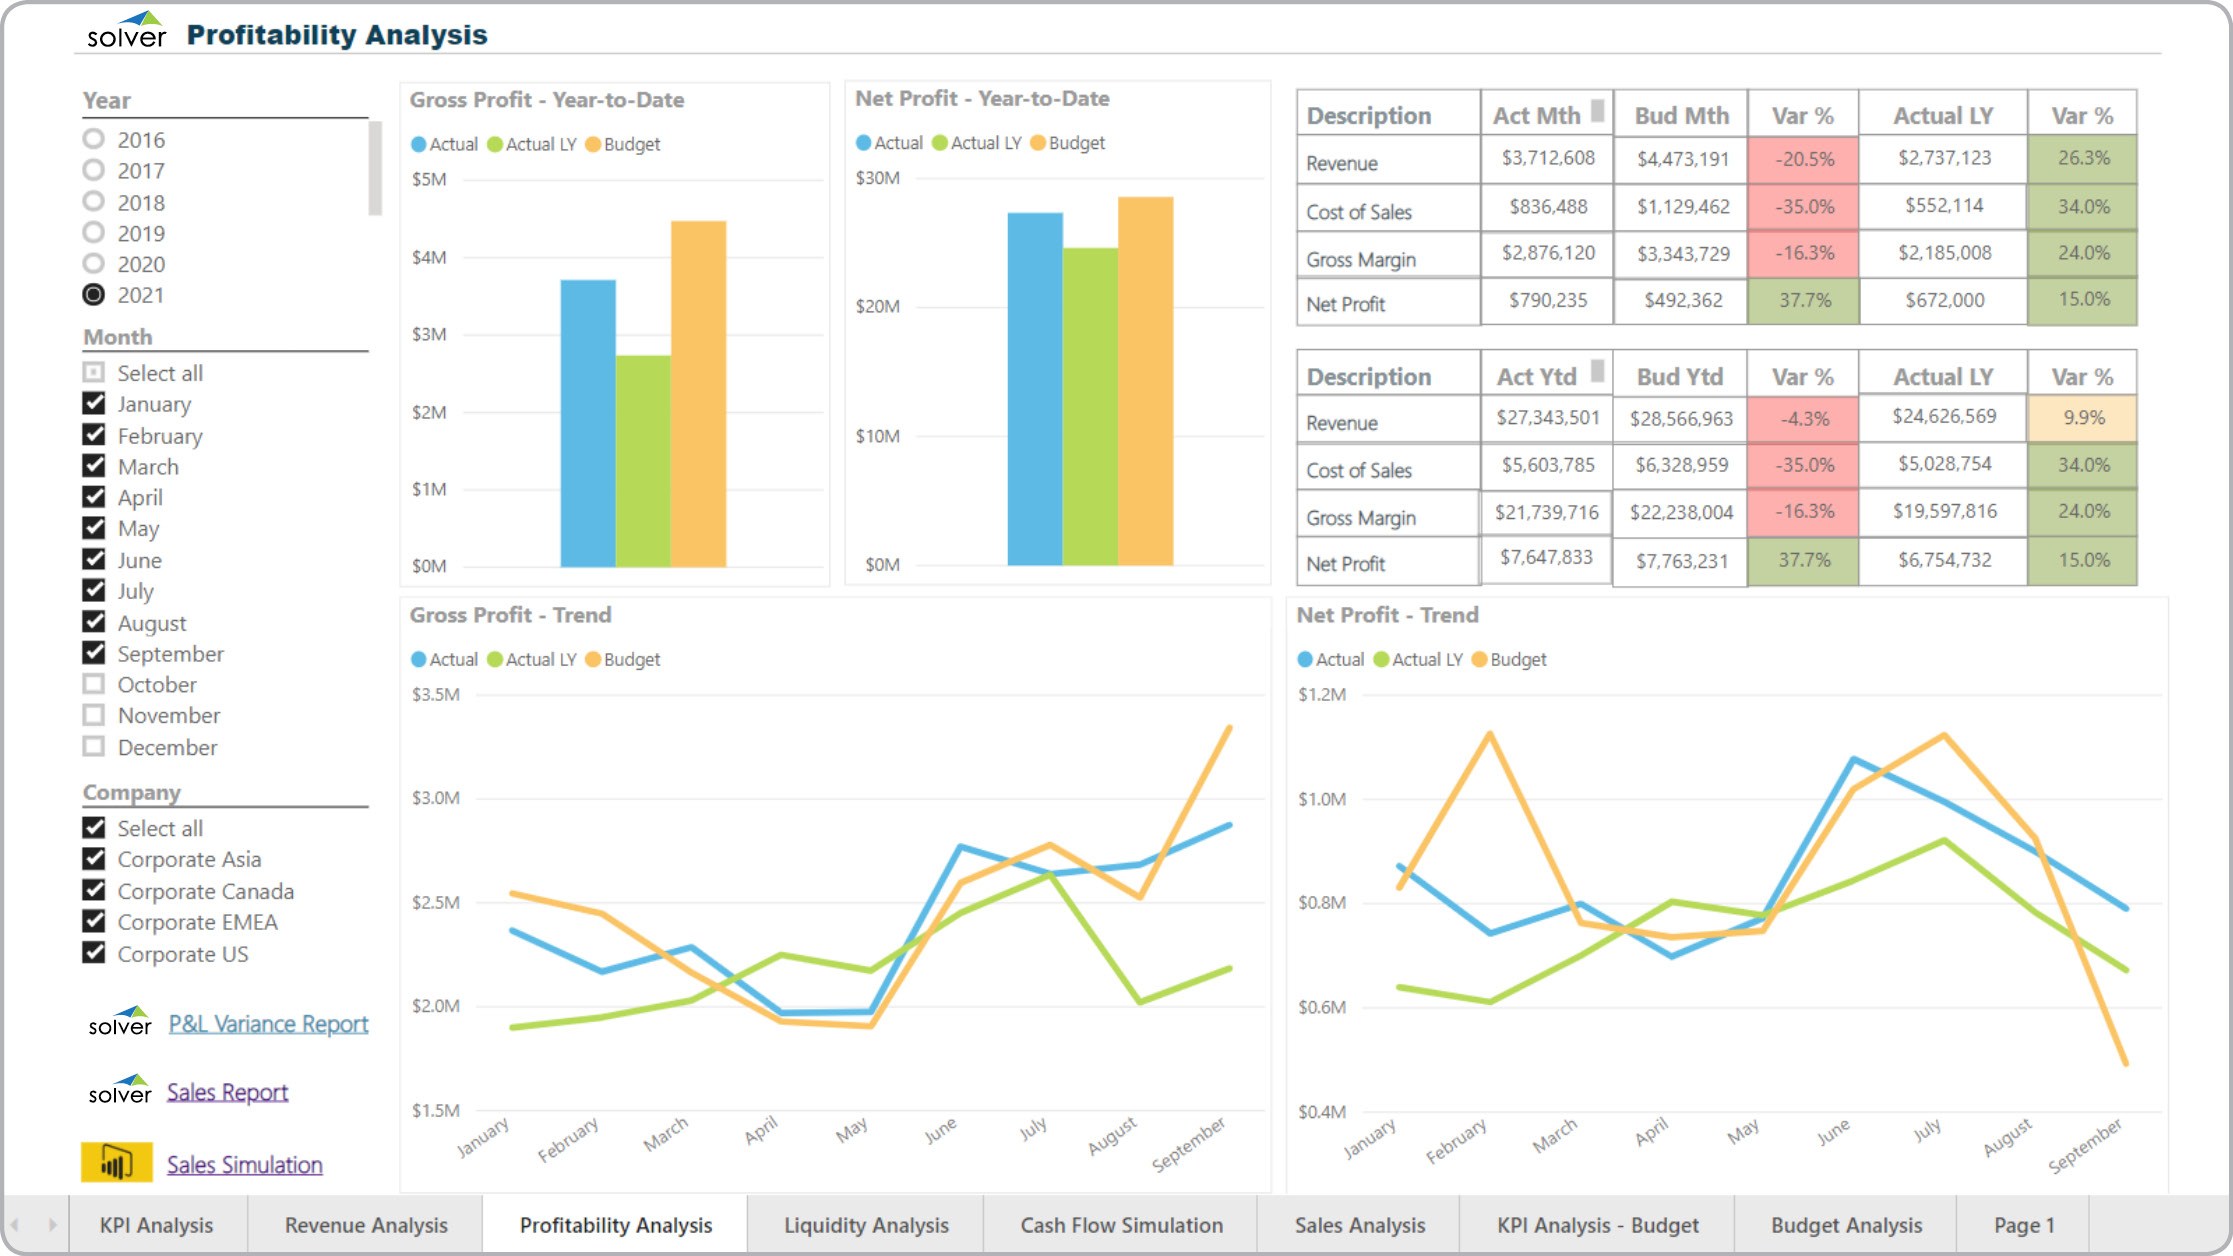
Profitability Dashboard
What is a Profitability Dashboard ? Profit-focused dashboards are considered financial ...
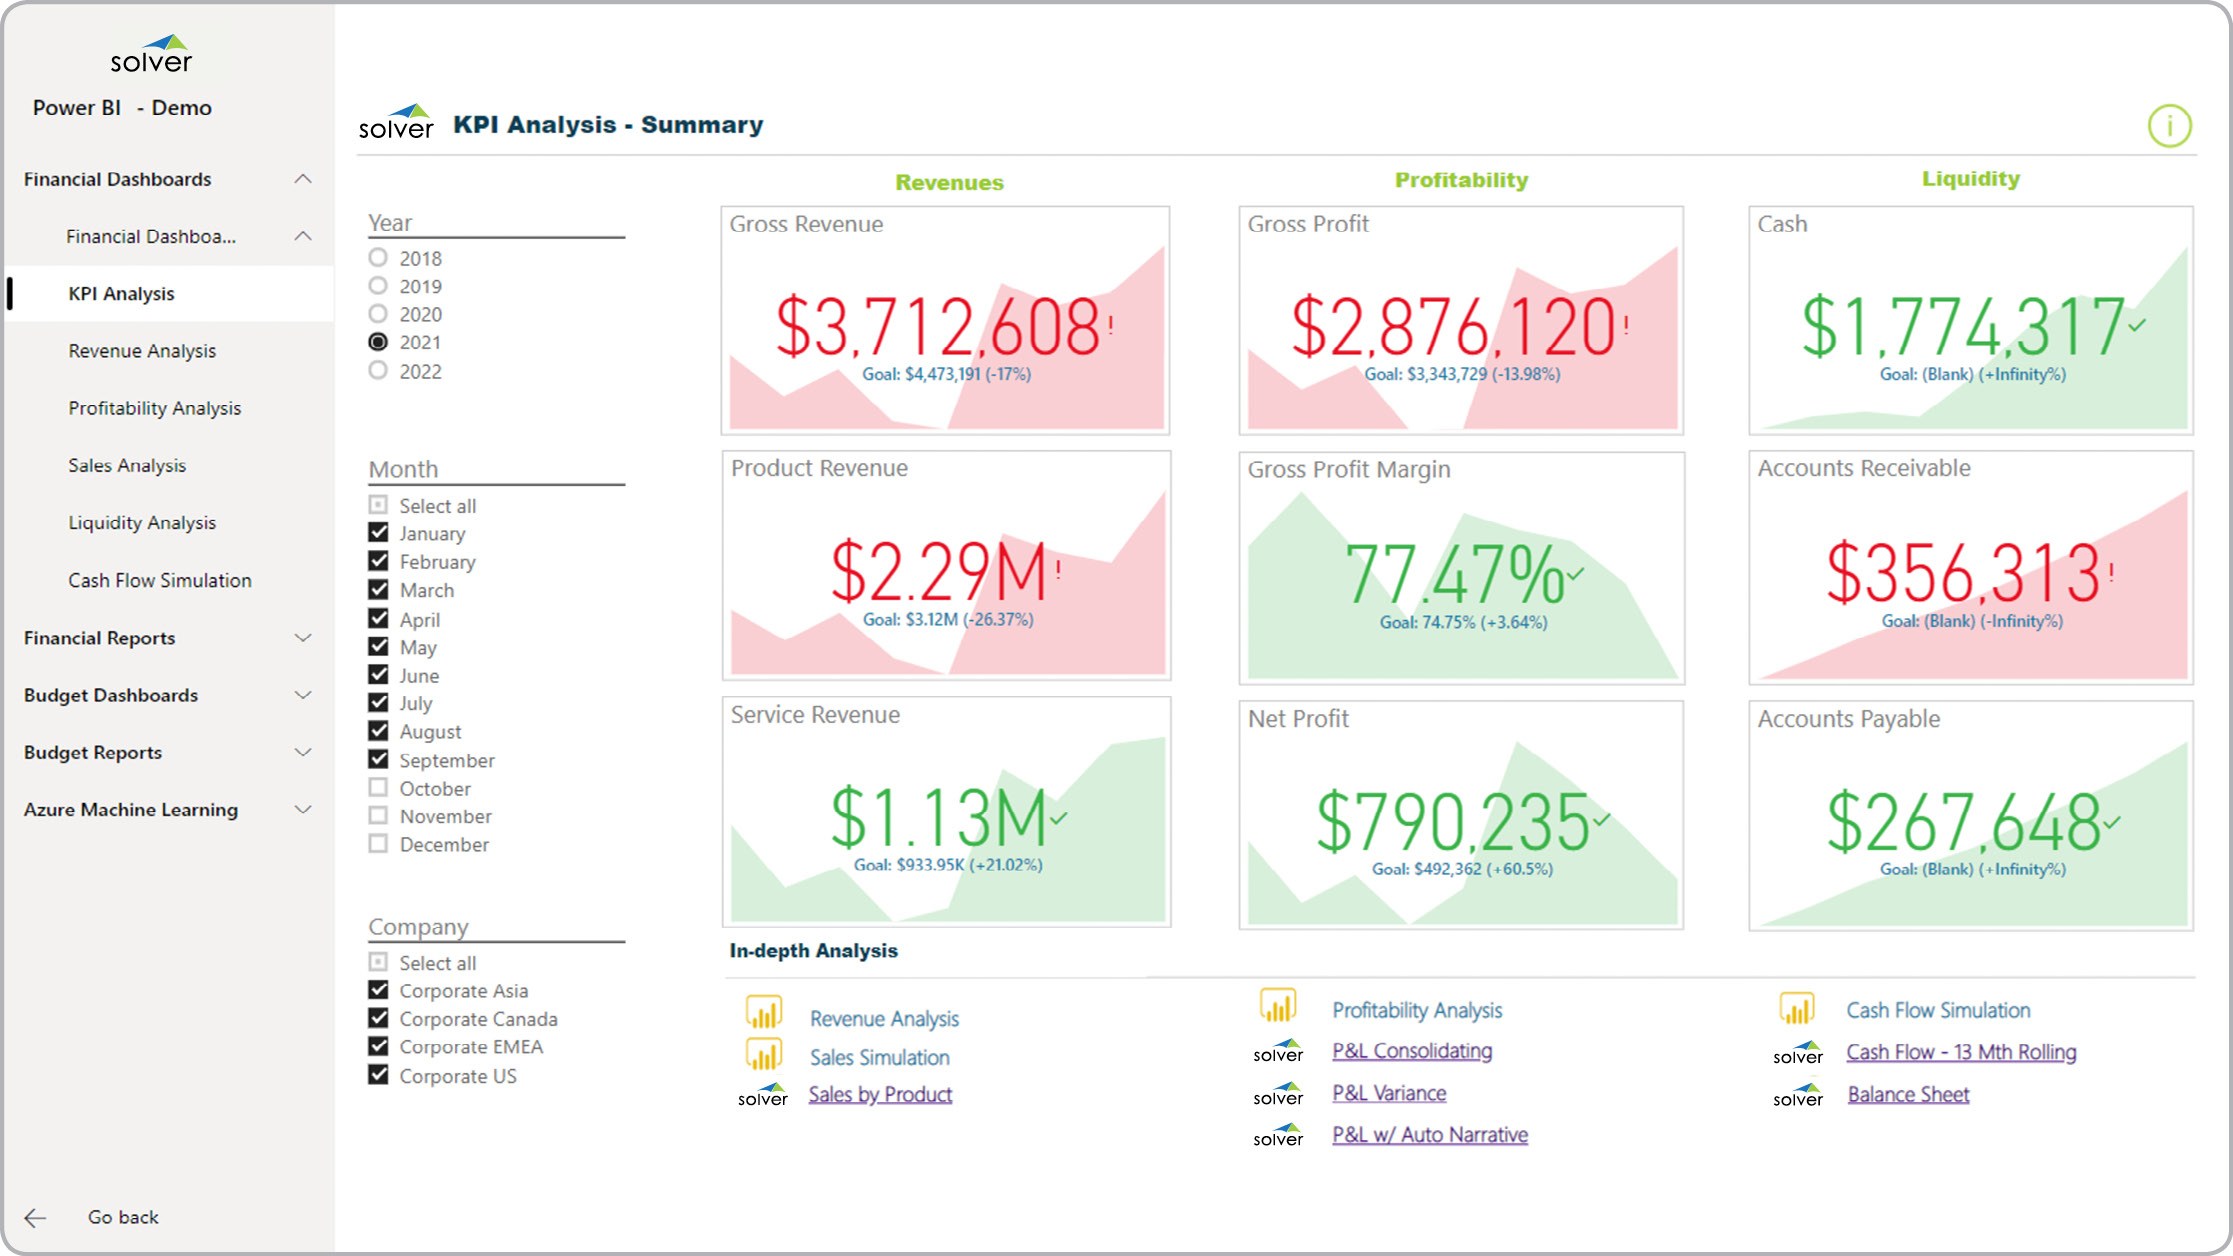
Financial KPI Dashboard
What is a Financial KPI Dashboard ? Financial Key Performance Indicator (KPI) Dashboards are ...
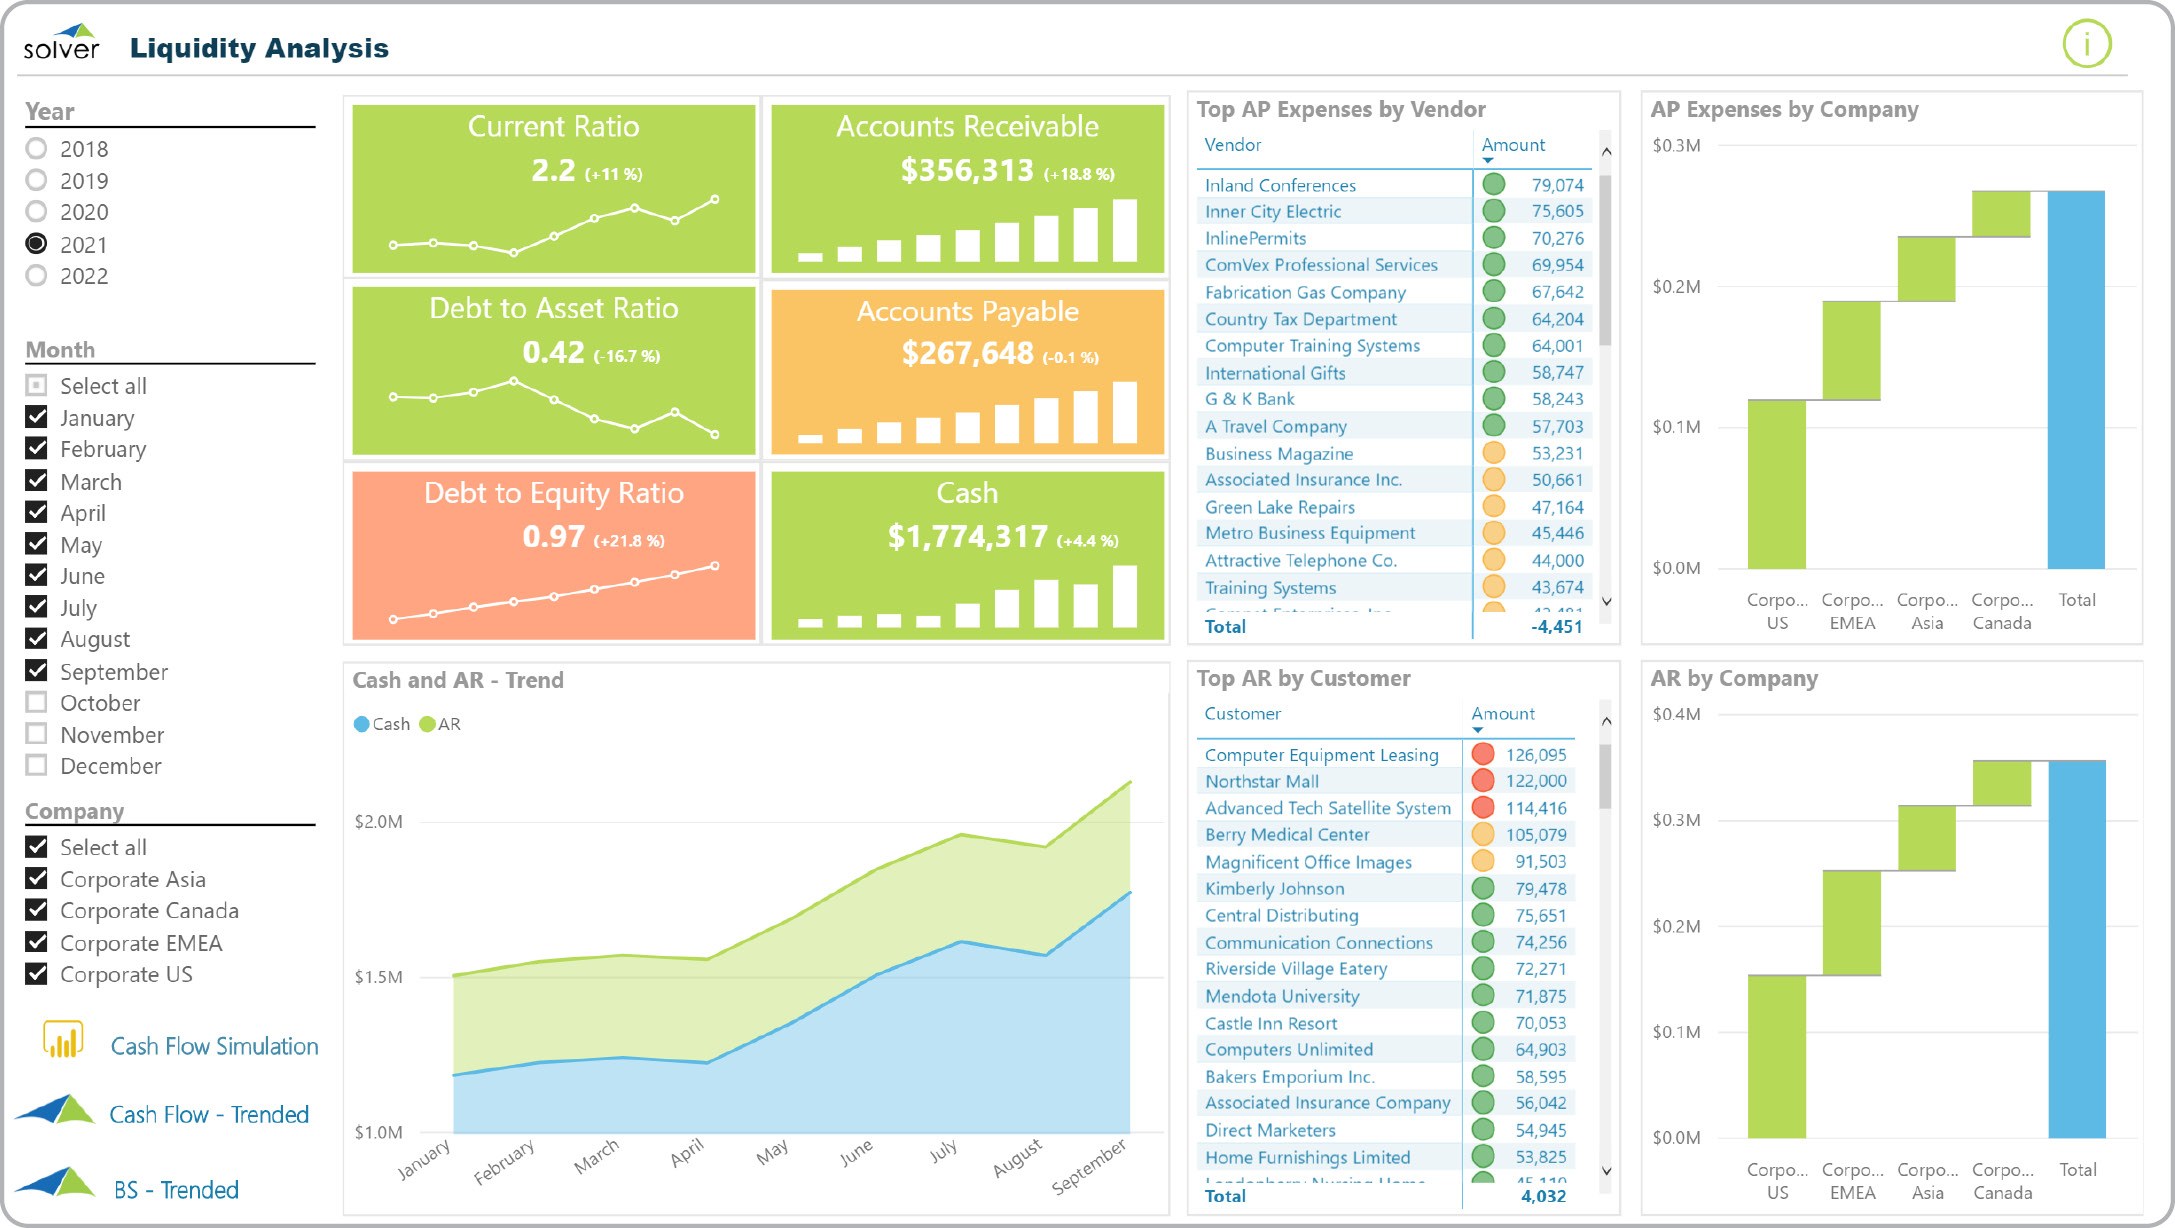
Liquidity Analysis Dashboard
What is a Liquidity Analysis Dashboard ? Liquidity visualization tools are considered financial ...
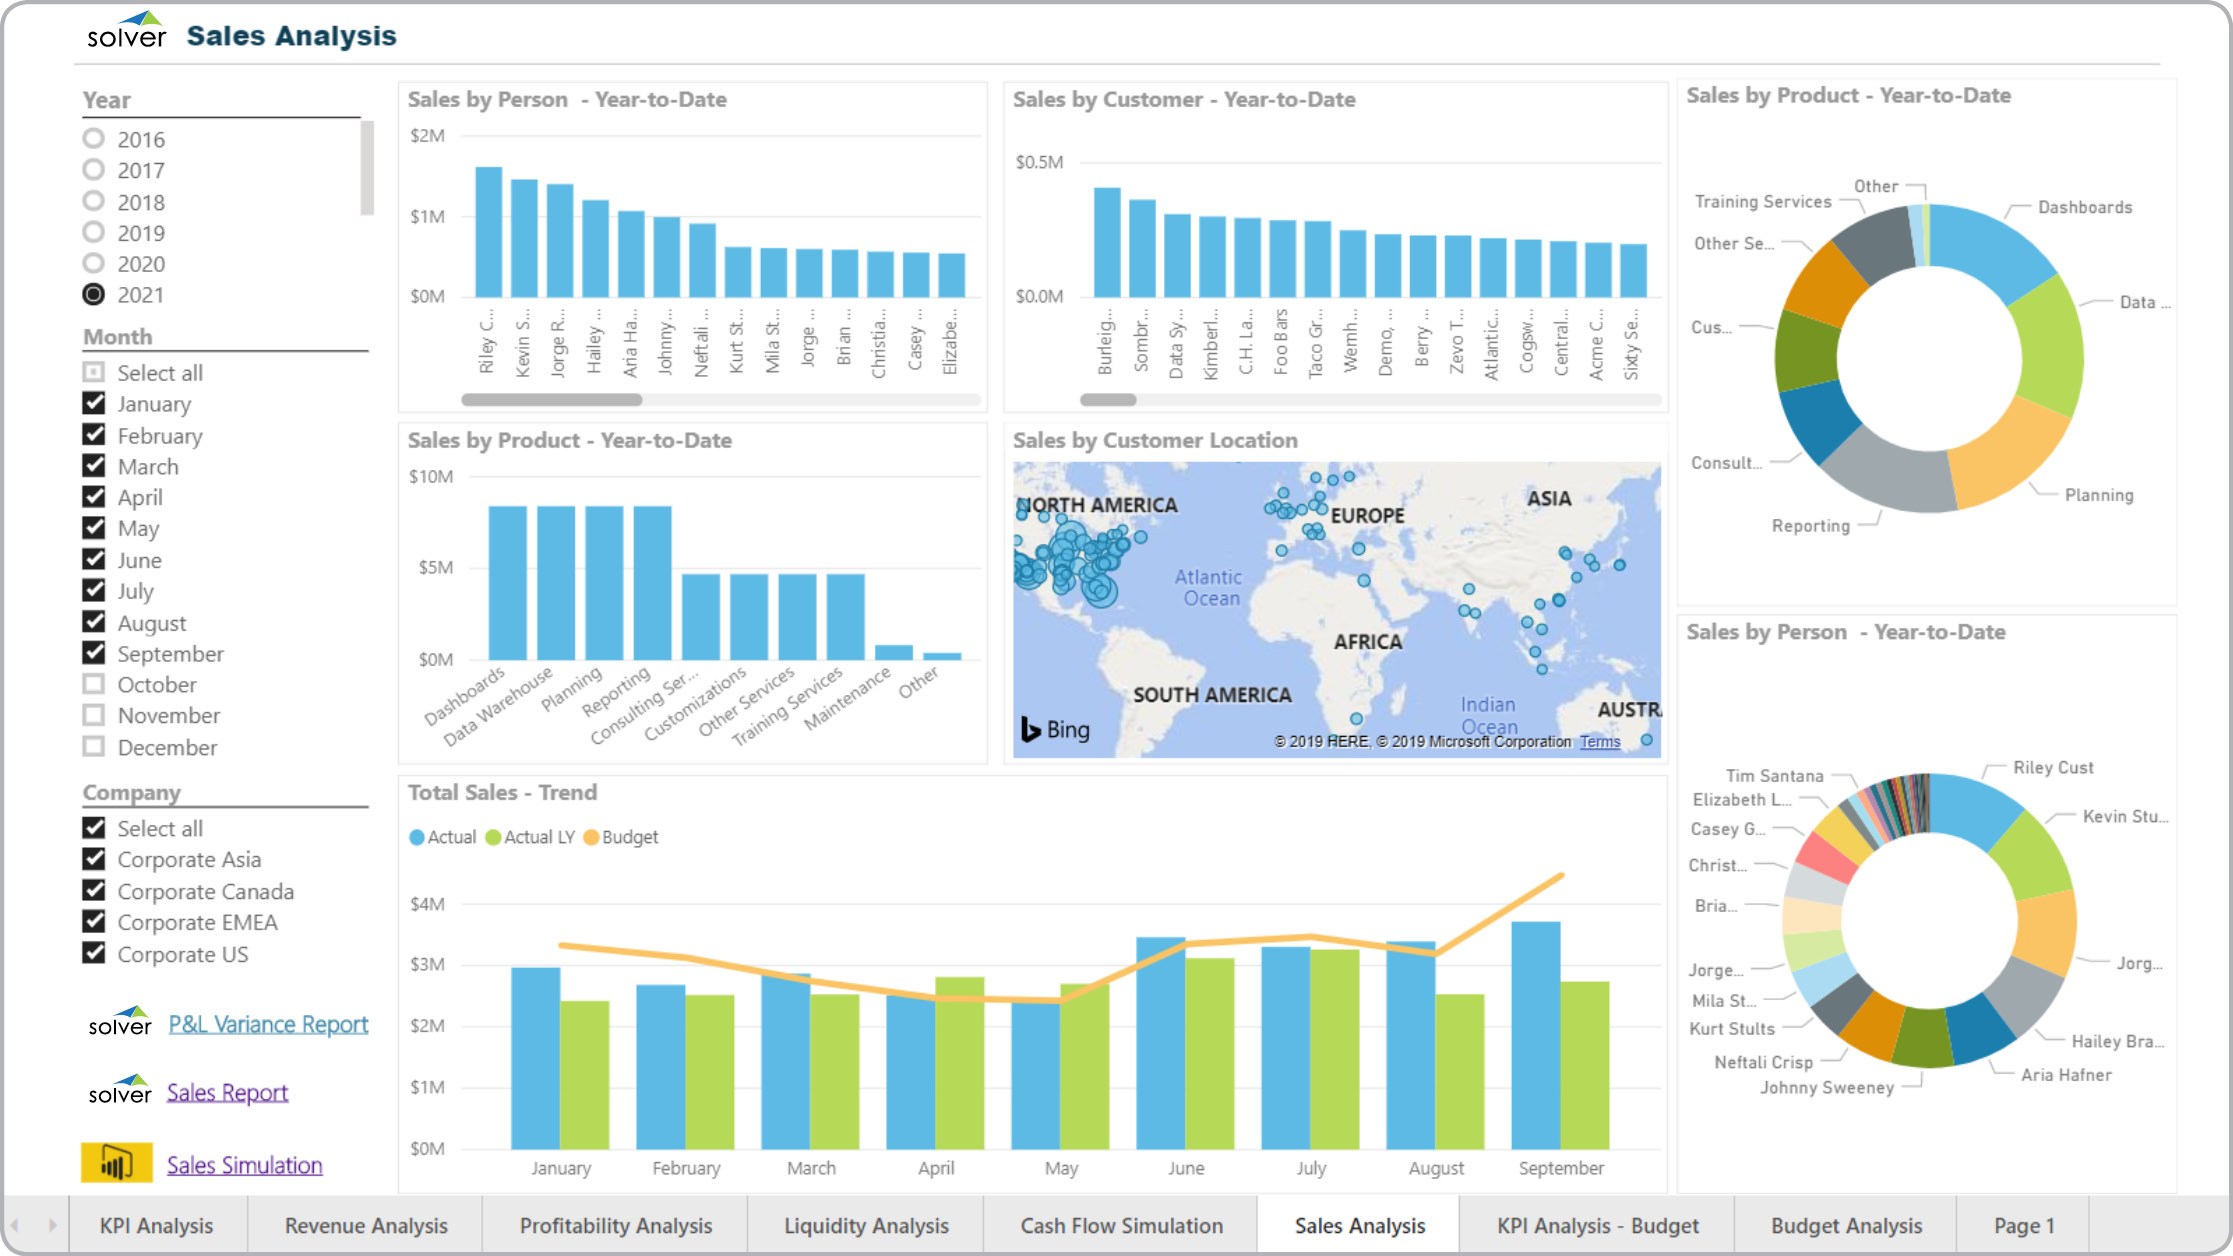
Sales Dashboard
What is a Sales Dashboard ? Sales visualization tools are considered operational dashboards and are ...
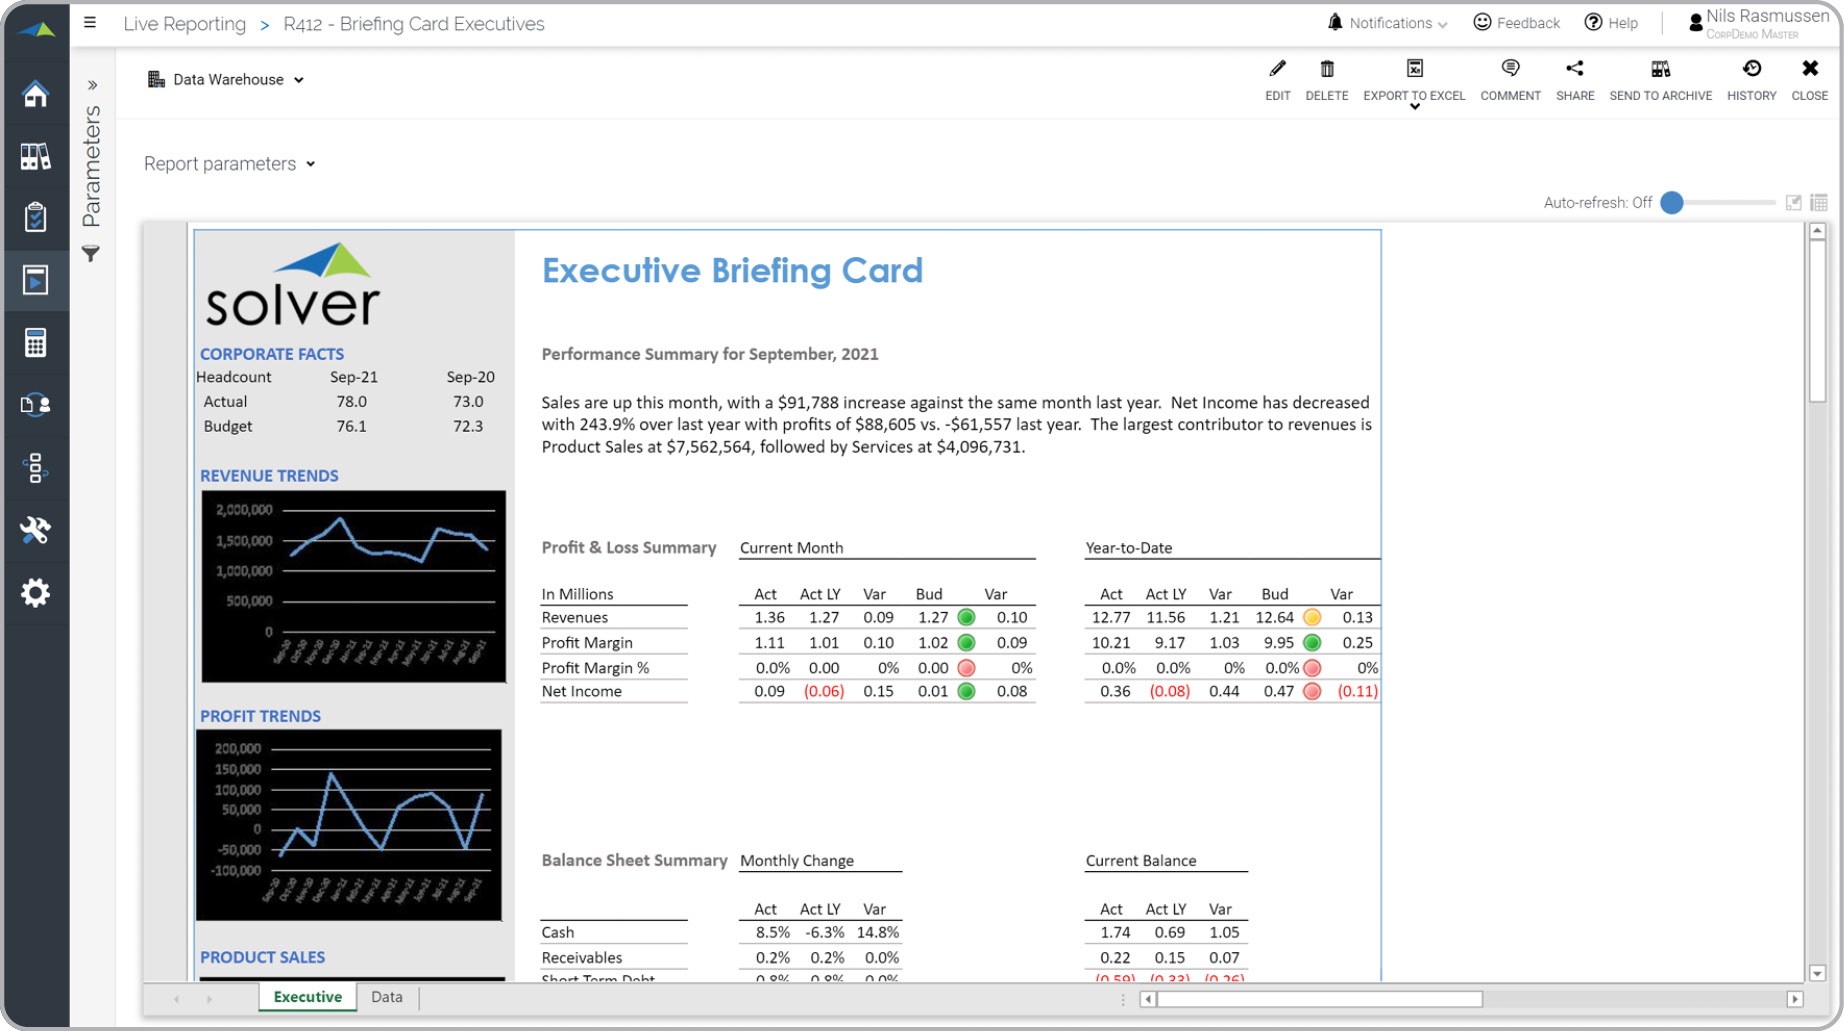
Executive Briefing Card Report
What is an Executive Briefing Card Report ? Executive Briefing Cards are considered monitoring ...
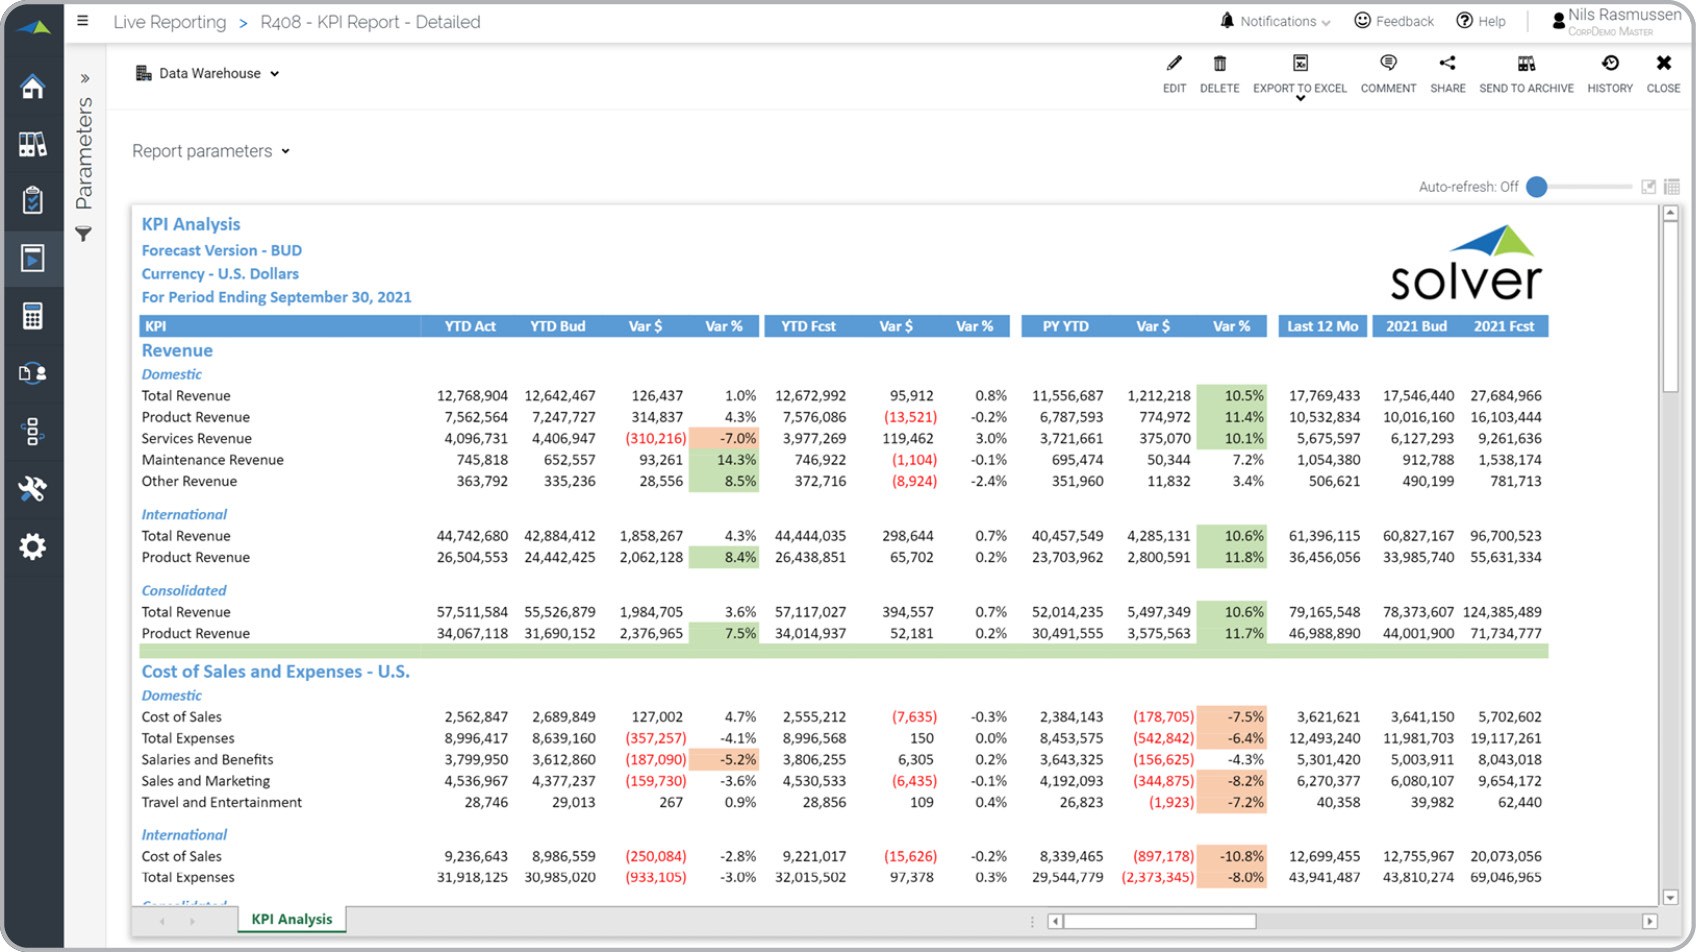
Detailed KPI Variance Report
What is a Detailed KPI Variance Report ? KPI reports are considered monitoring tools and are often ...
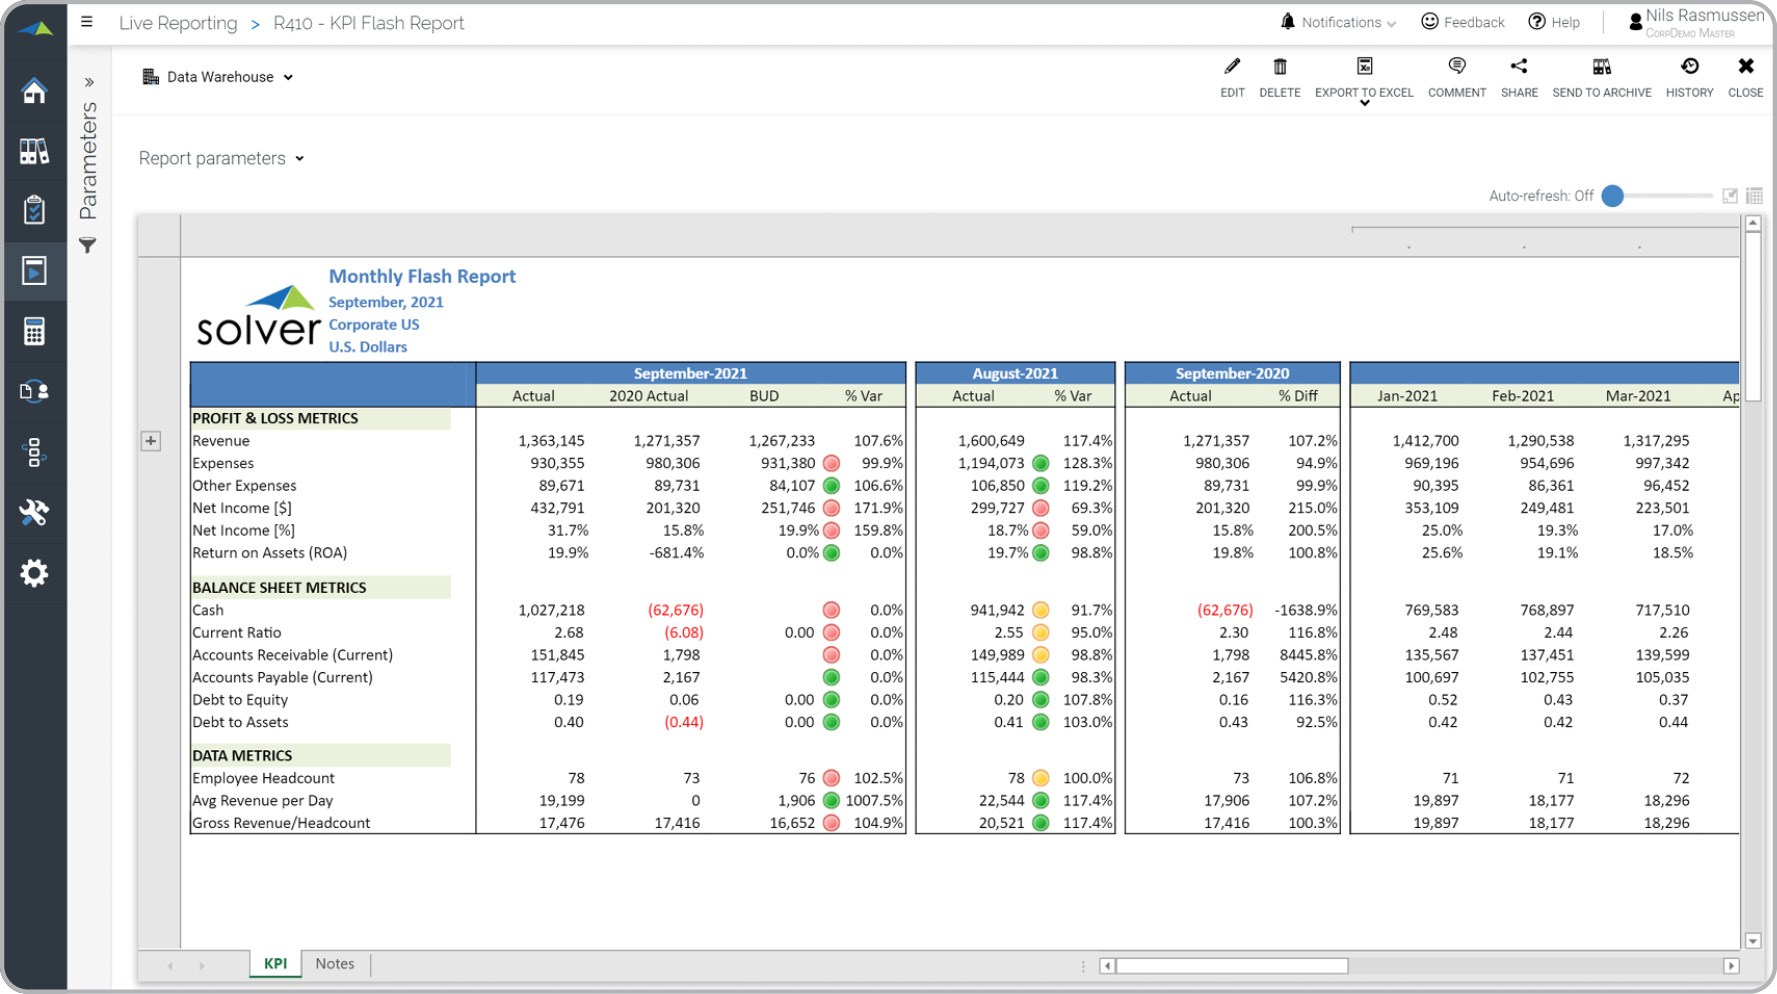
Monthly Flash Report
What is a Monthly Flash Report ? Flash Reports are considered management reports and are often used ...
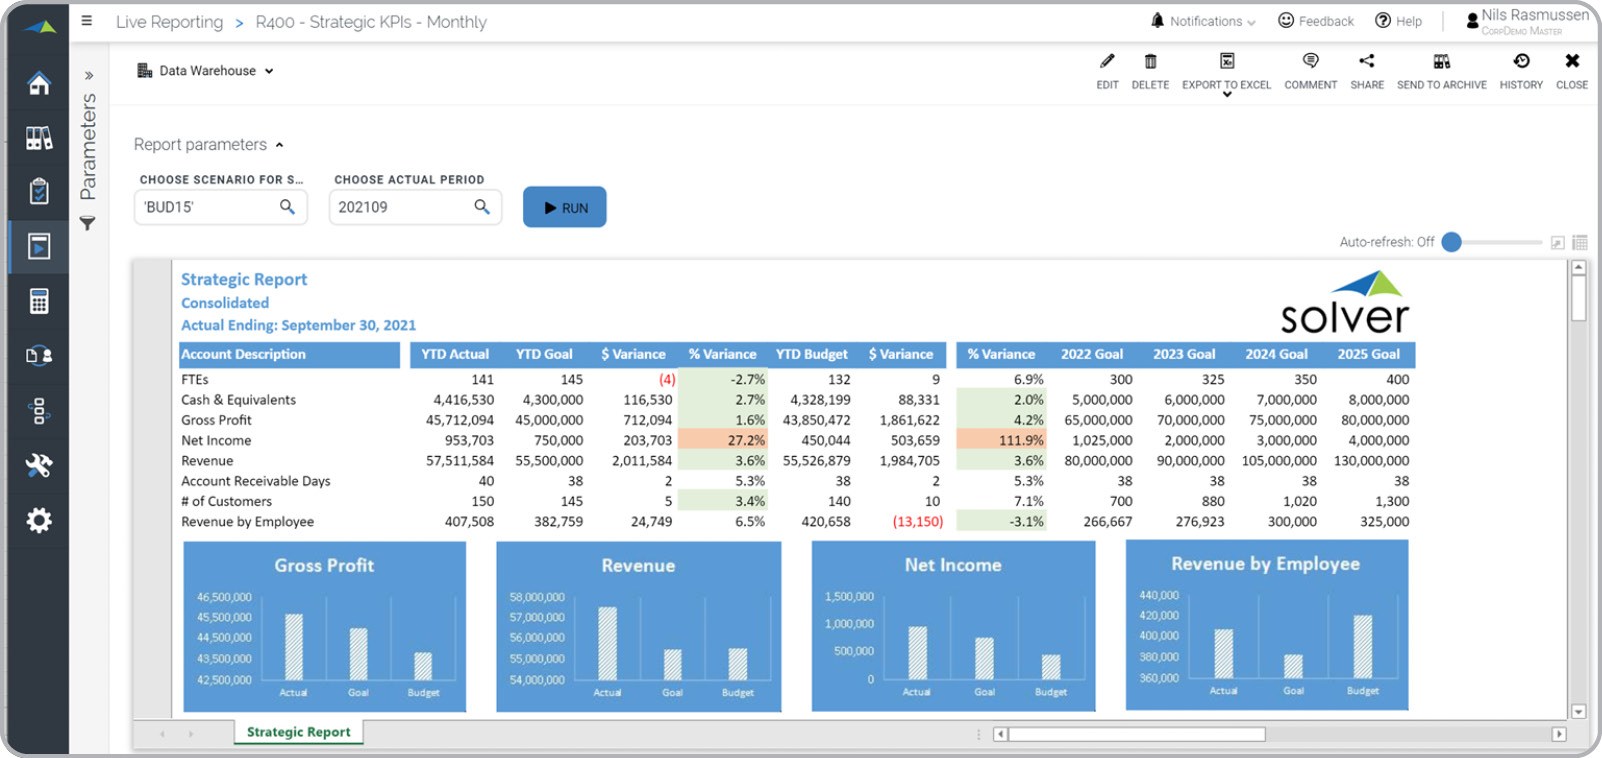
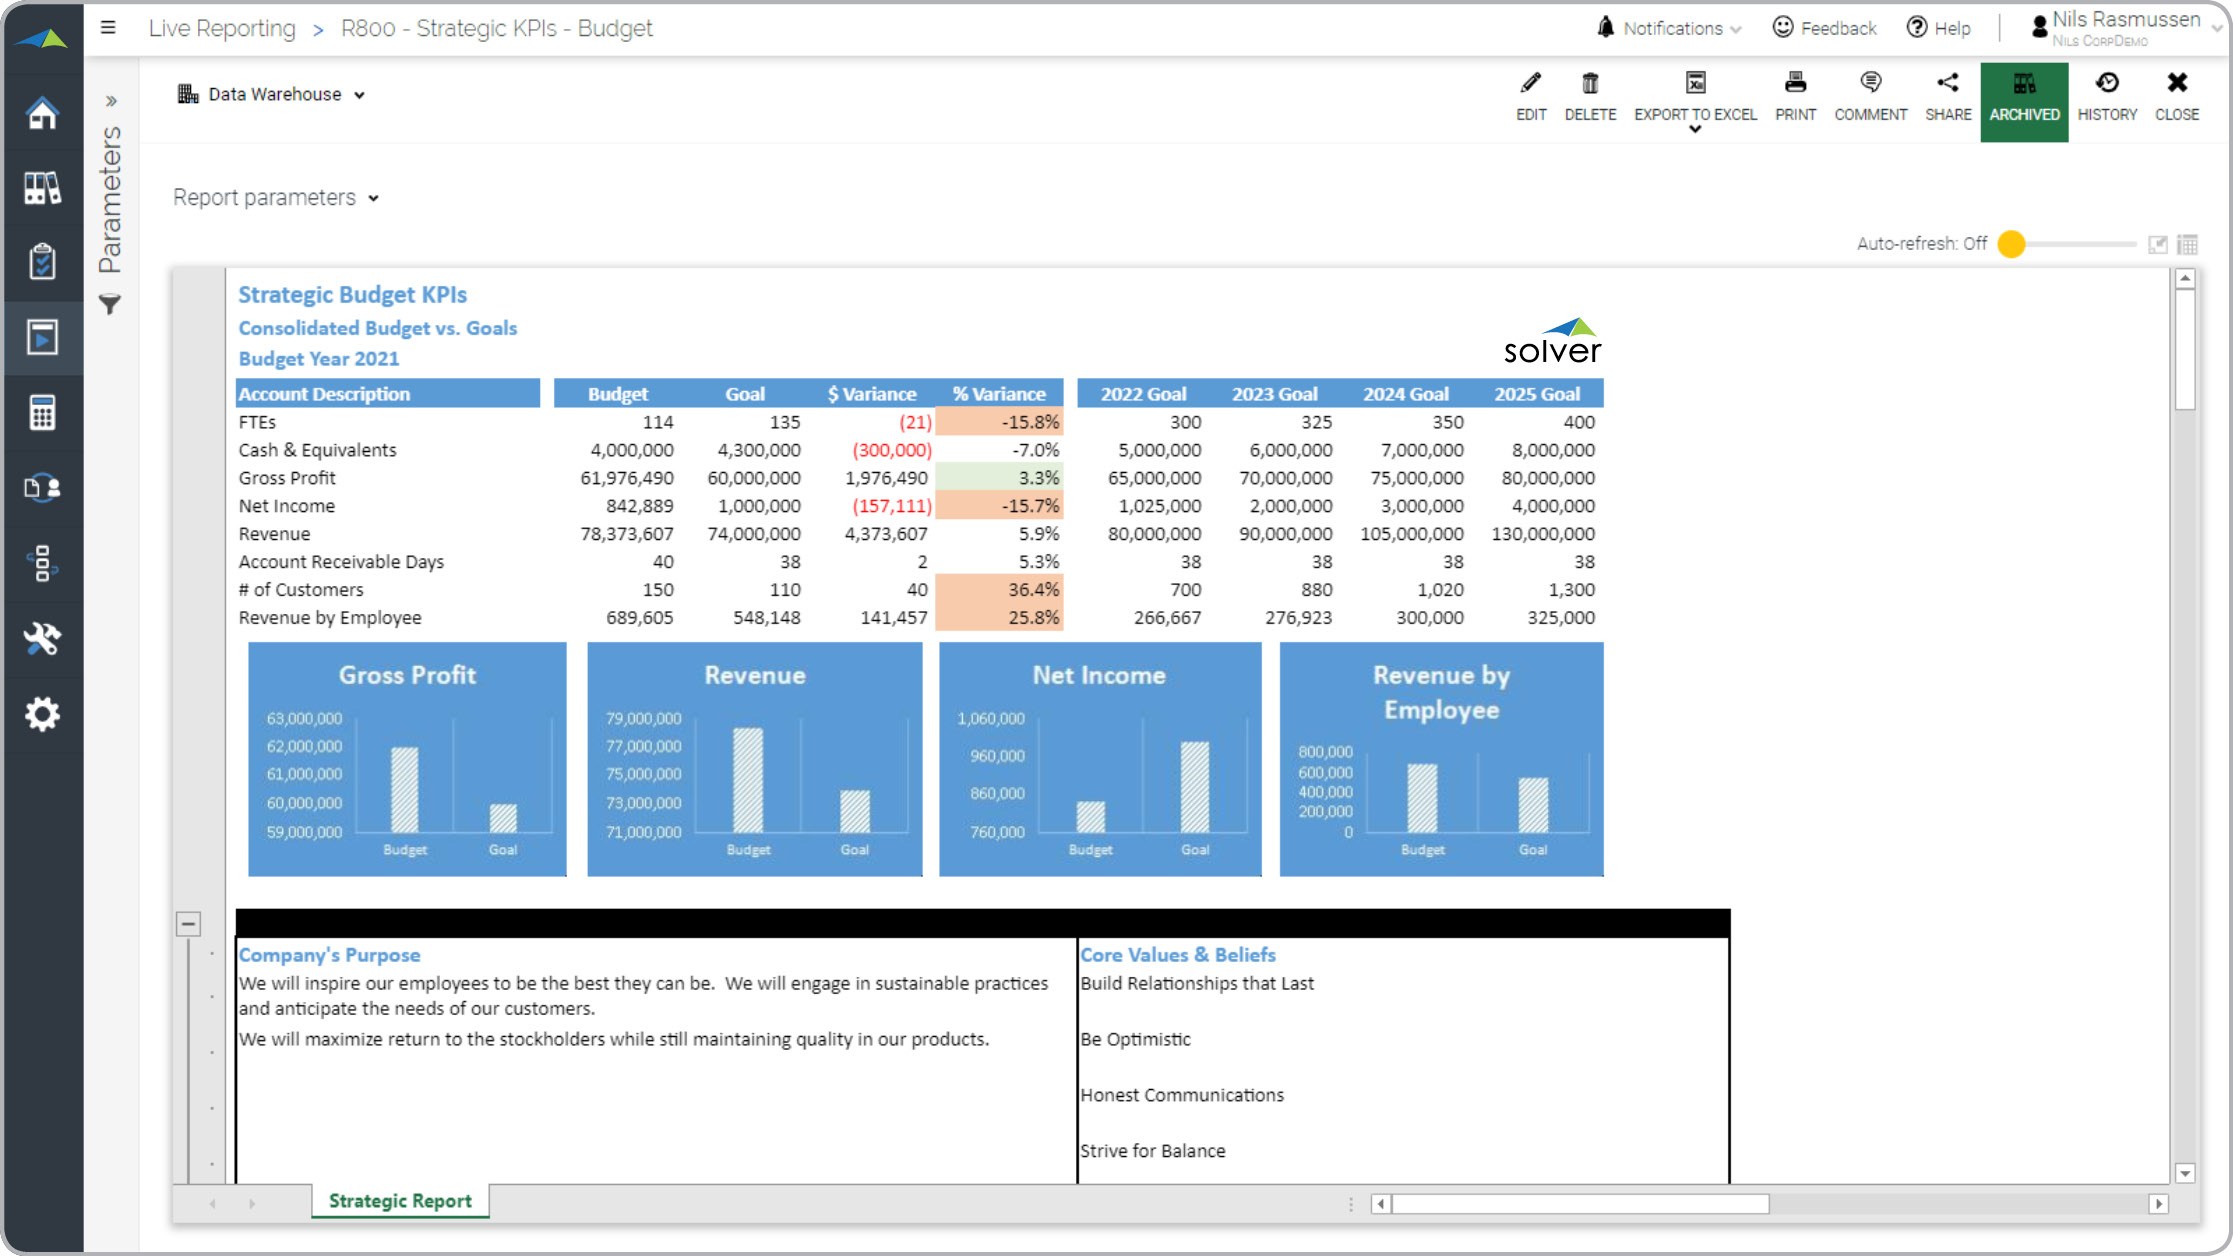
Strategic KPI Report
What is a Strategic KPI Report ? Strategic KPI reports are considered executive dashboards and are ...
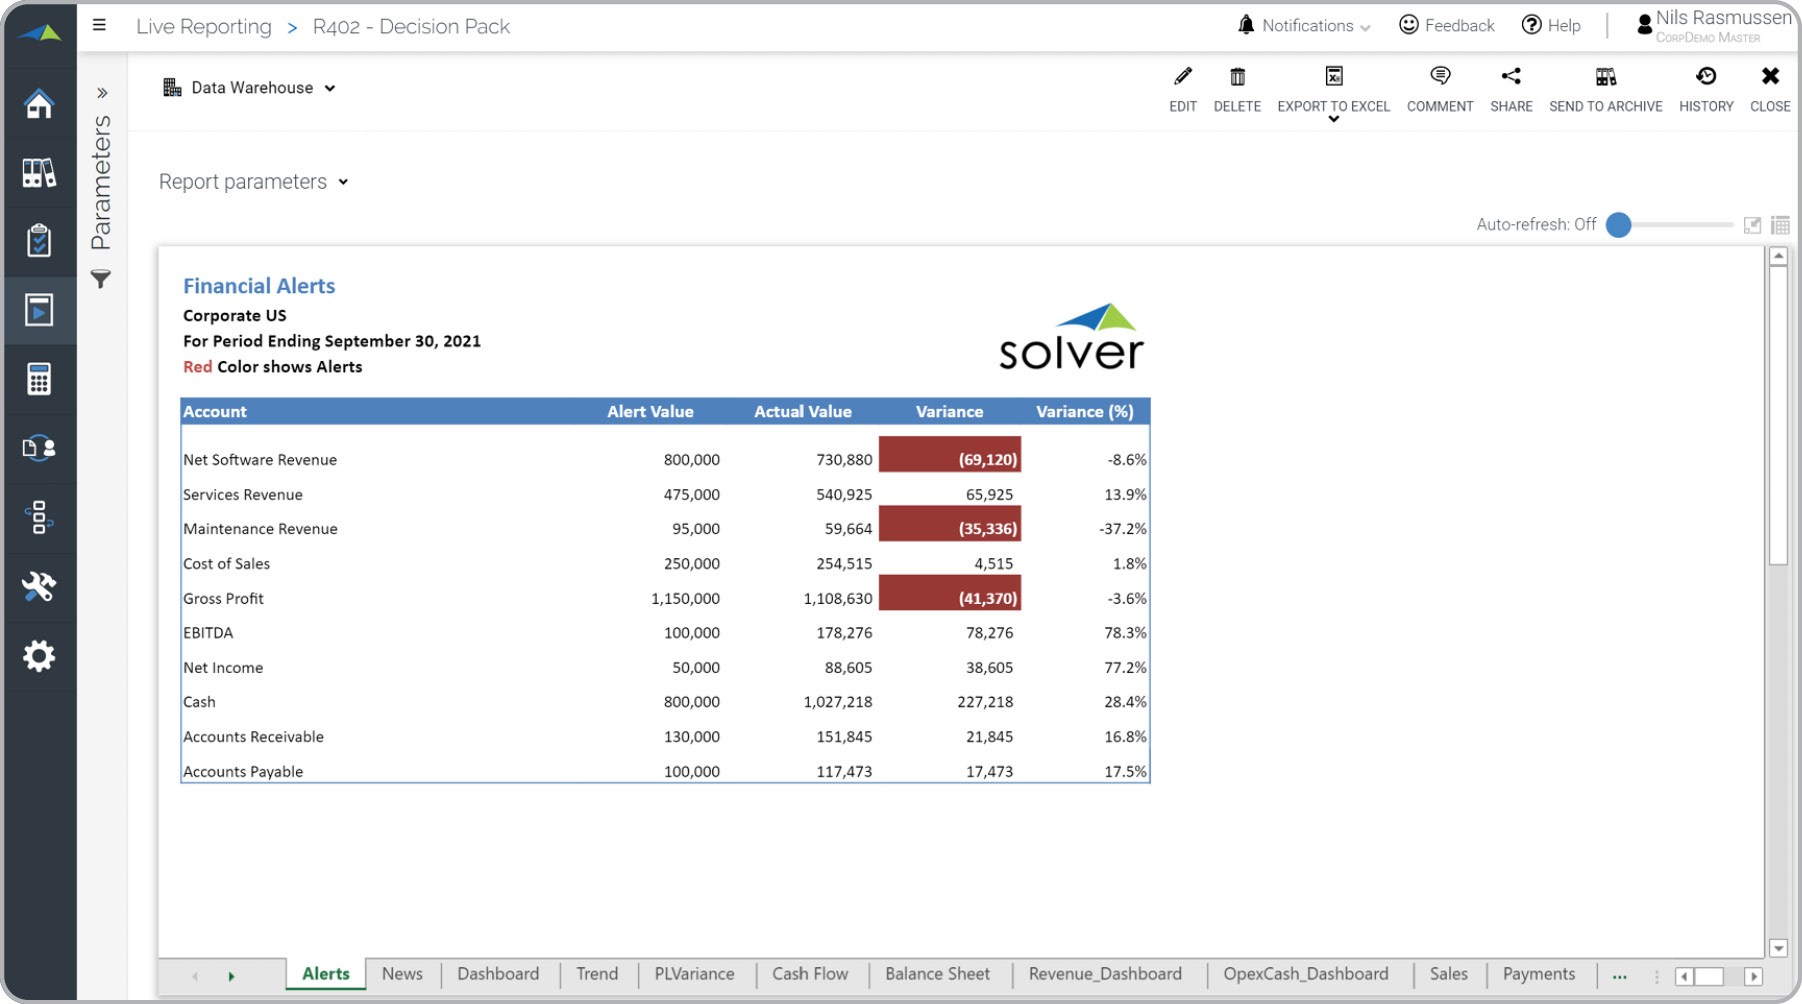
KPI Alert Report
What is a KPI Alert Report ? KPI Alert Reports are considered exception reports and are often used ...
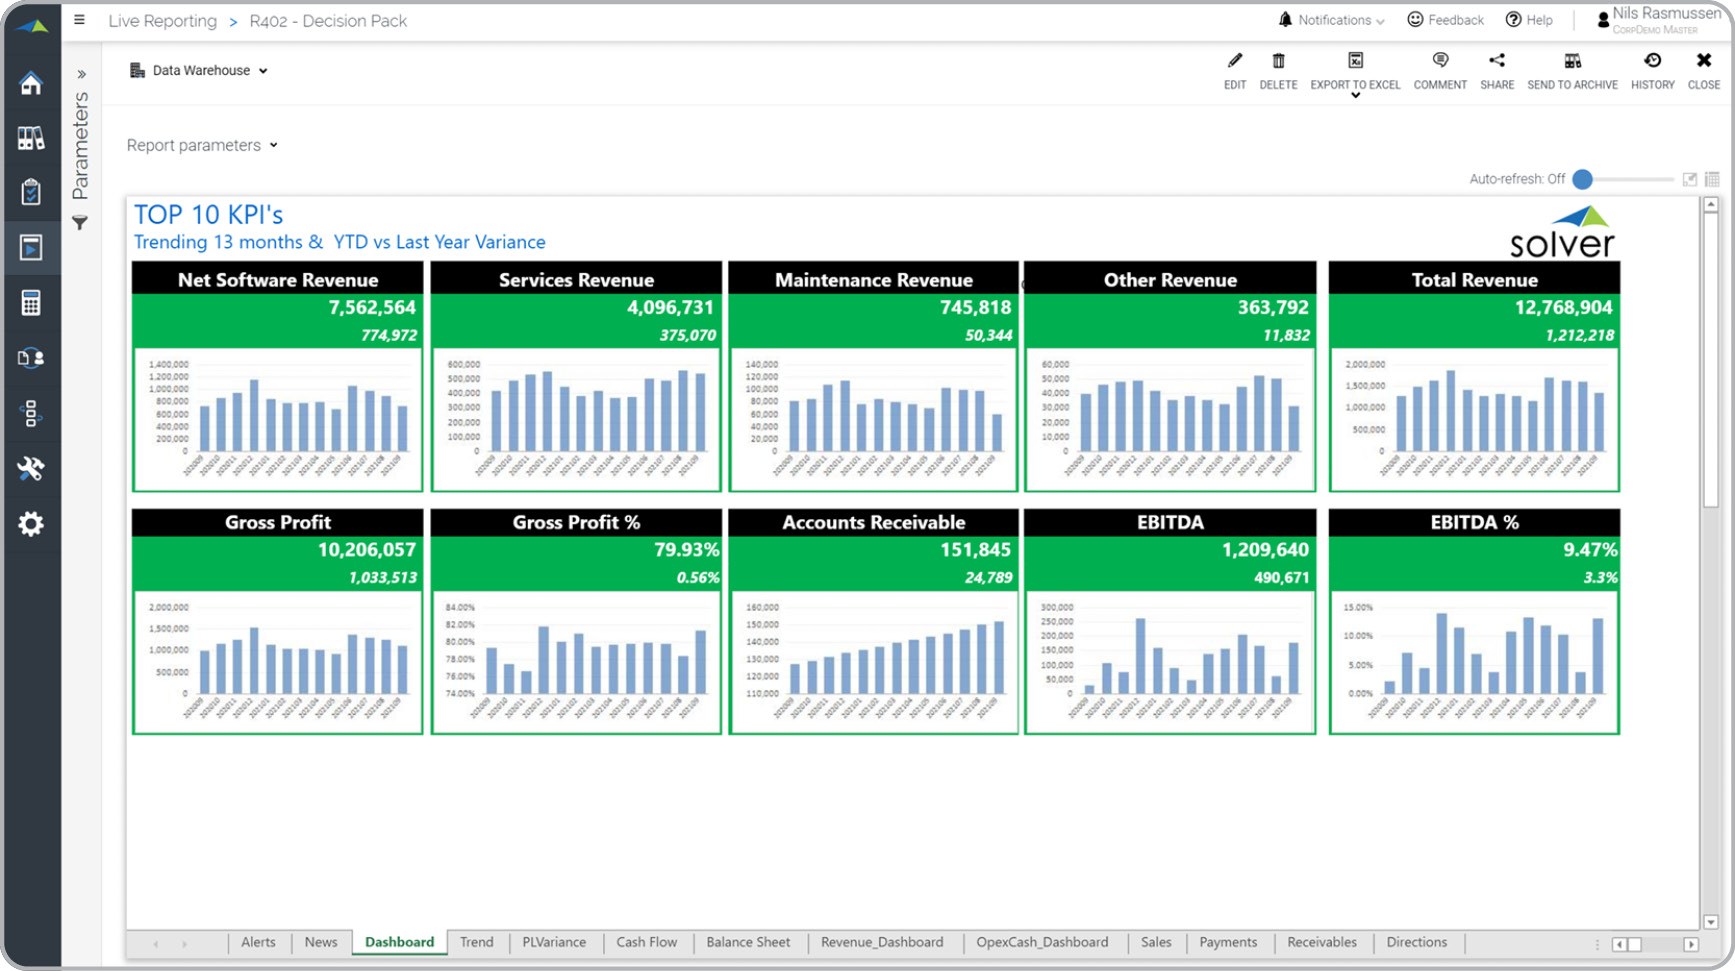
Top 10 KPI Report with 13 Month Rolling Trend Analysis
What is a Top 10 KPI Report with 13 Month Rolling Trend Analysis ? Top KPI trend reports are ...
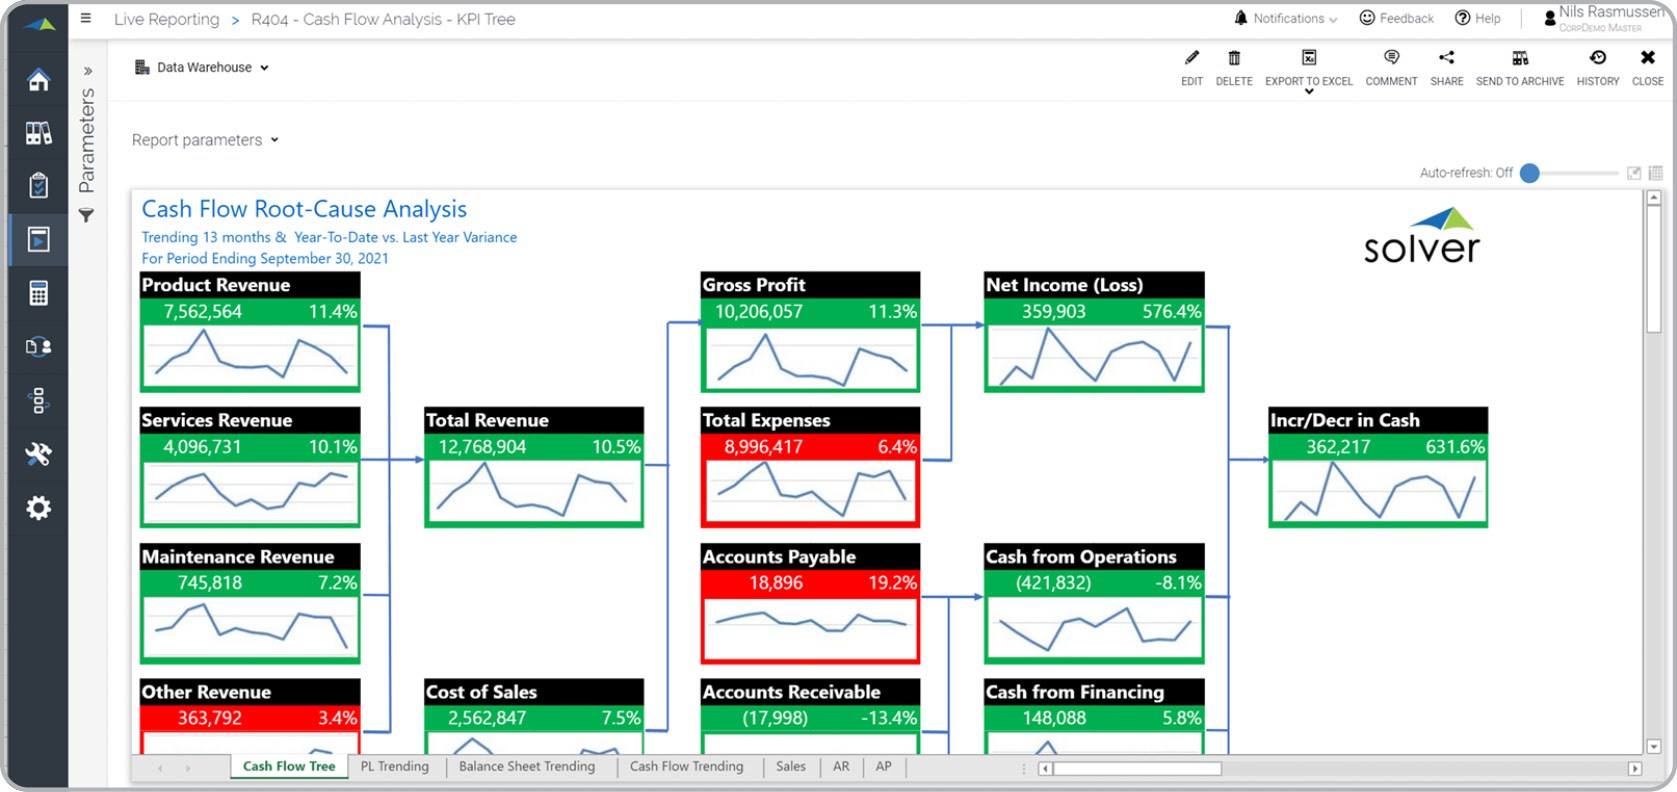
Graphical Cash Flow Analysis Tool and Dashboard Report
What is a Graphical Cash Flow Analysis Tool and Dashboard Report ? Cash Flow Analysis tools are ...
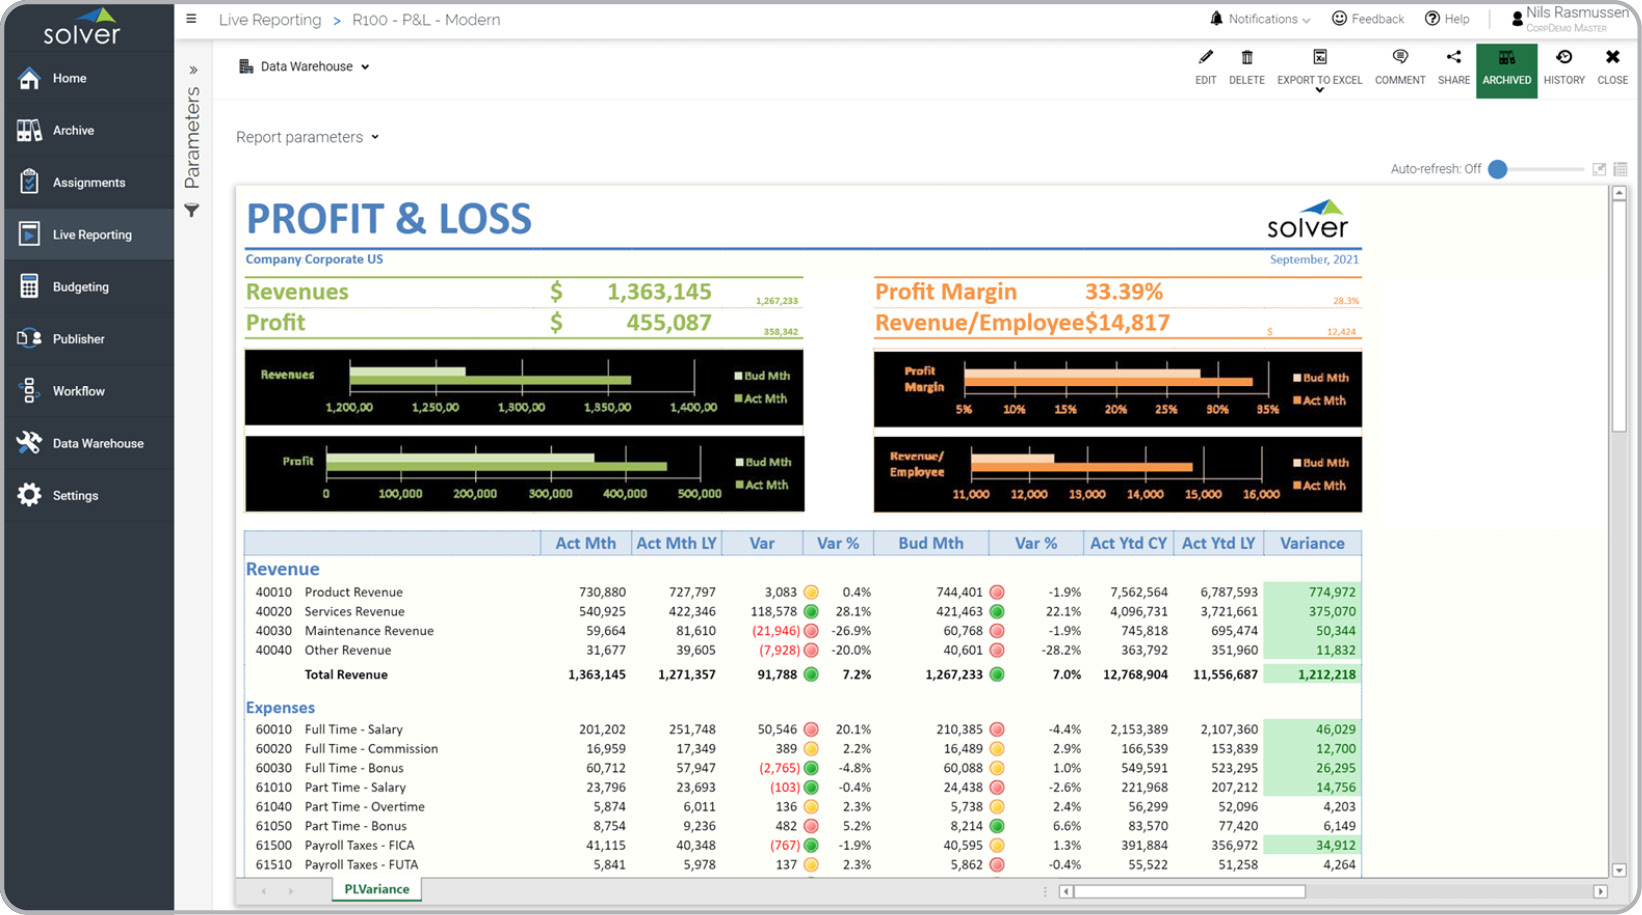
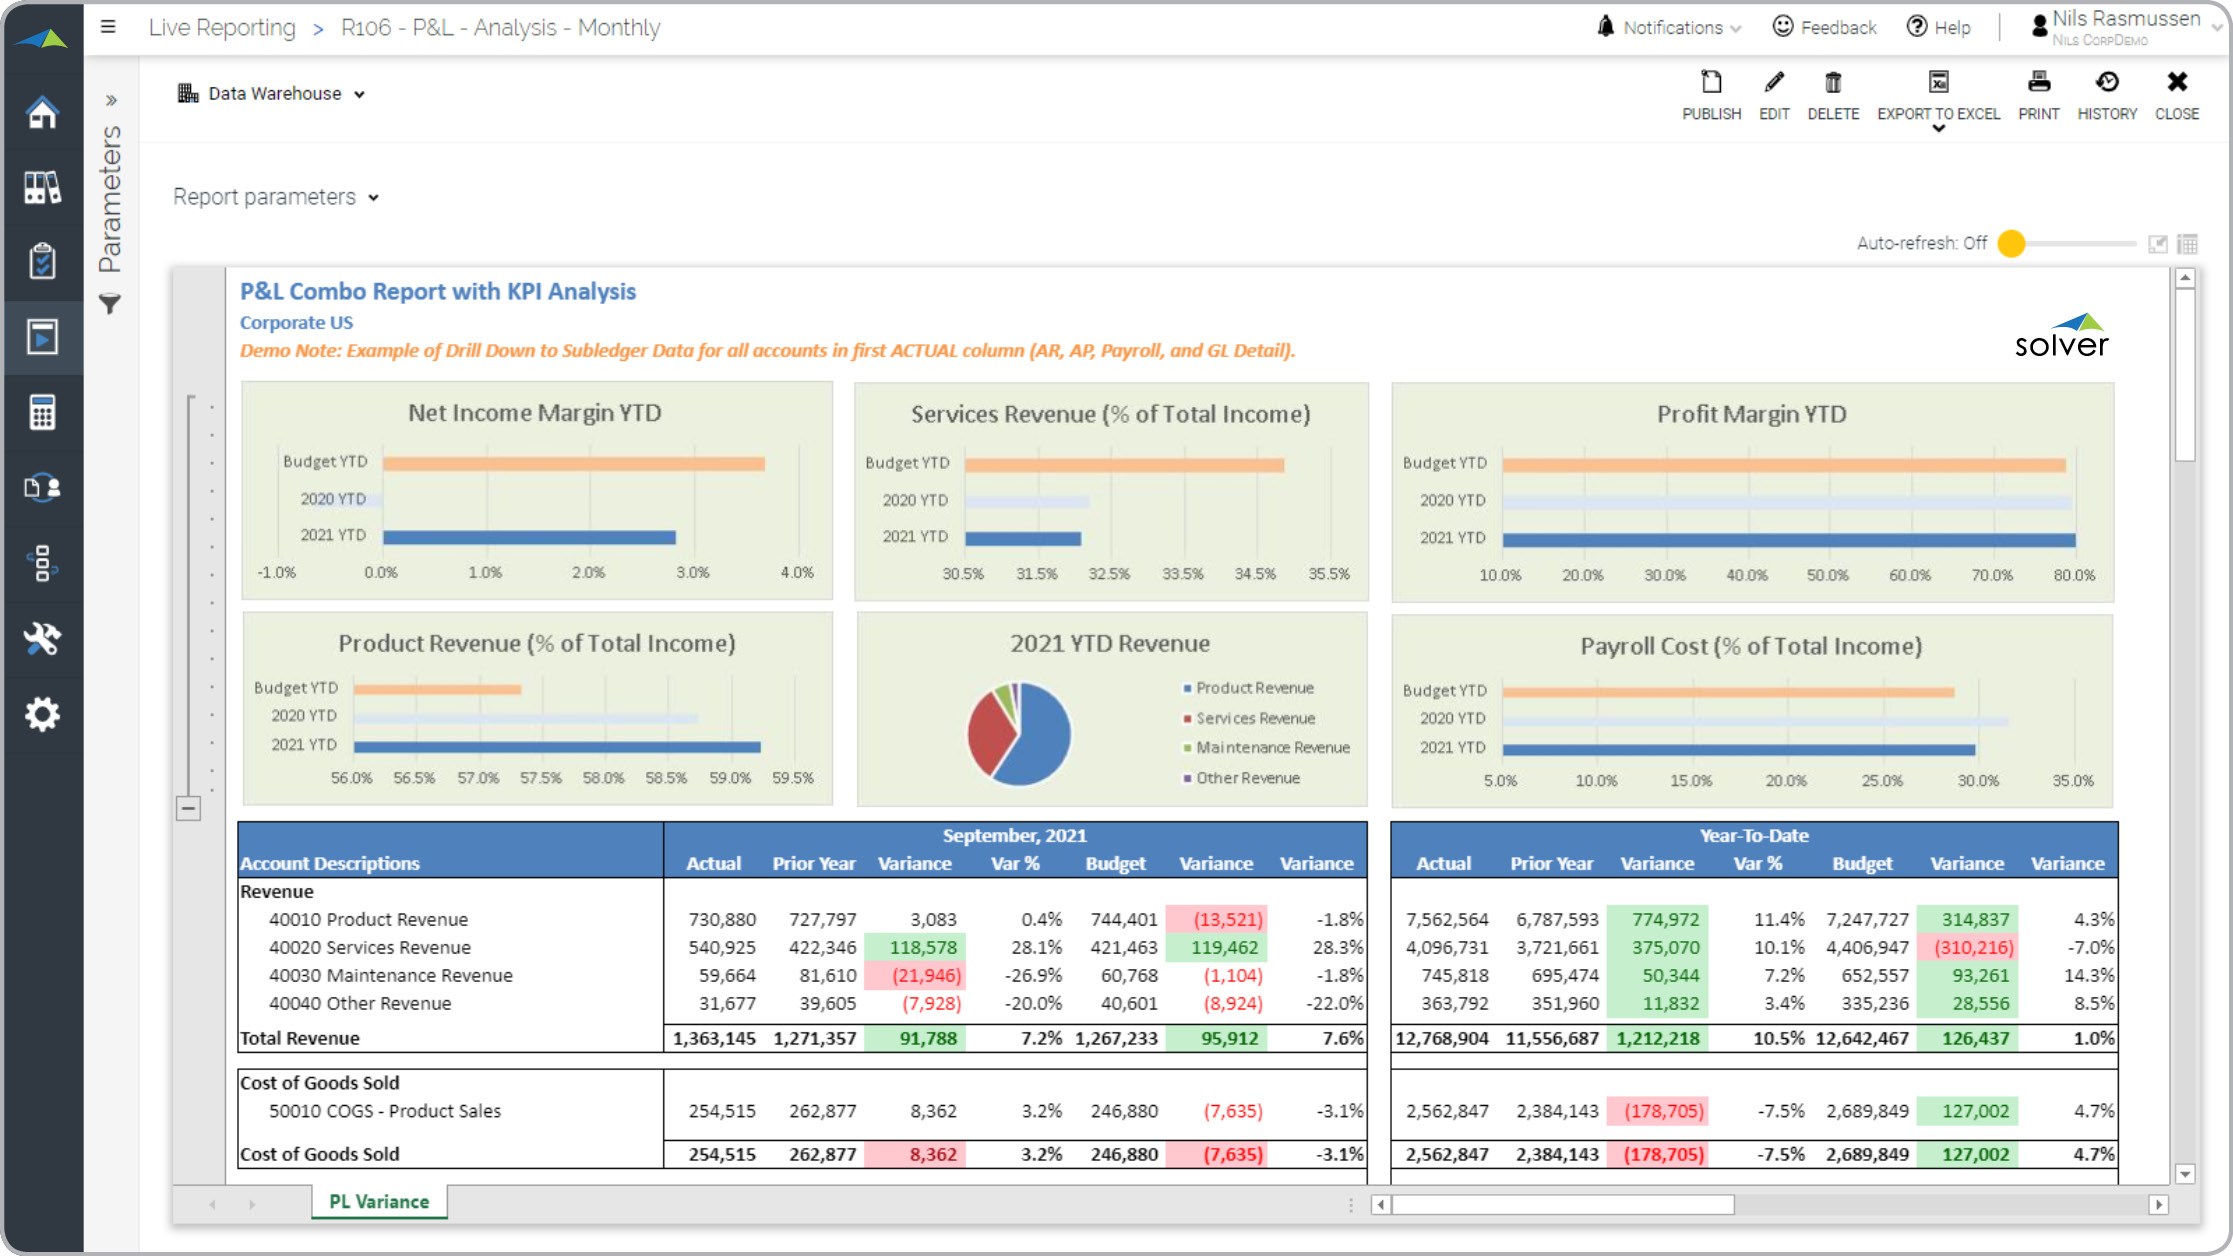
Profit & Loss Report with Charts and Modern Layout
What is a Profit & Loss Report with Charts and Modern Layout ? Modern Profit & Loss Reports ...
Profit & Loss Variance Report
What is a Profit & Loss Variance Report ? Profit & Loss Variance Reports are considered a ...
Annual Budget KPI Report
What is an Annual Budget KPI Report ? Budget Key Performance Indicator (KPI) reports are considered ...
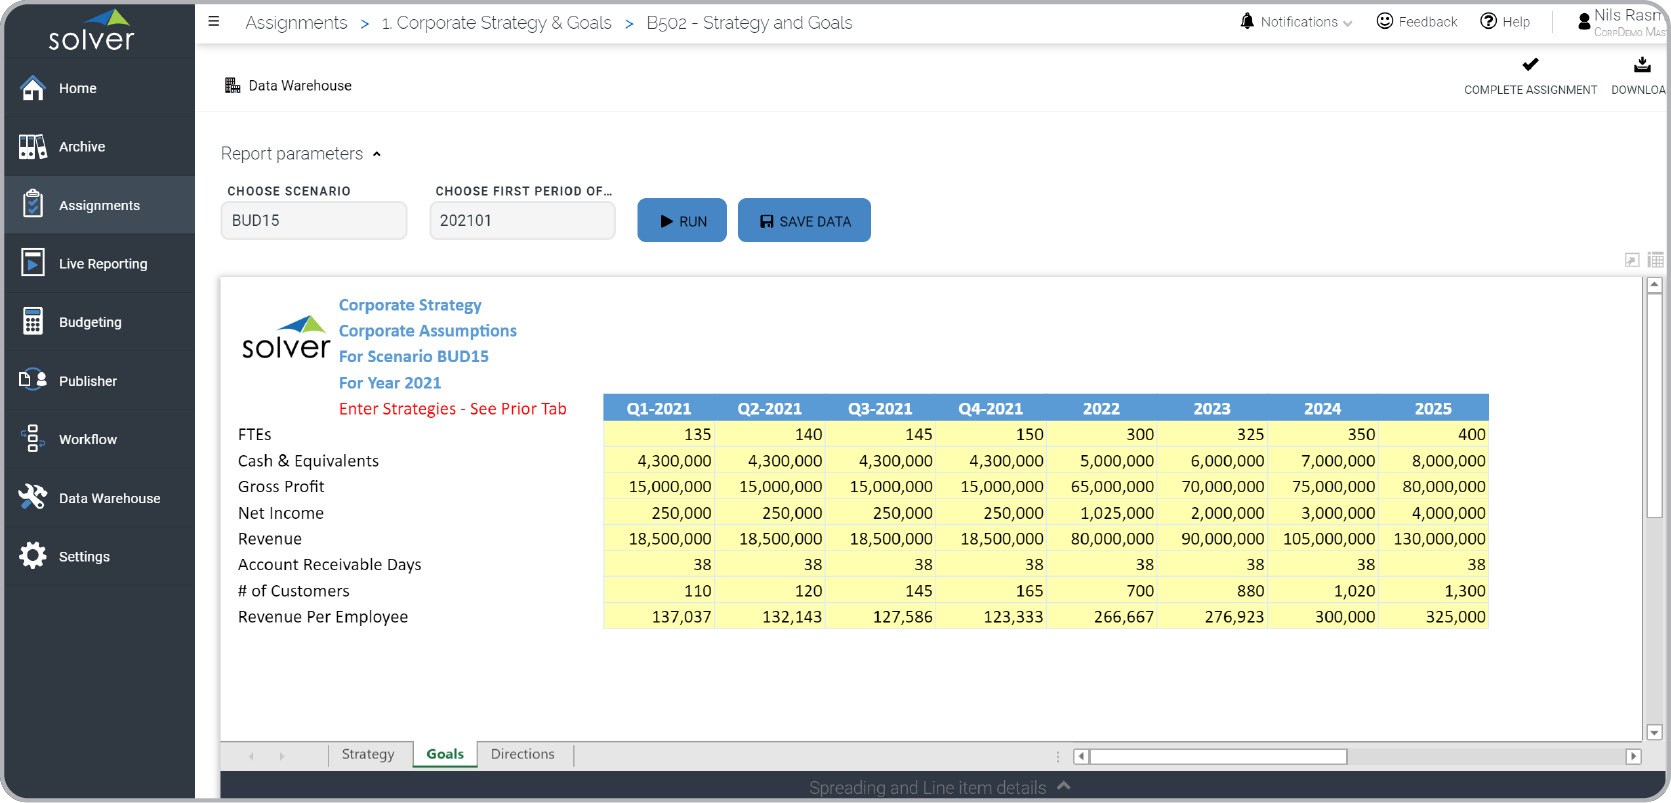
Strategy and Goals Input Form
What is a Strategy and Goals Input Form ? Strategy and goals input forms are considered management ...
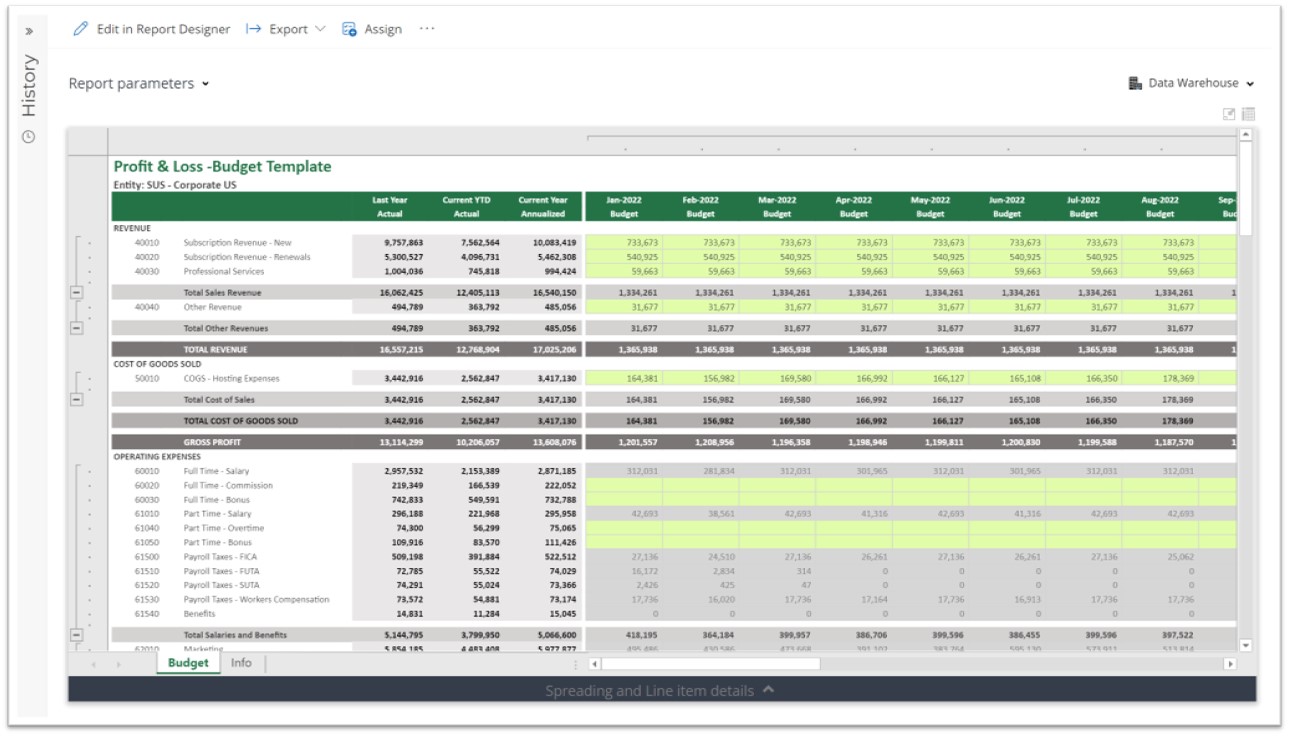
Profit & Loss Budget Model for SaaS Companies using Dynamics 365 Business Central
This article describes the Profit & Loss Budget Template that is included with Solver's SaaS ...
How to Align Your Business Strategy with Your Reporting, Planning and Analysis: Part 2
This article will continue the discussion of improving these tasks and processes and ensuring that ...
No Data Found!
1
Page 1 of 1