

What is
a
Profit & Loss Report with Monthly Trend
? A Profit & Loss Report with Monthly Trend is a valuable analytical tool commonly used by CFOs and financial managers. Its main objective is to identify upward or downward movements in a business. This type of report stands out for its dynamic presentation of historical data, showcasing monthly figures for each fiscal year up to the current period under evaluation. Here is an example to illustrate this report's format and content.
Purpose of
Trended Profit & Loss Reports Trended Profit & Loss Reports serve as a convenient way for companies and organizations to compare monthly results throughout the year, eliminating the need to generate multiple reports for individual periods. By incorporating these reports into the practices of a Financial Planning & Analysis (FP&A) Department, companies can swiftly identify trends in revenues, expenses, and profitability. This approach minimizes the risk of overlooking critical exceptions or shifts in the business.
Benefits to Users Implementing a Profit & Loss Report with Monthly Trend can bring substantial benefits to business users. Access to a comprehensive overview of financial performance empowers users to make well-informed decisions and steer their organizations towards success. The availability of trended data enables users to identify patterns and fluctuations in revenues, expenses, and profitability, facilitating proactive decision-making. This model also improves efficiency by eliminating the need for multiple reports, saving valuable time and resources. Ultimately, utilizing such reports optimizes financial planning and analysis processes, leading to enhanced operational efficiency and better overall business outcomes.
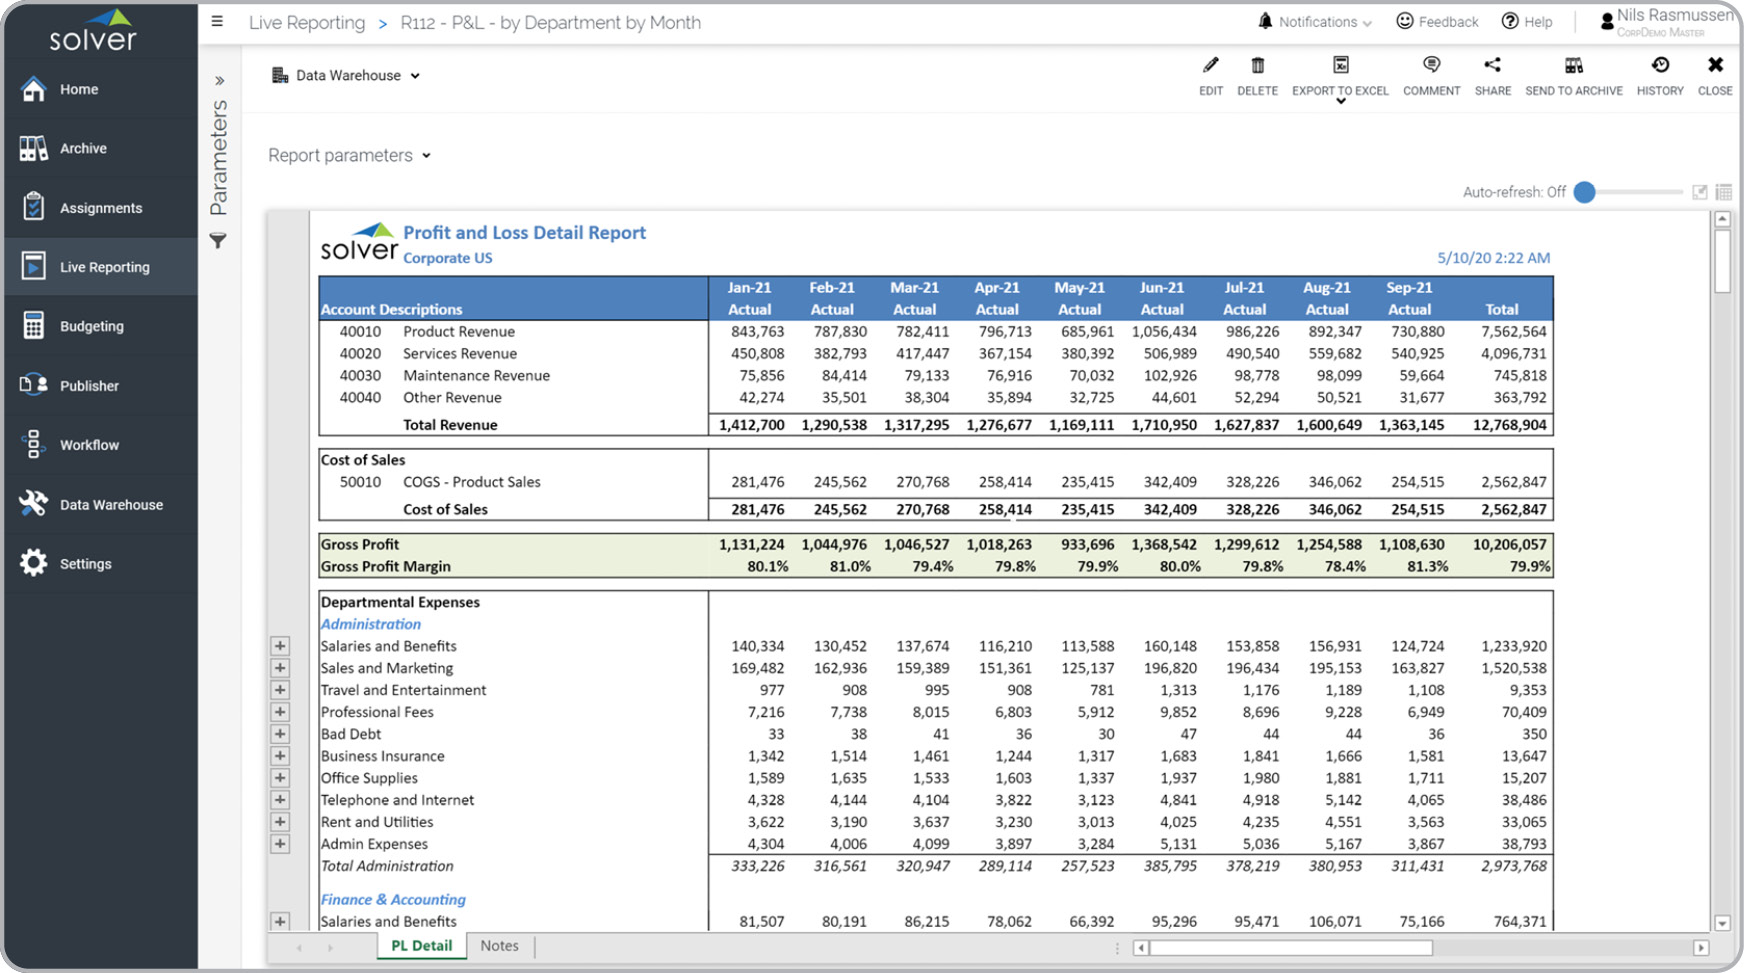
Trended Profit & Loss Report
Example Here is an example of a trend-based Profit & Loss Report with months displayed across the columns.
 You can find hundreds of additional examples
here.
Who Uses This Type of
Report
? The typical users of this type of report are: Executives and Financial Managers.
Other
Report
s Often Used in Conjunction with
Trended Profit & Loss Reports Progressive Financial Planning & Analysis (FP&A) Departments sometimes use several different Trended Profit & Loss Reports, along with trended balance sheets, cash flow statements and other management and control tools.
Where Does the Data for Analysis Originate From? The Actual (historical transactions) data typically comes from enterprise resource planning (ERP) systems like: Microsoft Dynamics 365 (D365) Finance, Microsoft Dynamics 365 Business Central (D365 BC), Microsoft Dynamics AX, Microsoft Dynamics NAV, Microsoft Dynamics GP, Microsoft Dynamics SL, Sage Intacct, Sage 100, Sage 300, Sage 500, Sage X3, SAP Business One, SAP ByDesign, Acumatica, Netsuite and others. In analyses where budgets or forecasts are used, the planning data most often originates from in-house Excel spreadsheet models or from professional corporate performance management (CPM/EPM) solutions.
What Tools are Typically used for Reporting, Planning and Dashboards? Examples of business software used with the data and ERPs mentioned above are:
You can find hundreds of additional examples
here.
Who Uses This Type of
Report
? The typical users of this type of report are: Executives and Financial Managers.
Other
Report
s Often Used in Conjunction with
Trended Profit & Loss Reports Progressive Financial Planning & Analysis (FP&A) Departments sometimes use several different Trended Profit & Loss Reports, along with trended balance sheets, cash flow statements and other management and control tools.
Where Does the Data for Analysis Originate From? The Actual (historical transactions) data typically comes from enterprise resource planning (ERP) systems like: Microsoft Dynamics 365 (D365) Finance, Microsoft Dynamics 365 Business Central (D365 BC), Microsoft Dynamics AX, Microsoft Dynamics NAV, Microsoft Dynamics GP, Microsoft Dynamics SL, Sage Intacct, Sage 100, Sage 300, Sage 500, Sage X3, SAP Business One, SAP ByDesign, Acumatica, Netsuite and others. In analyses where budgets or forecasts are used, the planning data most often originates from in-house Excel spreadsheet models or from professional corporate performance management (CPM/EPM) solutions.
What Tools are Typically used for Reporting, Planning and Dashboards? Examples of business software used with the data and ERPs mentioned above are:
Profit & Loss Report with Monthly Trend from Solver
- Native ERP report writers and query tools
- Spreadsheets (for example Microsoft Excel)
- Corporate Performance Management (CPM) tools (for example Solver)
- Dashboards (for example Microsoft Power BI and Tableau)
- View 100’s of reporting, consolidations, planning, budgeting, forecasting and dashboard examples here
- See how reports are designed in a modern report writer using a cloud-connected Excel add-in writer
- Discover how the Solver CPM solution delivers financial and operational reporting
- Discover how the Solver CPM solution delivers planning, budgeting and forecasting
- Watch demo videos of reporting, planning and dashboards