

What is
a
Consolidating Balance Sheet
? A Consolidating Balance Sheet is a financial statement that is commonly utilized by CFOs and Group Controllers on a monthly basis to compare and combine the balance sheets of subsidiary companies. It serves as a valuable analysis tool by dynamically presenting selected subsidiaries in columns and displaying a consolidated total on the far right. This report can be viewed in any currency, and users have the option to delve into specific numbers to review the underlying transactions. Below is an example of a Consolidating Balance Sheet.
Purpose of
Consolidating Balance Sheet Reports The purpose of Consolidating Balance Sheet Reports is to provide companies and organizations with a comprehensive overview of their assets, liabilities, and equity across all subsidiaries in a single glance. By incorporating these reports into the best practices of the Finance & Accounting Department, businesses can improve their analytical efficiency and agility while reducing the risk of overlooking critical factors that affect consolidated balance sheet metrics.
Benefits to Users Consolidating Balance Sheet Reports offer significant benefits to business users, enabling them to make informed decisions and enhance their effectiveness in their respective roles. By presenting a consolidated view of assets, liabilities, and equity across all subsidiaries, these reports provide a clear understanding of the overall financial position of the organization. This comprehensive perspective empowers users to identify trends, analyze financial performance, and make strategic decisions based on reliable and up-to-date information. Moreover, the ability to drill down into specific numbers and review underlying transactions enhances users' capacity for in-depth analysis. This feature facilitates better identification of potential issues or areas for improvement, allowing for prompt action to address them. The convenience of analyzing information through a single view saves time and effort, enabling users to focus on critical tasks and allocate resources effectively. Additionally, the accuracy and reliability of Consolidating Balance Sheet Reports reduce the risk of important contributors to consolidated balance sheet metrics going unnoticed. This can help mitigate financial risks and improve the overall financial well-being of the organization. With improved analytical speed and agility, business users can promptly respond to market changes, optimize resource allocation, and seize growth opportunities. Overall, the implementation of Consolidating Balance Sheet Reports as part of the Finance & Accounting Department's practices empowers business users to make better decisions, enhances their efficiency, and contributes to the success of the organization.
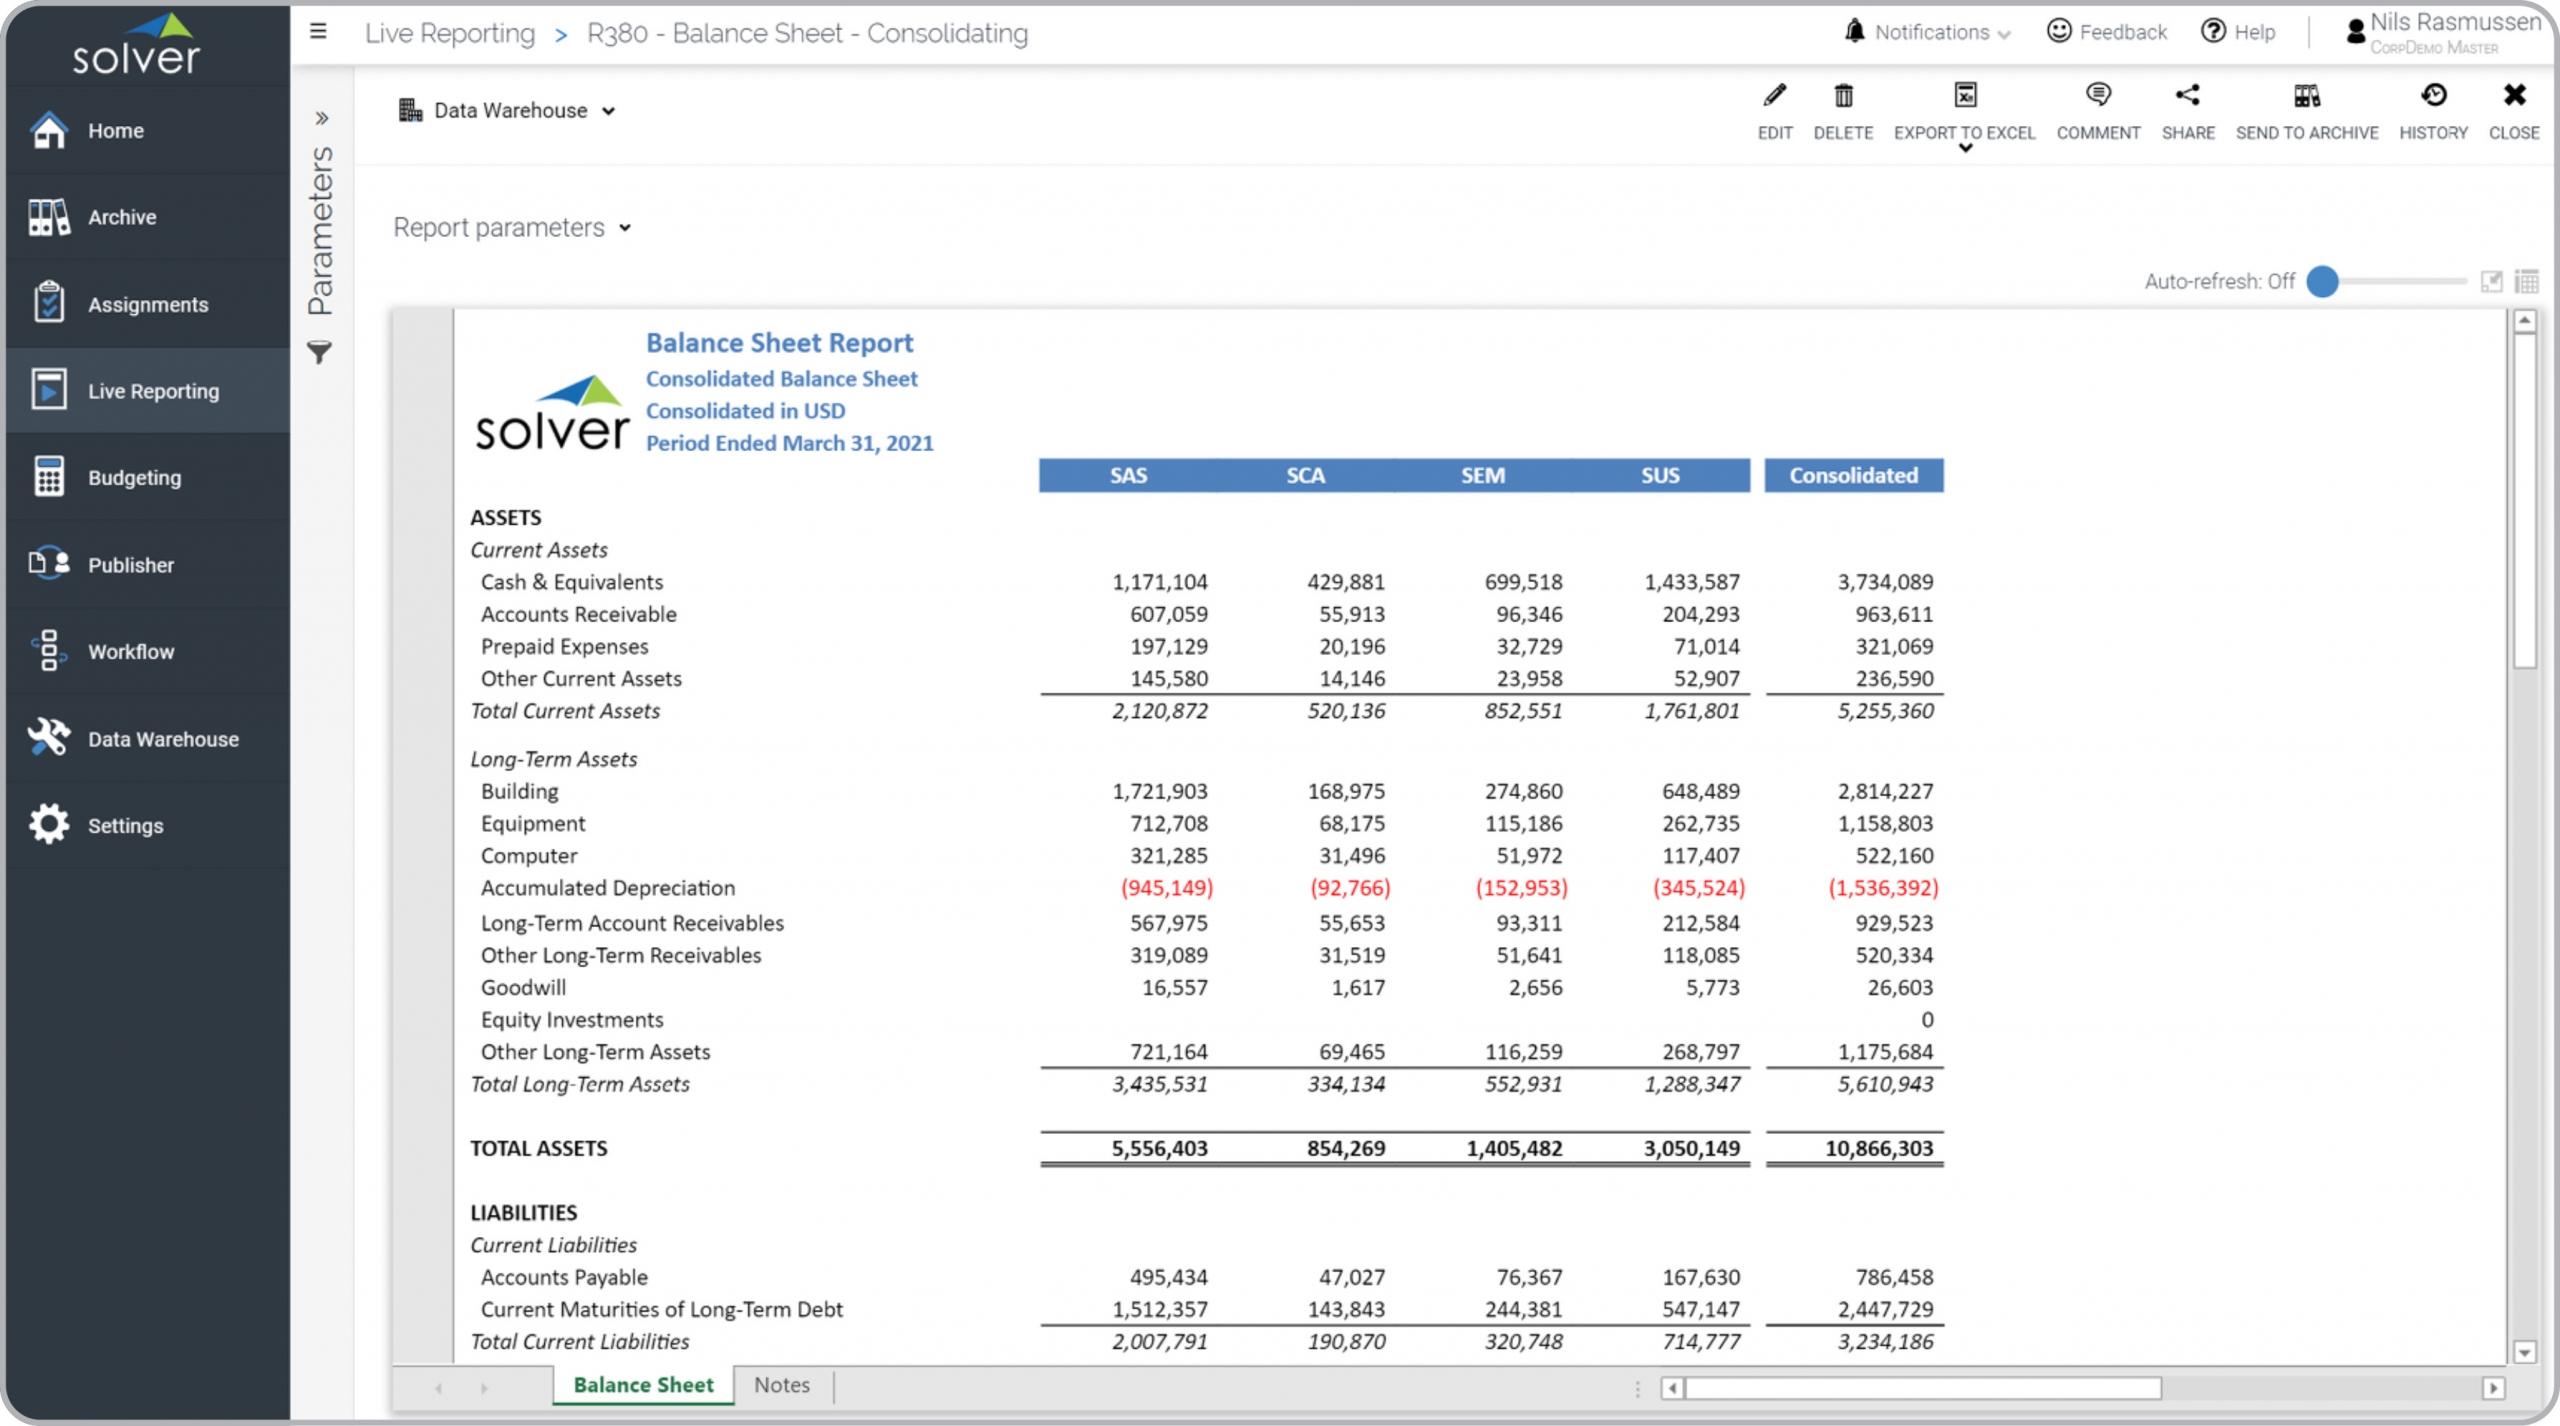
Consolidating Balance Sheet Report
Example Here is an example of a Consolidating Balance Sheet report with companies listed across the columns.
 You can find hundreds of additional examples
here.
Who Uses This Type of
Report
? The typical users of this type of report are: CFOs and Controllers.
Other
Report
s Often Used in Conjunction with
Consolidating Balance Sheet Reports Progressive Finance & Accounting Departments sometimes use several different Consolidating Balance Sheet Reports, along with consolidating profit & loss, cash flow reports and other management and control tools.
Where Does the Data for Analysis Originate From? The Actual (historical transactions) data typically comes from enterprise resource planning (ERP) systems like: Microsoft Dynamics 365 (D365) Finance, Microsoft Dynamics 365 Business Central (D365 BC), Microsoft Dynamics AX, Microsoft Dynamics NAV, Microsoft Dynamics GP, Microsoft Dynamics SL, Sage Intacct, Sage 100, Sage 300, Sage 500, Sage X3, SAP Business One, SAP ByDesign, Acumatica, Netsuite and others. In analyses where budgets or forecasts are used, the planning data most often originates from in-house Excel spreadsheet models or from professional corporate performance management (CPM/EPM) solutions.
What Tools are Typically used for Reporting, Planning and Dashboards? Examples of business software used with the data and ERPs mentioned above are:
You can find hundreds of additional examples
here.
Who Uses This Type of
Report
? The typical users of this type of report are: CFOs and Controllers.
Other
Report
s Often Used in Conjunction with
Consolidating Balance Sheet Reports Progressive Finance & Accounting Departments sometimes use several different Consolidating Balance Sheet Reports, along with consolidating profit & loss, cash flow reports and other management and control tools.
Where Does the Data for Analysis Originate From? The Actual (historical transactions) data typically comes from enterprise resource planning (ERP) systems like: Microsoft Dynamics 365 (D365) Finance, Microsoft Dynamics 365 Business Central (D365 BC), Microsoft Dynamics AX, Microsoft Dynamics NAV, Microsoft Dynamics GP, Microsoft Dynamics SL, Sage Intacct, Sage 100, Sage 300, Sage 500, Sage X3, SAP Business One, SAP ByDesign, Acumatica, Netsuite and others. In analyses where budgets or forecasts are used, the planning data most often originates from in-house Excel spreadsheet models or from professional corporate performance management (CPM/EPM) solutions.
What Tools are Typically used for Reporting, Planning and Dashboards? Examples of business software used with the data and ERPs mentioned above are:
Consolidating Balance Sheet Report from Solver
- Native ERP report writers and query tools
- Spreadsheets (for example Microsoft Excel)
- Corporate Performance Management (CPM) tools (for example Solver)
- Dashboards (for example Microsoft Power BI and Tableau)
- View 100’s of reporting, consolidations, planning, budgeting, forecasting and dashboard examples here
- Discover how the Solver CPM solution delivers financial and operational reporting
- Discover how the Solver CPM solution delivers planning, budgeting and forecasting
- Watch demo videos of reporting, planning and dashboards