
This article describes the
Profit & Loss Interactive Report that is included with Solver's SaaS model for users of the Microsoft Dynamics 365 Business Central ERP and Binary Stream's
Subscription Billing Suite
(SBS). It is part of a library of more than 150 ready-to-use reports, budget models and dashboard templates that Solver provides to SaaS companies as part of its cloud Corporate Performance Management (CPM) platform.
Unlocking Financial Insight: The Power of Profit & Loss Interactive Reports in SaaS Management
In the dynamic landscape of Software as a Service (SaaS) companies, strategic decision-making hinges on accurate and timely financial insights. The implementation of a robust Corporate Performance Management (CPM) solution, like Solver, offers a transformative approach to financial reporting, analysis, and budgeting. One standout feature within Solver's arsenal is the Profit & Loss Interactive Report�a dynamic tool that not only addresses common industry challenges but propels financial leaders toward agile and informed decision-making.Challenges in Traditional SaaS Financial Reporting
- Lack of Self-Service Capabilities: Traditional financial reporting often falls short in providing the self-service capabilities necessary for on-demand analysis. Managers grapple with static reports and the inability to swiftly extract meaningful insights.
- Excel Overload: SaaS companies frequently rely on an array of manual Excel spreadsheets to communicate revenue and expense trends. This manual approach not only consumes valuable time but also increases the risk of errors and delays in decision-making.
- Lack of Graphics in Financial Statements: Because financial statements typically consist of a large number of rows and many columns, legacy reporting tools have lacked screen space and capability to present each row graphically.
Benefits of Modern Profit & Loss Interactive Reports
- Interactive Row Analysis: Solver's Profit & Loss Interactive Report introduces a groundbreaking interactive row analysis feature. Leaders can select any row within the P&L, instantly reflecting the chosen row across the entire dashboard. This feature facilitates in-depth analysis and empowers executives to swiftly address questions and concerns.
- Graphical Analysis and Comparative Trends: The interactive charting features present in the Profit & Loss Interactive Report enhance decision-making by providing graphical representations of comparative figures and trends for the current year, last year, and budget. This visual clarity accelerates the comprehension of financial data.
- Combo Layout for Comprehensive Insights: The combo layout of monthly, year-to-date, and full-year variance analysis, presented in both tabular and dashboard formats, offers a comprehensive view. This layout is designed to cater specifically to the nuanced needs of SaaS companies, facilitating quick and efficient decision-making.
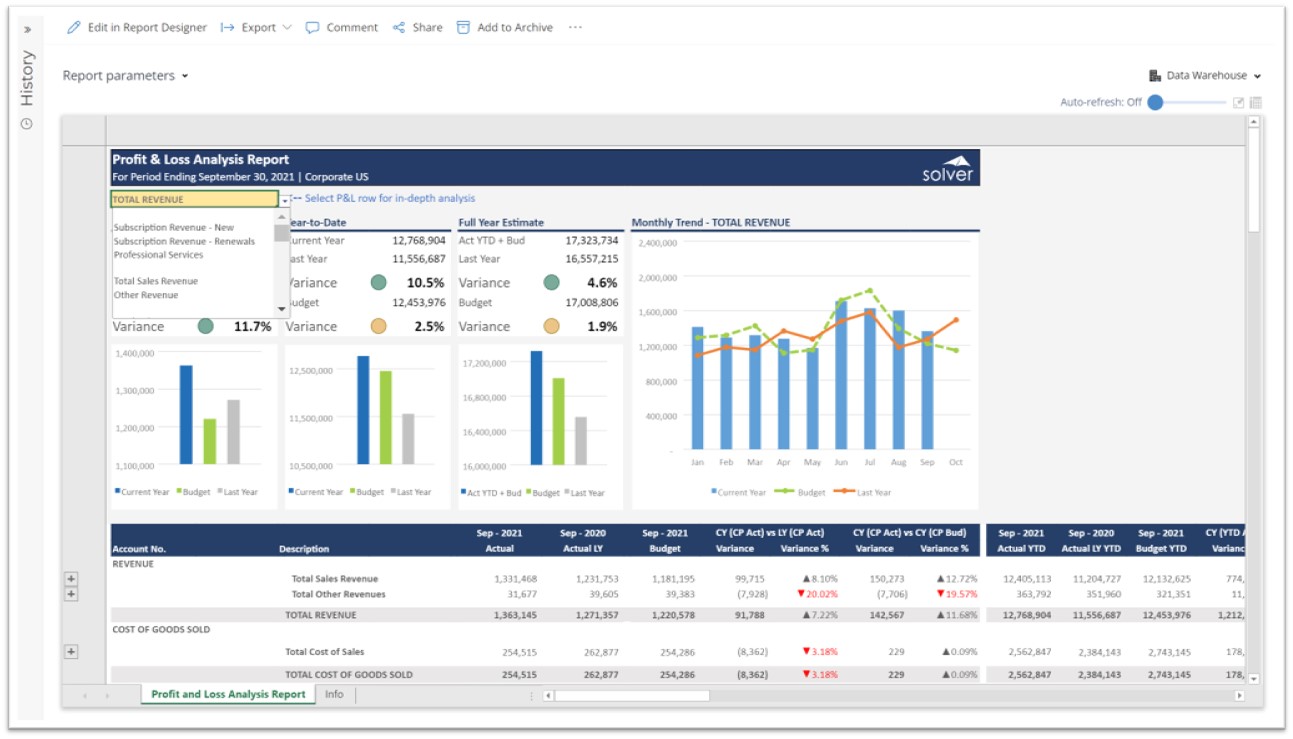
About the Profit & Loss Interactive Report
On the surface this appears to be a P&L report with charts. However, the drop down box in the yellow cell (see image below) will let you choose any row from the detailed P&L seen at the bottom of the image below, and instantly the entire dashboard section with charts will analyze the selected row (e.g. subscription revenue, cost of sales, salary expense, net profit, etc.). In other words, if you have 80 rows in your P&L, this report is the equivalent to 80 dashboards due to the mentioned interactivity. For this and many other ready-to-use templates from Solver, visit our web-site Marketplace page.
Why Choose Solver for Comprehensive Financial Management
In the pursuit of a streamlined and automated financial management solution, Solver emerges as a standout choice. The ready-to-use Profit & Loss Interactive Report is just one facet of Solver's comprehensive CPM solution, which boasts over 150 pre-built reports, dashboards, and budgeting templates. By choosing Solver, SaaS companies can effectively eliminate the pains associated with manual spreadsheets and static reporting, paving the way for accelerated, accurate, and informed decision-making. In conclusion, the Profit & Loss Interactive Report within the Solver CPM solution offers a transformative solution to the financial reporting challenges faced by SaaS companies. By embracing modern, interactive, and self-service capabilities, financial leaders can propel their organizations toward a future of agile decision-making and sustained success. Resources for Additional SaaS Reports, Dashboards and Budget Models For more information about all the SaaS templates from Solver check out these resources:- Take a self-guided tour of Solver
- Contact Solver for a personal demo or a quote
January 20, 2024
TAGS: report writer, subscription, D365 BC, dashboard, forecasting, analysis, budgeting, KPI, BI, Binary Stream, CPM, report, EPM, Subscription BIlling, SaaS, Corporate Performance Management, Budgeting Software, Microsoft Dynamics 365 Business Central, integration, business intelligence, SAAS company, SBS, Binary Stream Subscription Billing suite, P&L dashboard, Profit & Loss Interactive Report, binary stream report, SaaS Income Statement, SaaS report, graphical P&L