Strategic KPI Report for Dynamics 365 Business Central
What is
a
Strategic KPI Report
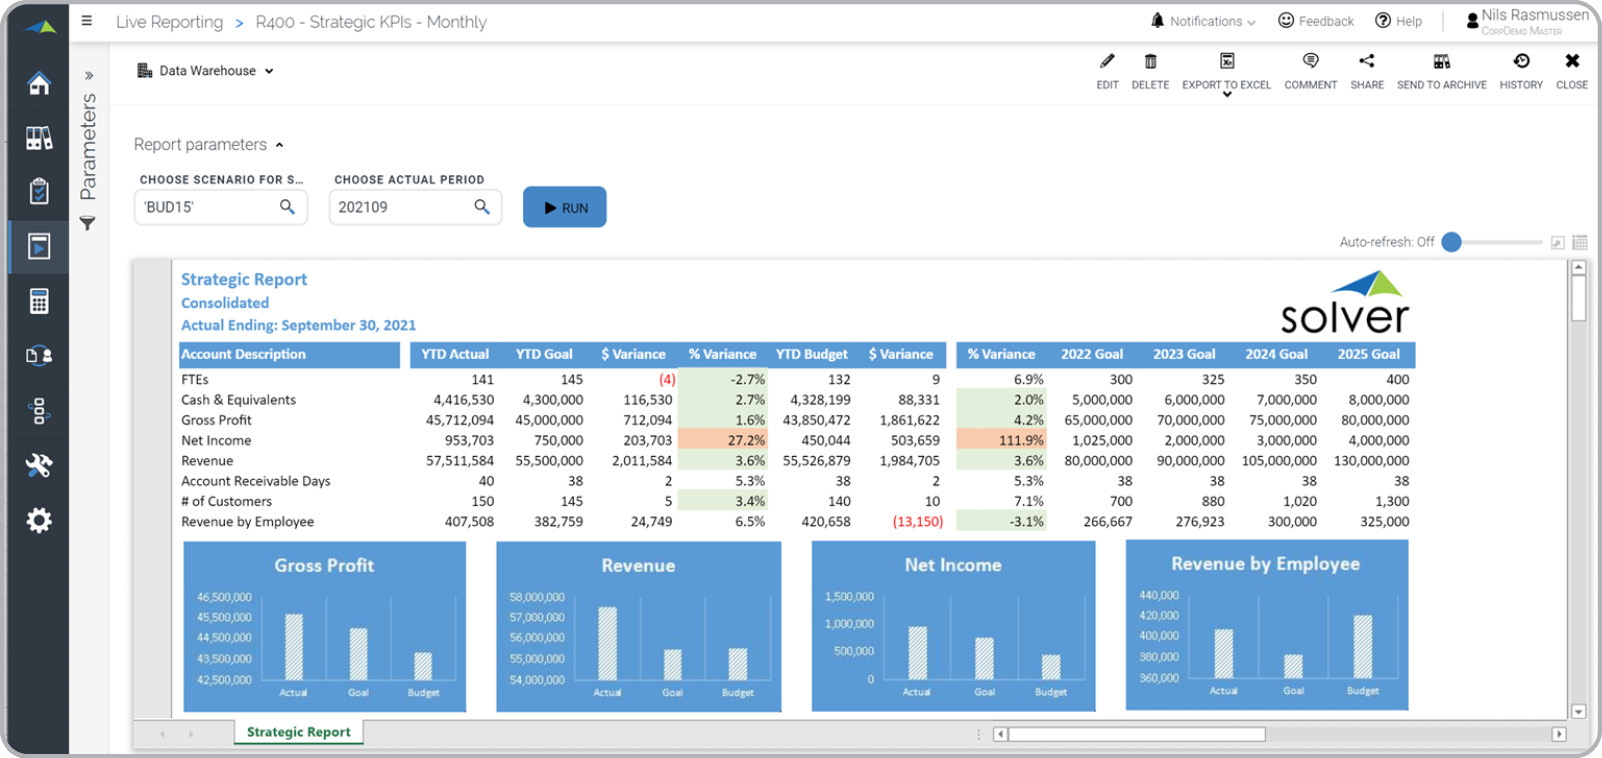
? Strategic KPI Reports serve as executive dashboards, offering leadership teams a quick and comprehensive view of the organization's performance in critical areas. These reports present key metrics in a professional and easily understandable layout, accompanied by graphical charts displaying top KPIs at the bottom. Target thresholds are clearly identified through background color-coding, using red or green to signify exceptions. Additionally, the far right columns showcase KPI targets for the next four years. An example of this type of dashboard report is provided below.
Purpose of
Strategic KPI Reports Companies and organizations utilize Strategic KPI Reports to facilitate effective monitoring of their most vital performance indicators. By integrating these reports into the Financial Planning & Analysis (FP&A) Department's practices, companies can enhance control over their operations and ensure that leadership teams prioritize essential aspects. This approach minimizes the risk of overlooking poor performance in strategic areas and ensures timely attention is given to critical matters, leading to improved overall performance.
Benefits to Users The Strategic KPI Reports model offers numerous advantages that empower business users to make better decisions and enhance their efficiency in various roles. By providing a clear and concise overview of key performance indicators, this model enables users to swiftly identify areas that require attention or improvement. The professional and easy-to-read layout of metrics facilitates a deeper understanding of the organization's overall performance, allowing users to gauge progress and identify trends more effectively. Additionally, the graphical representation of top KPIs aids in visualizing data, making complex information more accessible and actionable. With this valuable tool at their disposal, business users can confidently align their strategies, allocate resources more efficiently, and proactively address any challenges, ultimately driving the organization towards greater success and growth.
Strategic KPI Report
Example Here is an example of a Strategic KPI Report with metrics, multi-year targets and charts.
 You can find hundreds of additional examples
here.
Who Uses This Type of
Dashboard report
? The typical users of this type of dashboard report are: Boards and Executives.
Other
Dashboard report
s Often Used in Conjunction with
Strategic KPI Reports Progressive Financial Planning & Analysis (FP&A) Departments sometimes use several different Strategic KPI Reports, along with financial reports, operational reports, dashboards and other management and control tools.
Where Does the Data for Analysis Originate From? The Actual (historical transactions) data typically comes from enterprise resource planning (ERP) systems like: Microsoft Dynamics 365 (D365) Finance, Microsoft Dynamics 365 Business Central (D365 BC), Microsoft Dynamics AX, Microsoft Dynamics NAV, Microsoft Dynamics GP, Microsoft Dynamics SL, Sage Intacct, Sage 100, Sage 300, Sage 500, Sage X3, SAP Business One, SAP ByDesign, Acumatica, Netsuite and others. In analyses where budgets or forecasts are used, the planning data most often originates from in-house Excel spreadsheet models or from professional corporate performance management (CPM/EPM) solutions.
What Tools are Typically used for Reporting, Planning and Dashboards? Examples of business software used with the data and ERPs mentioned above are:

Strategic KPI Report from Solver
- Native ERP report writers and query tools
- Spreadsheets (for example Microsoft Excel)
- Corporate Performance Management (CPM) tools (for example Solver)
- Dashboards (for example Microsoft Power BI and Tableau)
- View 100’s of reporting, consolidations, planning, budgeting, forecasting and dashboard examples here
- See how reports are designed in a modern report writer using a cloud-connected Excel add-in writer
- Discover how the Solver CPM solution delivers financial and operational reporting
- Discover how the Solver CPM solution delivers planning, budgeting and forecasting
- Watch demo videos of reporting, planning and dashboards
Global Headquarters
Solver, Inc.
Phone: +1 (310) 691-5300
