

What is
a
Profit & Loss Report with Department Comparisons
? A Profit & Loss Report with Department Comparisons is a financial statement that provides a side-by-side view of different departments within an organization. It is commonly used by accountants and department managers to compare the performance of one department to another. This type of report automatically lists selected departments across columns, along with a consolidated total. The rows in the report follow a standard Profit & Loss layout, and additional charts on the right-side aid in the analysis. An example of this report can be found below.
Purpose of
Comparative Profit & Loss Reports Comparative Profit & Loss Reports serve the purpose of allowing companies and organizations to easily compare the performance of each department in terms of revenues and expenses. By using these reports as part of sound business practices within the Finance and Accounting Department, a company can enhance its analysis at the account level and minimize the risk of a department unknowingly deviating significantly from others, particularly in relation to specific expenses.
Benefits to Users Implementing a Profit & Loss Report with Department Comparisons offers significant advantages for business users. Firstly, it provides a clear and concise overview of departmental performance, enabling users to swiftly identify areas of strength and areas that require attention. By comparing revenues and expenses across departments, users gain valuable insights into which areas are thriving and which may need improvement. Moreover, these reports streamline reporting processes and boost efficiency in users' roles. Instead of manually aggregating data from multiple sources or generating separate reports for each department, users can rely on the automated functionality of the Profit & Loss Report with Department Comparisons. This time-saving feature allows users to focus on higher-value tasks and strategic initiatives, contributing to their overall productivity. In summary, implementing a Profit & Loss Report with Department Comparisons empowers business users to make better-informed decisions, improve departmental performance, and contribute to the overall success of the organization. By leveraging comparative insights and streamlining reporting processes, users can optimize their job functions, drive efficiency, and foster a data-driven culture within the organization.
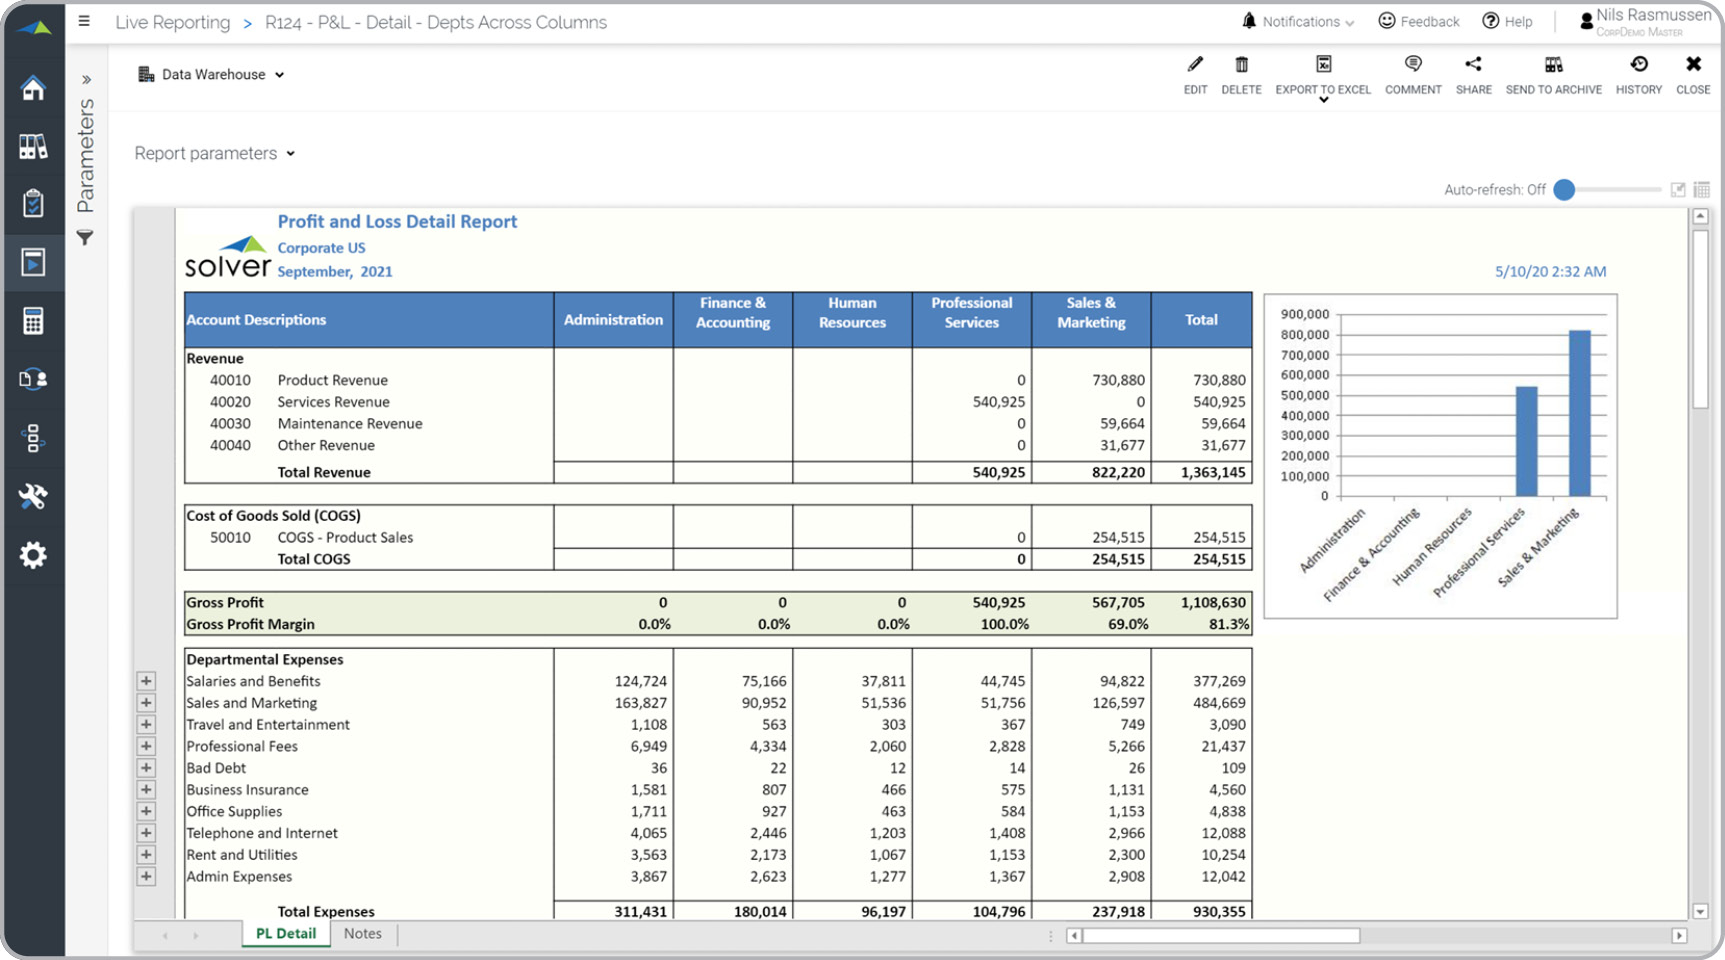
Comparative Profit & Loss Report
Example Here is an example of a Profit & Loss Report with departments listed across the columns.
 You can find hundreds of additional examples
here.
Who Uses This Type of
Report
? The typical users of this type of report are: CFOs, Controllers and Accountants.
Other
Report
s Often Used in Conjunction with
Comparative Profit & Loss Reports Progressive Finance and Accounting Departments sometimes use several different Comparative Profit & Loss Reports, along with regular financial statements and other management and control tools.
Where Does the Data for Analysis Originate From? The Actual (historical transactions) data typically comes from enterprise resource planning (ERP) systems like: Microsoft Dynamics 365 (D365) Finance, Microsoft Dynamics 365 Business Central (D365 BC), Microsoft Dynamics AX, Microsoft Dynamics NAV, Microsoft Dynamics GP, Microsoft Dynamics SL, Sage Intacct, Sage 100, Sage 300, Sage 500, Sage X3, SAP Business One, SAP ByDesign, Acumatica, Netsuite and others. In analyses where budgets or forecasts are used, the planning data most often originates from in-house Excel spreadsheet models or from professional corporate performance management (CPM/EPM) solutions.
What Tools are Typically used for Reporting, Planning and Dashboards? Examples of business software used with the data and ERPs mentioned above are:
You can find hundreds of additional examples
here.
Who Uses This Type of
Report
? The typical users of this type of report are: CFOs, Controllers and Accountants.
Other
Report
s Often Used in Conjunction with
Comparative Profit & Loss Reports Progressive Finance and Accounting Departments sometimes use several different Comparative Profit & Loss Reports, along with regular financial statements and other management and control tools.
Where Does the Data for Analysis Originate From? The Actual (historical transactions) data typically comes from enterprise resource planning (ERP) systems like: Microsoft Dynamics 365 (D365) Finance, Microsoft Dynamics 365 Business Central (D365 BC), Microsoft Dynamics AX, Microsoft Dynamics NAV, Microsoft Dynamics GP, Microsoft Dynamics SL, Sage Intacct, Sage 100, Sage 300, Sage 500, Sage X3, SAP Business One, SAP ByDesign, Acumatica, Netsuite and others. In analyses where budgets or forecasts are used, the planning data most often originates from in-house Excel spreadsheet models or from professional corporate performance management (CPM/EPM) solutions.
What Tools are Typically used for Reporting, Planning and Dashboards? Examples of business software used with the data and ERPs mentioned above are:

Profit & Loss Report with Department Comparisons for Solver
- Native ERP report writers and query tools
- Spreadsheets (for example Microsoft Excel)
- Corporate Performance Management (CPM) tools (for example Solver)
- Dashboards (for example Microsoft Power BI and Tableau)
- View 100’s of reporting, consolidations, planning, budgeting, forecasting and dashboard examples here
- See how reports are designed in a modern report writer using a cloud-connected Excel add-in writer
- Discover how the Solver CPM solution delivers financial and operational reporting
- Discover how the Solver CPM solution delivers planning, budgeting and forecasting
- Watch demo videos of reporting, planning and dashboards
TAGS: Reporting, ERP, Compare CPM, Template Library