

What is
a
Monthly Balance Sheet with Prior Month and Last Year Comparisons
? A Monthly Balance Sheet with Prior Month and Last Year Comparisons is a financial report generated at the end of each month. It serves as a crucial tool for CFOs and accountants to assess the company's assets and liabilities. This type of report employs parameter-driven functionality to populate data and headers into three columns. An example of such a report is provided below.
Purpose of
Monthly Balance Sheets The purpose of Monthly Balance Sheets is to facilitate the tracking of month-over-month performance of assets and liabilities for companies and organizations. By integrating them into the Finance and Accounting Department's best practices, companies can enhance their monthly reporting automation, ensure fiscal control, and minimize the risk of overlooking significant changes.
Benefits to Users Implementing a Monthly Balance Sheet with Prior Month and Last Year Comparisons offers significant benefits to business users, enabling them to make informed decisions and enhance efficiency in their roles. By providing a clear overview of the company's financial standing, this type of model empowers users to identify trends, analyze performance, and spot potential areas for improvement. With access to accurate and up-to-date financial data, users can make strategic decisions based on reliable information, leading to more effective financial planning and resource allocation. Moreover, the automation of monthly reporting processes reduces manual effort, allowing users to focus their time and energy on value-added tasks that contribute to the company's growth and success.
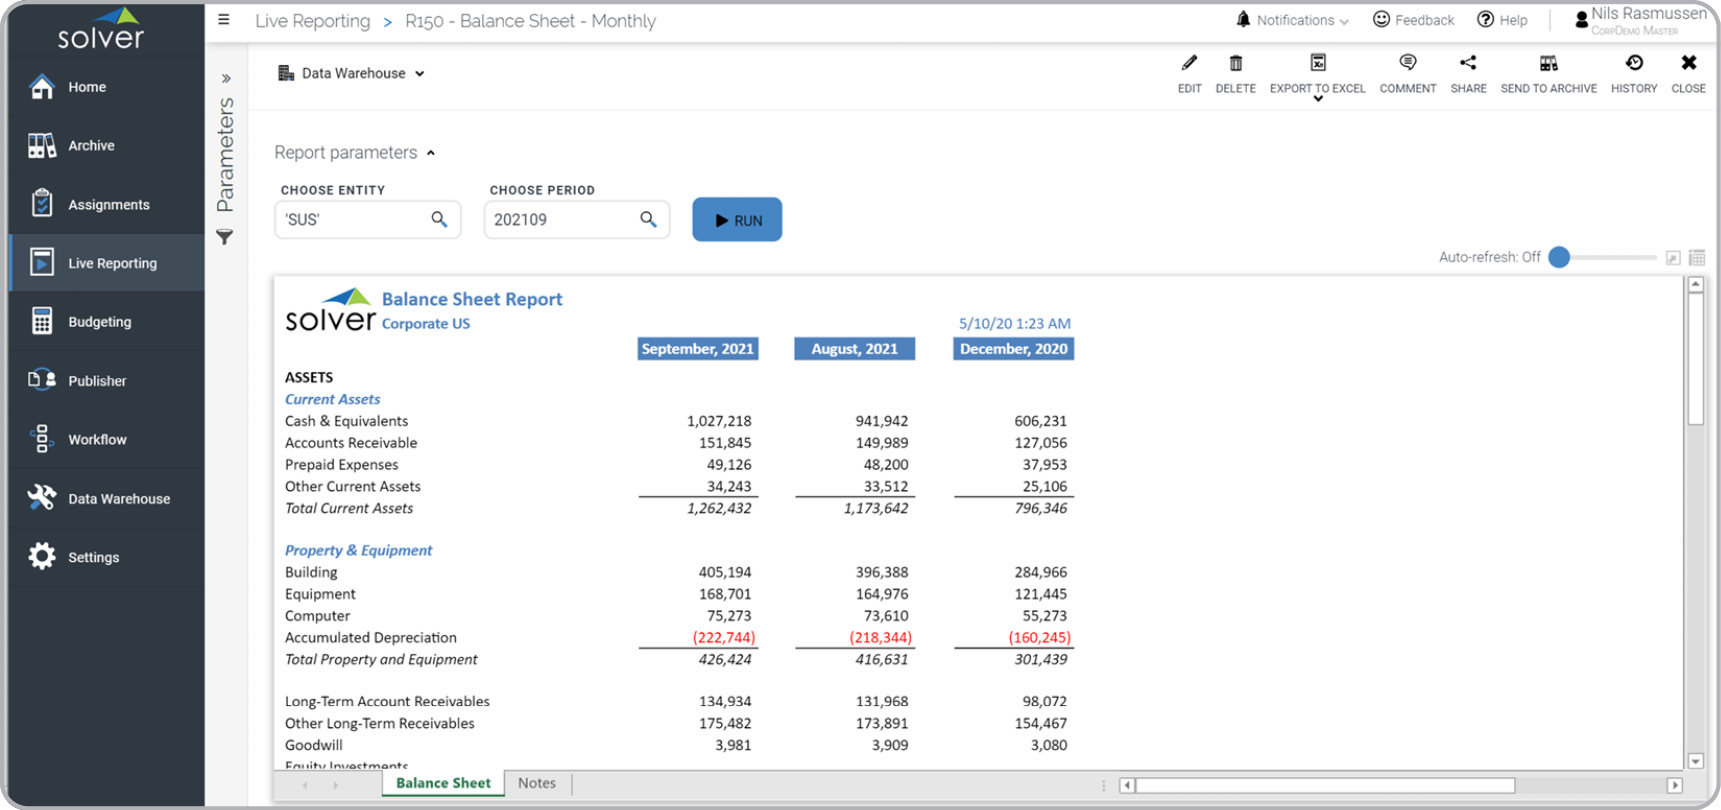
Monthly Balance Sheet
Example Here is an example of a Balance Sheet with current month, prior month and last year balances.
 You can find hundreds of additional examples
here.
Who Uses This Type of
Report
? The typical users of this type of report are: CFOs, Controllers and Accountants.
Other
Report
s Often Used in Conjunction with
Monthly Balance Sheets Progressive Finance and Accounting Departments sometimes use several different Monthly Balance Sheets, along with monthly profit & loss, cash flow statements and other management and control tools.
Where Does the Data for Analysis Originate From? The Actual (historical transactions) data typically comes from enterprise resource planning (ERP) systems like: Microsoft Dynamics 365 (D365) Finance, Microsoft Dynamics 365 Business Central (D365 BC), Microsoft Dynamics AX, Microsoft Dynamics NAV, Microsoft Dynamics GP, Microsoft Dynamics SL, Sage Intacct, Sage 100, Sage 300, Sage 500, Sage X3, SAP Business One, SAP ByDesign, Acumatica, Netsuite and others. In analyses where budgets or forecasts are used, the planning data most often originates from in-house Excel spreadsheet models or from professional corporate performance management (CPM/EPM) solutions.
What Tools are Typically used for Reporting, Planning and Dashboards? Examples of business software used with the data and ERPs mentioned above are:
You can find hundreds of additional examples
here.
Who Uses This Type of
Report
? The typical users of this type of report are: CFOs, Controllers and Accountants.
Other
Report
s Often Used in Conjunction with
Monthly Balance Sheets Progressive Finance and Accounting Departments sometimes use several different Monthly Balance Sheets, along with monthly profit & loss, cash flow statements and other management and control tools.
Where Does the Data for Analysis Originate From? The Actual (historical transactions) data typically comes from enterprise resource planning (ERP) systems like: Microsoft Dynamics 365 (D365) Finance, Microsoft Dynamics 365 Business Central (D365 BC), Microsoft Dynamics AX, Microsoft Dynamics NAV, Microsoft Dynamics GP, Microsoft Dynamics SL, Sage Intacct, Sage 100, Sage 300, Sage 500, Sage X3, SAP Business One, SAP ByDesign, Acumatica, Netsuite and others. In analyses where budgets or forecasts are used, the planning data most often originates from in-house Excel spreadsheet models or from professional corporate performance management (CPM/EPM) solutions.
What Tools are Typically used for Reporting, Planning and Dashboards? Examples of business software used with the data and ERPs mentioned above are:

Monthly Balance Sheet with Prior Month and Last Year Comparisons from Solver
- Native ERP report writers and query tools
- Spreadsheets (for example Microsoft Excel)
- Corporate Performance Management (CPM) tools (for example Solver)
- Dashboards (for example Microsoft Power BI and Tableau)
- View 100’s of reporting, consolidations, planning, budgeting, forecasting and dashboard examples here
- See how reports are designed in a modern report writer using a cloud-connected Excel add-in writer
- Discover how the Solver CPM solution delivers financial and operational reporting
- Discover how the Solver CPM solution delivers planning, budgeting and forecasting
- Watch demo videos of reporting, planning and dashboards