Dynamics 365 Finance (D365 Finance) and Power BI are both rapidly growing cloud software applications from Microsoft. Although these technologies can be used independently, customers are increasingly using them together as an integrated platform. As executives drive their accounting teams to migrate to a modern cloud ERP system like D365 Finance, senior leaders are at the same time expecting to gain the ability to perform world-class analyses with their new ERP. For that reason, evaluation teams not only have to review core ERP functionality to make sure current and future needs are met, but they also must determine the tools to use for dashboards, reporting, and planning. Power BI has become the world’s most popular business intelligence (BI) solution and it is the natural data visualization dashboard choice for financial data from Dynamics 365. It is typically deployed as a stand-alone web service from Microsoft with companies often including other kinds of non-financial data as well. As with any flexible dashboard software, however, developing Power BI models can be complex, time-consuming, and costly, especially when building numerous dashboards and tailoring them to your D365 Finance business dimensions and data. What’s more, if the Power BI models are not wisely built it can be a daunting task to maintain them when your chart of accounts grows or when you make other changes or additions in Dynamics 365. Most people that have implemented dashboard models for financial data know that it can take hundreds of hours of integration and design time before managers can enjoy their “shiny” dashboard gadgets. This blog will focus on
rapid deployment of Power BI dashboards for Dynamics 365 Finance, as well as several factors you may want to think about to ensure your executives’ expectations are met or exceeded when it comes to providing them with:
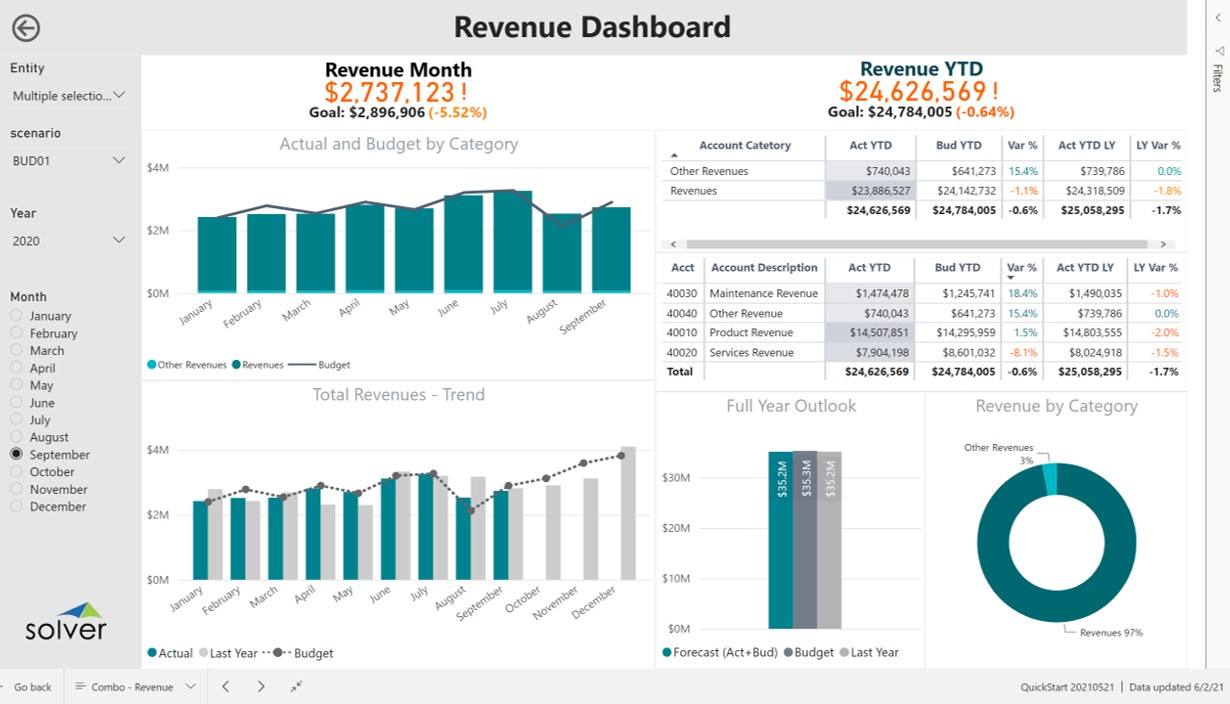
- Revenue Dashboards
- Expense Dashboards
- Variance Dashboards
- Exception Dashboards
- Trend Dashboards
- Balance Sheet Dashboards
- KPI Dashboards
- Benchmarking Dashboards
Why Use Stand-alone Power BI Dashboards to Compliment the Native Tools in Dynamics 365? D365 Finance provides a limited version of Power BI that has been embedded with the ERP user interface. This format offers “native” dashboards and comes with a few simple, pre-built financial templates, but much like almost any other cloud ERP system’s native or embedded dashboard options, it lacks the complete flexibility that a management team usually requires when producing highly professional, automated graphical dashboards that can combine their ERP data with other important data sources.
Here is a link to a showcase that features more than a hundred dashboard examples. It provides a general idea of the capabilities in both breadth and depth that many professional reporting and analysis tools offer. It can also help you improve and democratize analyses for better, faster decisions in your business. Additional ideas can be found by trying
these interactive Power BI dashboards.
Solver QuickStart - Power BI Dashboard Templates for Dynamics 365 Finance
Many Dynamics 365 customers support their graphical analysis needs through Excel because the software is already owned, users already know how to use it, and the interface is easy and flexible to build while maintaining the underlying formulas. However, there is a rapidly growing demand for cloud-based, best-of-breed dashboard tools like Power BI that offer a dynamic and secure user experience with rich, interactive charting and drill-down and that provides real-time, self-service
reporting and analysis processes.
How to Pick the Right Dashboard Solution for Dynamics 365 Finance Much can be written about the best and most affordable way to deploy Power BI. Most organizations find that delivering a rich and sustainable dashboard experience to their business and Office of Finance users does require more than just a Power BI license. These other components include:
- Pre-built financial dashboard templates that work out-of-the box, and that can be changed or copied to support special custom needs.
- Financial reporting and planning that complement Power BI graphical dashboards. Here is more information about things to look for in professional reporting and planning
- A data warehouse or staging database to organize key Dynamics 365 data and dimensions, with the added capability to include non-ERP data in order to deliver a comprehensive, clean data model to Power BI. Read more about pre-built financial data warehouses here.
We will not go into details about dashboard software evaluation in this blog but, if you want some ideas,
this other blog highlights key areas many people want in a dashboard, while
this interactive tool provides a simple way to compare and score vendors. It also includes an ROI calculator to analyze the cost and benefit of alternative tools versus your current solution. In short, progressive executive and finance teams of the 2020s want dashboard solutions that are flexible; that are closely integrated with financial reporting, budgeting and forecasting functionality; and that provide quick time to value through template-based deployment.
What Is Considered a Quick Start with a Power BI Dashboard Solution for Dynamics 365 Finance? Most Dynamics 365 customers want their connected apps, including dashboards, to be cloud based. The questions that quickly come up include: How hard is it to go beyond the native visualization tools that already come with D365 Finance, and to integrate a best-of-breed tool like Power BI with their ERP? How much cost and effort does it take to get key financial dashboards up and running? The typical answer: Weeks or months of effort and tens of thousands of dollars in services. Sometimes, the completed integration is static and the ability to maintain data models is complicated and hard. This often results in disappointing outcomes. However, Microsoft software partners like
Solver, that work very closely with the Dynamics 365 Finance solution and its partner channel, have developed pre-built integrations, a data warehouse and out-of-the-box dashboards to solve these challenges. For example,
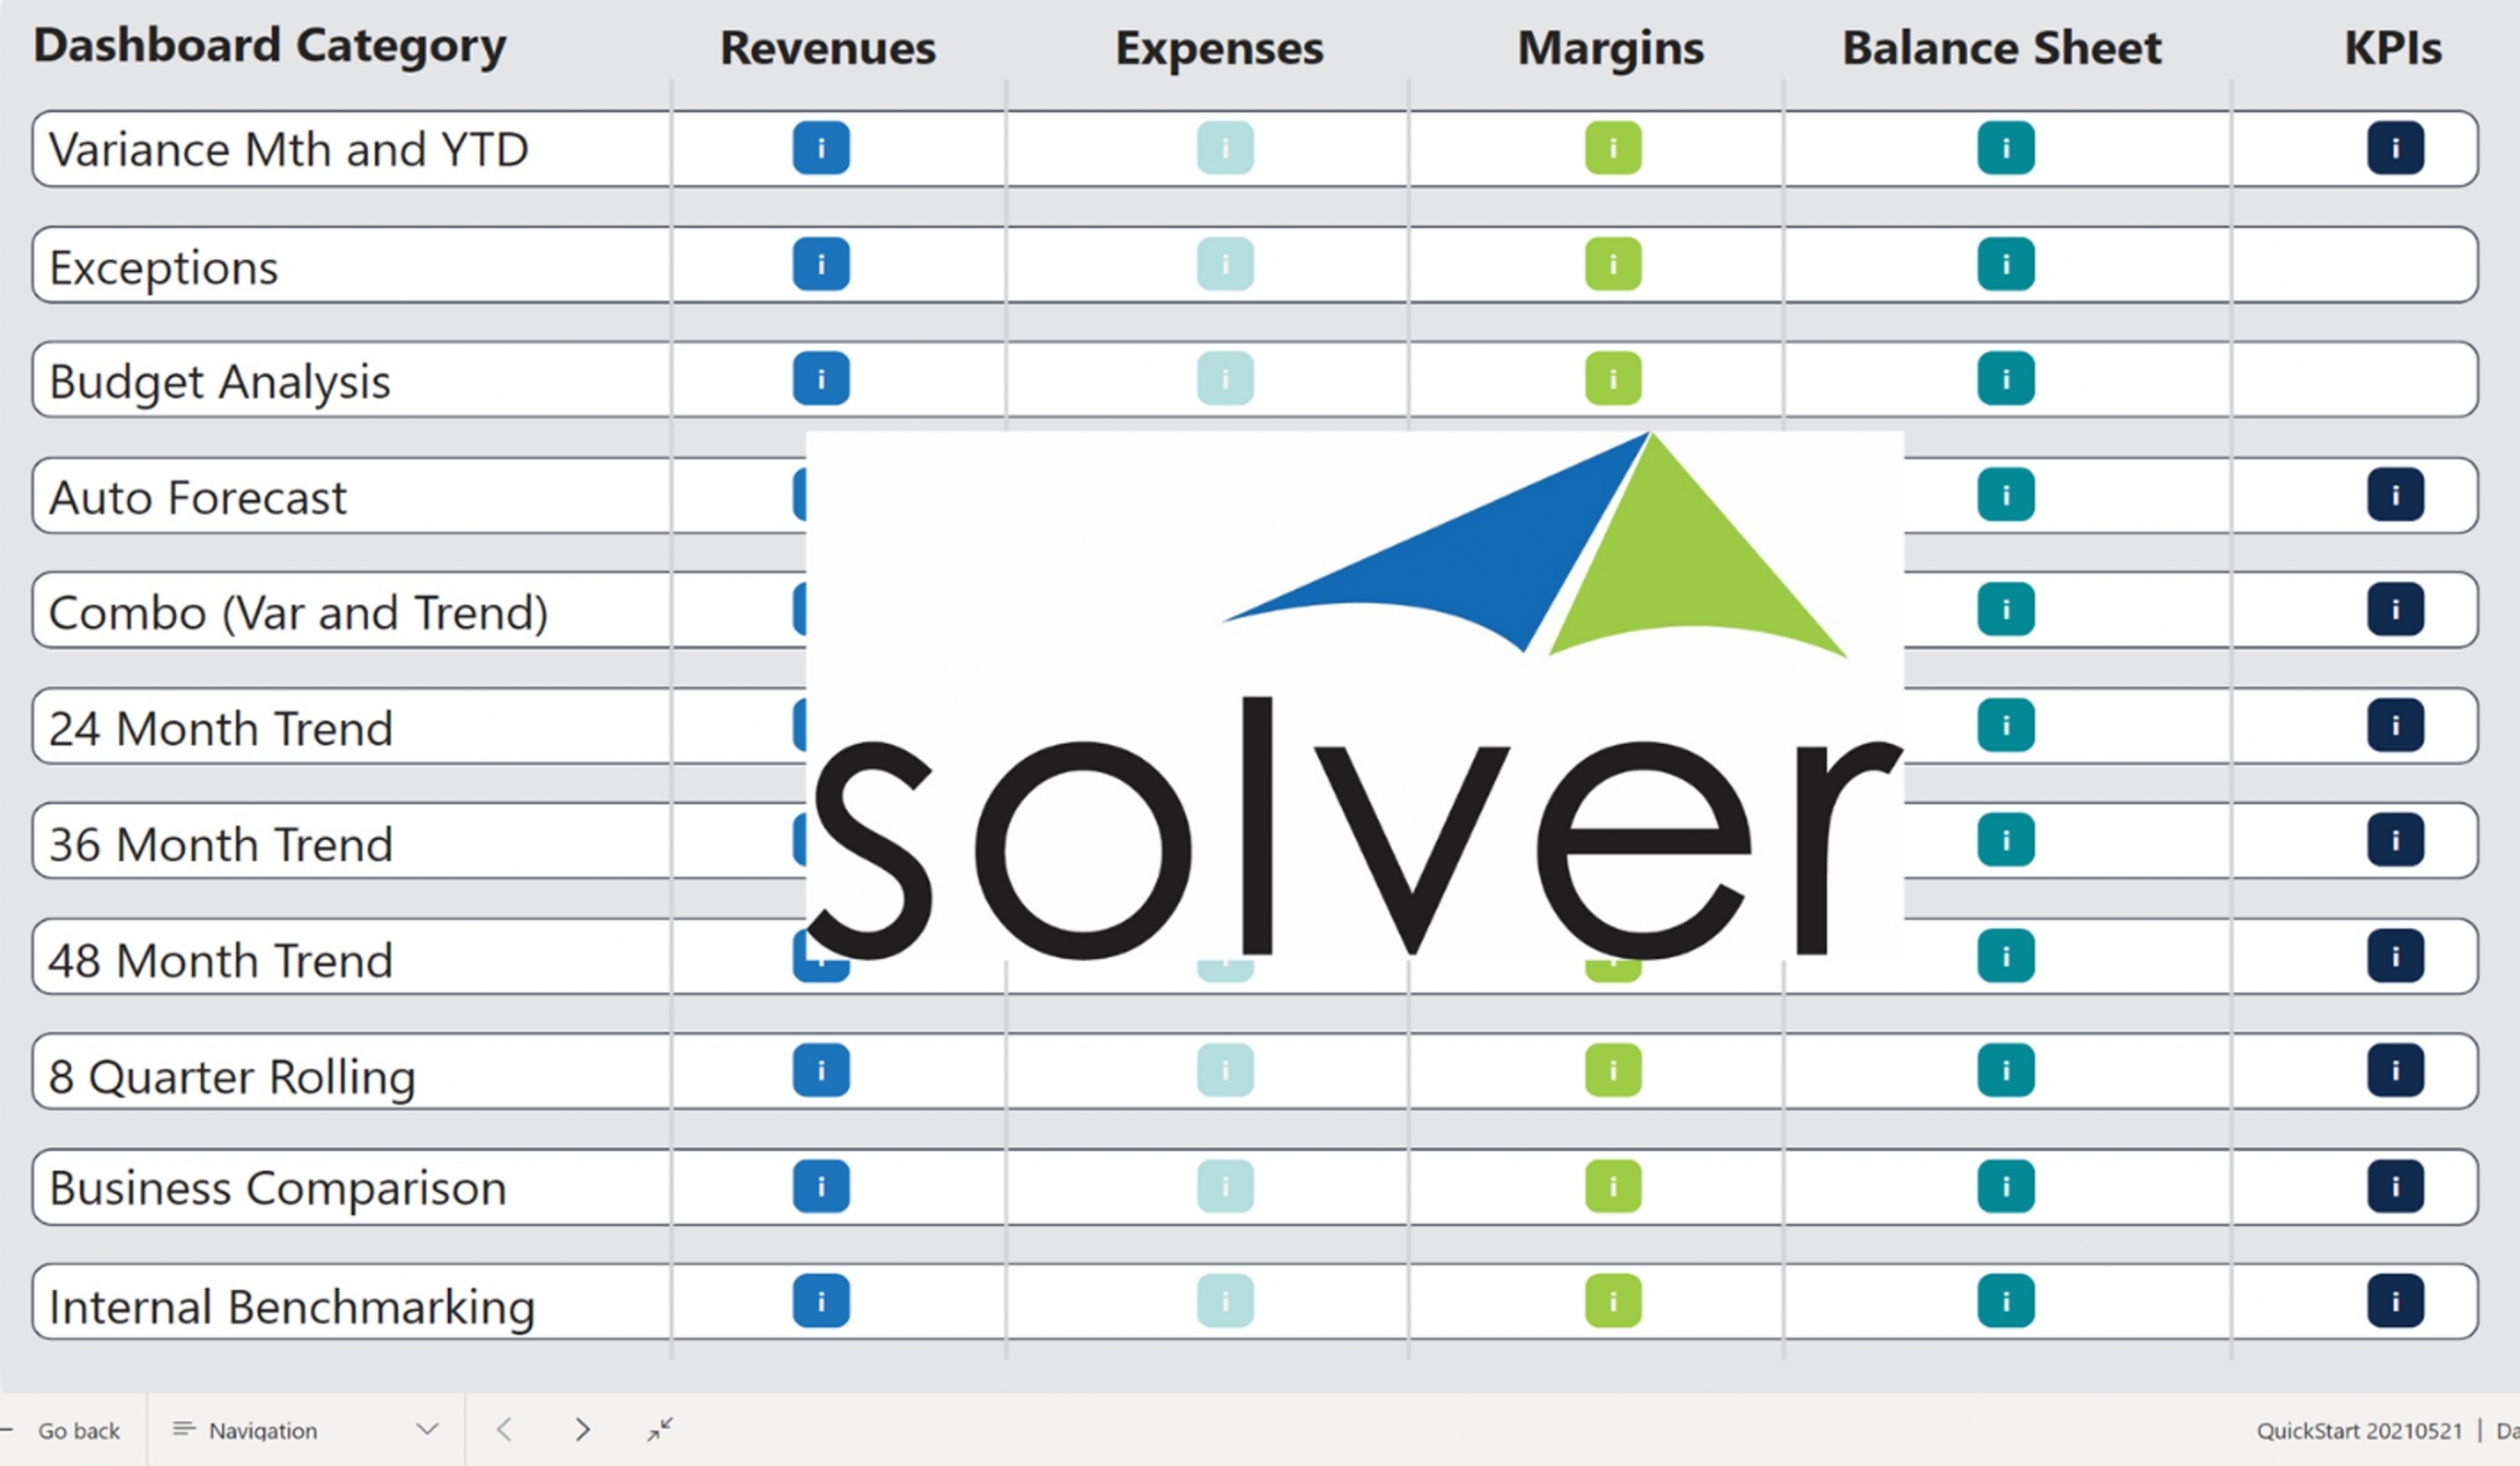
Solver’s QuickStart integration to Dynamics 365 Finance helps a company get up and running in a single day, providing access to more than 50 pre-built Power BI financial dashboards, as well as, additional financial reports and budget input templates. All these turn-key options are available from a marketplace that continuously expands with new templates.
A note about tools that offer integrations to Dynamics 365 Finance: While almost all dashboard vendors can claim to offer integrations to popular ERPs like D365 Finance, there can be big differences in the skill and effort involved to get such integrations ready and your financial data loaded into the visualization tool. Generally, there are three categories of integrations, each with its own level of effort during implementation:
- Usually gets you there: Generic integration tools that require a lot of skills and time to configure.
- Works but often with limitations: Connectors specifically built for D365 Finance, but do not include an app that configures dimensions and views in D365 Finance nor pre-maps to popular fields to “light them up” for its API.
- Quickest and easiest: Connectors specifically built for D365 Finance that include an app or script(s) that properly and automatically configure dimensions and views in D365 and expose them to its API. This results in a “clean” data model that Power BI can easily consume. You can see an example of this type of integration here.
What Is a Cloud Dashboard Marketplace and Why Is It Important to Your Business? While you are given a set of basic, embedded Power BI dashboards with Dynamics 365 Finance, most companies end up designing their own graphical reports using the stand-alone Power BI license. However, offering modern and flexible functionality that quickly delivers the dashboards your managers and executives need is often a pipe dream. There is at least one challenge that must be overcome: Somebody must design all those dashboards and learn the underlying formula language referred to as “DAX”. This can be painful, especially when you consider the time and cost involved. More so if your leaders are eager and want their dashboards sooner rather than later and without a big consulting bill attached. These days there is a growing trend for cloud business solutions to offer pre-built financial dashboards that are downloadable and ready-to-use from each vendor’s
marketplace. Typically, this involves a few clicks to install and refresh the report with your own data. The process is not that different from apps you download to your iPhone or Samsung phone. For example, in Solver’s Marketplace, users can download more than 50 pre-built financial dashboards that plug right into your Power BI web service in addition to Profit & Loss Reports, Balance Sheets and other financial statements and planning input templates.
 In other words, with true marketplace templates, you should be able to provide your managers with professional dashboards and reports
the same day you install the reporting tool--and with no upfront formula design or Power BI model building! Now that’s a quick deployment!
Summary For new or existing Dynamics 365 Finance customers, the 2020s hold a lot of promise. Microsoft is continuously improving and updating their ERP system, while a rapidly growing Appsource marketplace of third-party apps further enhances the benefits of D365 Finance. Picking the right solutions, like data visualization tools for dashboards as an example, can significantly improve your processes, save you time, and help drive faster and better decisions by putting the right information in front of your managers and executives when and where they need it.
In other words, with true marketplace templates, you should be able to provide your managers with professional dashboards and reports
the same day you install the reporting tool--and with no upfront formula design or Power BI model building! Now that’s a quick deployment!
Summary For new or existing Dynamics 365 Finance customers, the 2020s hold a lot of promise. Microsoft is continuously improving and updating their ERP system, while a rapidly growing Appsource marketplace of third-party apps further enhances the benefits of D365 Finance. Picking the right solutions, like data visualization tools for dashboards as an example, can significantly improve your processes, save you time, and help drive faster and better decisions by putting the right information in front of your managers and executives when and where they need it.

