Related Posts
- Workforce Efficiency Dashboard for SaaS Companies using Dynamics 365 Business Central
- Subscription Billing Auto Forecast for SaaS Companies using Dynamics 365 Business Central
- Pipeline Win Loss Dashboard for SaaS Companies using Dynamics 365 Business Central
- Headcount Dashboard for SaaS Companies using Dynamics 365 Business Central
- Top 50 Opportunities Report for SaaS Companies using Dynamics 365 BC
Operating Expense Dashboard for SaaS Companies using Dynamics 365 Business Central
Unlocking Efficiency: Modern Operating Expense Dashboards in SaaS Companies
In the fast-paced realm of SaaS, where agility and data-driven decision-making are paramount, the role of Chief Financial Officers (CFOs) and executives is more challenging than ever. The need for instant insights into operating expenses (OPEX) is critical to navigate the dynamic landscape. Enter Solver, a best-in-class Corporate Performance Management (CPM) solution that transforms the way SaaS companies manage their finances.Challenges Faced by SaaS Companies Without Modern Operating Expense Dashboards
- Lack of Self-Service Tools: Many SaaS companies struggle with the absence of user-friendly, self-service OPEX dashboards and reports. The reliance on cumbersome, manual Excel spreadsheets hampers the ability to promptly answer crucial financial queries.
- Delayed Decision-Making: Without real-time analytics, the decision-making process is often delayed. The absence of a centralized platform for OPEX analysis can lead to wrong decisions, impacting overall business performance.
- Dependency on Manual Spreadsheets: Managing OPEX trends and variances through manual spreadsheets is error-prone and time-consuming. It not only introduces the risk of inaccuracies but also obstructs the flow of timely and accurate information to key stakeholders.
Benefits of Modern Operating Expense Dashboards in SaaS Companies
- Exception Reporting: Solver's Operating Expense Dashboard provides exception reporting, allowing managers to swiftly identify and address anomalies, reducing the risk of financial oversights.
- Trend Analysis: With trend charts, the dashboard enables a comprehensive analysis of OPEX trends over time, aiding in proactive decision-making based on historical insights.
- Top 10 Expense Chart: The inclusion of a top 10 expense chart simplifies the process of identifying and focusing on the most significant contributors to expenses, streamlining managerial attention.
- Speedier Decision-Making: By offering a real-time, visual representation of OPEX data, the Operating Expense Dashboard empowers leaders to make critical decisions swiftly, fostering a more agile and responsive financial strategy.
About the Operating Expense Dashboard
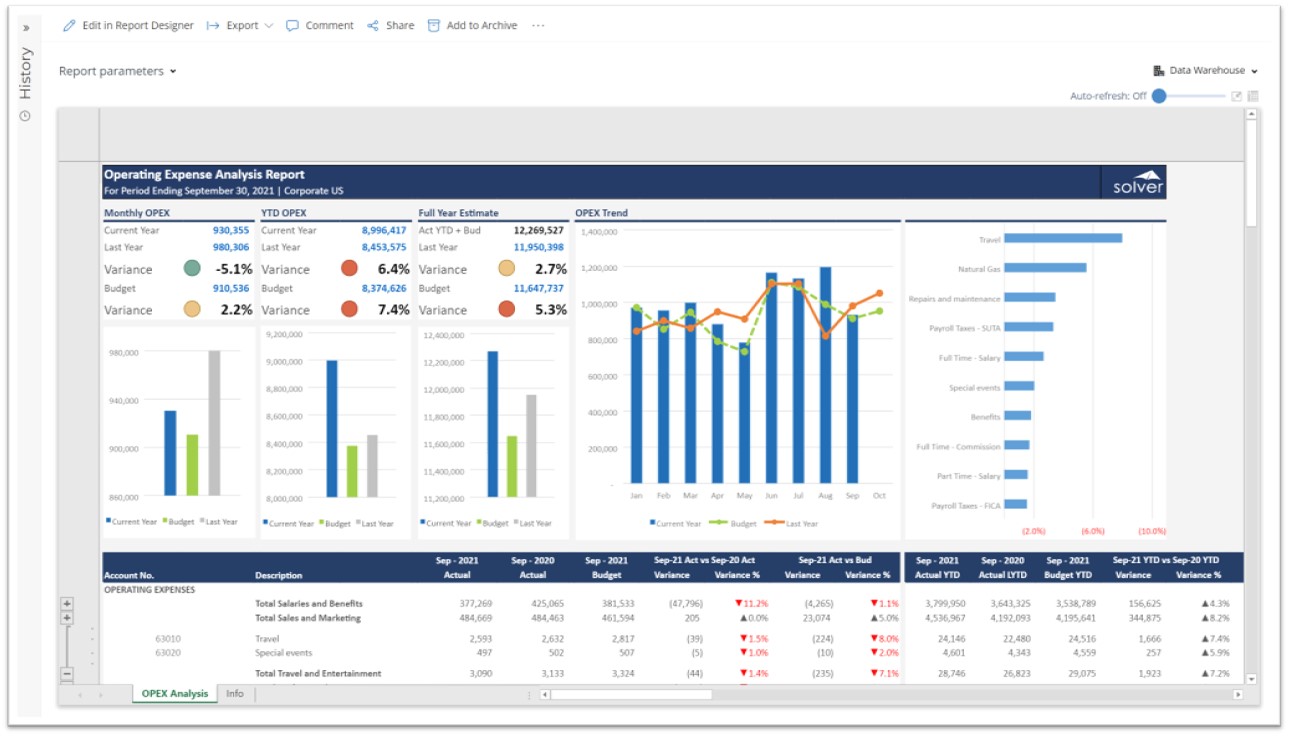
This report combines a dashboard layout with a detailed Operating Expense report grouped by expense category. It makes it easy to analyze monthly and year-to-date variances and trends and drill into the underlying GL transactions when needed. The chart on the far right shows a ranked list of the top actual vs budget expense variances for the current month.
For this and many other ready-to-use templates from Solver, visit our web-site Marketplace page and download the free SaaS eBook.

Operating Expense Dashboard for Dynamics 365 Business Central - Pre-built SaaS Template from Solver
Why Choose Solver's CPM Solution
In a landscape where every decision matters, Solver's CPM solution emerges as a transformative force. The Operating Expense Dashboard, with its combo layout and pre-built reports, provides a holistic view of OPEX figures and trends. The power and flexibility of this solution are evident in its ability to facilitate monthly, year-to-date, and full-year variance analysis, offering a comprehensive understanding of financial performance. In conclusion, Solver's CPM solution stands as a beacon for SaaS companies seeking to enhance their financial reporting, analysis, and budgeting. By investing in modern Operating Expense Dashboards, CFOs and executives can propel their organizations towards greater efficiency, data-driven insights, and ultimately, success in the competitive SaaS landscape.
Resources for Additional SaaS Reports, Dashboards and Budget Models
For more information about all the SaaS templates from Solver check out these resources:
- Solver SaaS model information and demonstration video
- Take a self-guided tour of the Solver FP&A suite
- Contact Solver for a personal demo or a quote
Solver is a global leader in Corporate Performance Management (CPM) and comes with out-of-the-box integrations to Microsoft Dynamics 365 Business Central and the Subscription Billing Suite from Binary Stream. Solver includes more than 150 reports, dashboards and budget templates for SaaS companies that provide in-depth analysis of subscription revenues, financials, human capital/payroll and CRM pipeline.
TAGS: ERP, Dashboards, Industry
Global Headquarters
Solver, Inc.
Phone: +1 (310) 691-5300
