Related Posts
- Workforce Efficiency Dashboard for SaaS Companies using Dynamics 365 Business Central
- Subscription Billing Auto Forecast for SaaS Companies using Dynamics 365 Business Central
- Pipeline Win Loss Dashboard for SaaS Companies using Dynamics 365 Business Central
- Headcount Dashboard for SaaS Companies using Dynamics 365 Business Central
- Top 50 Opportunities Report for SaaS Companies using Dynamics 365 BC
Net Burn Rate Dashboard for SaaS Companies using Dynamics 365 Business Central
Unlocking Financial Insights: The Power of Net Burn Rate Dashboards in SaaS Companies
In the dynamic landscape of Software as a Service (SaaS) companies, where agility and informed decision-making are paramount, having a comprehensive understanding of your financial health is a game-changer. A modern Corporate Performance Management (CPM) solution, such as Solver, is proving to be indispensable in providing executives, especially CFOs, with a robust Net Burn Rate Dashboard. This tool not only addresses the pain points commonly faced by SaaS companies but also propels them towards optimized liquidity planning and enhanced business performance.Challenges in the SaaS Financial Landscape
- Manual Excel Overload: Many SaaS companies grapple with the inefficiencies of managing Net Burn Rate through manual Excel spreadsheets. This not only consumes valuable time but increases the likelihood of errors, hindering timely and accurate decision-making.
- Poor or delayed Liquidity Insight: Cash and liquidity are critical metrics for most SaaS leaders constantly monitor. Without real time insight to Net Burn rate, the risk of a cash crunch is heightened.
- Lack of Self-Service Net Burn Rate Analysis: The absence of user-friendly, self-service Net Burn Rate analysis tools exacerbates the problem. Executives find themselves dependent on others for critical financial insights, leading to delays in decision-making.
Benefits of a Net Burn Rate Dashboard
- Real-Time Visibility: A Net Burn Rate Dashboard provides real-time visibility into key drivers such as Total Revenue and Gross Burn Rate. This empowers executives to make informed decisions on the fly, reducing the risk of delayed or misguided actions.
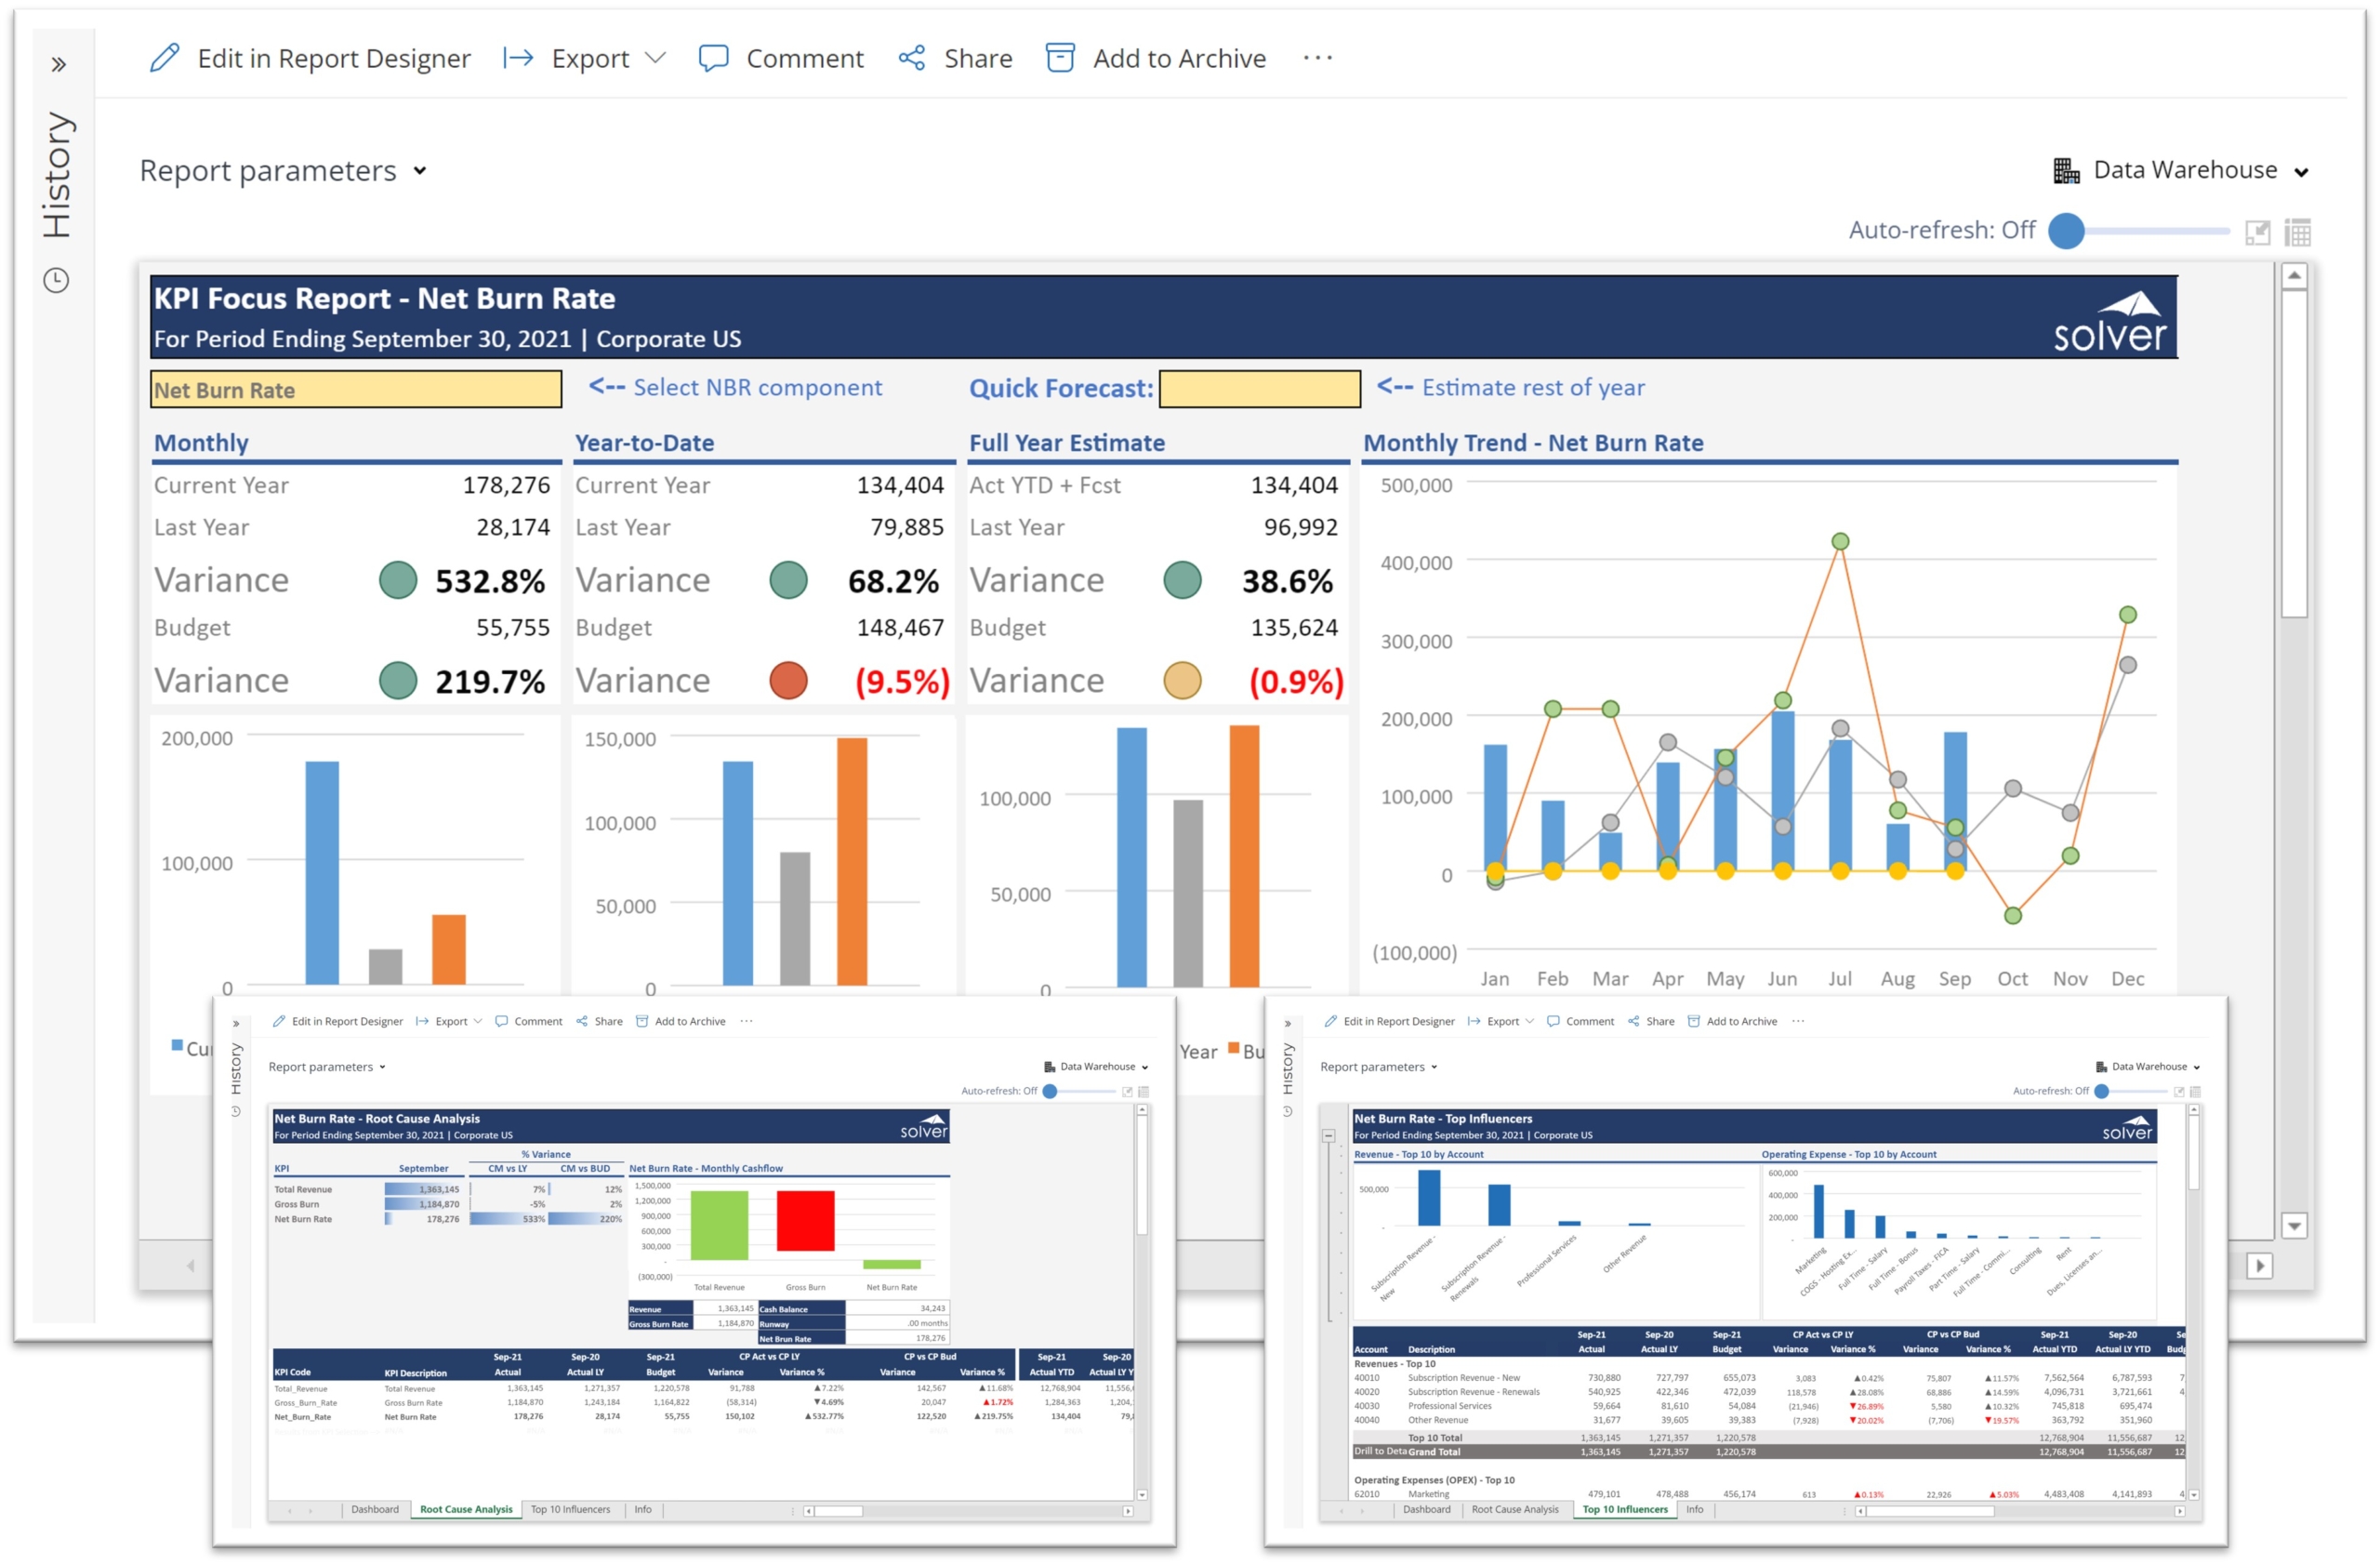
- Comprehensive Analysis: The Solver CPM solution offers a 3-page Net Burn Rate Dashboard, complete with monthly, Year-to-Date (YTD), and trend charts. A root-cause analysis page breaks down Net Burn Rate into Revenue and Gross Burn Rate components, offering a comprehensive understanding of the financial landscape.
- Strategic Insights: The Top 10 report included in the dashboard highlights the top revenues and operating expenses for a given period, offering strategic insights that aid in optimizing financial performance.
About the Net Burn Rate Dashboard
The Net Burn Rate dashboard consists of 3 tabs: Tab 1 provides a dashboard where the user can analyze monthly and YTD variances as well as trends for Net Burn Rate and its components (chosen from a drop-down list). Tab 2 shows root cause analysis for Total Revenue, Gross Burn Rate and Net Burn Rate with a waterfall chart as well as a detailed report. Tab 3 shows charts and ranked lists with Top Revenues by GL account and Top Expenses by GL Account.
For this and many other ready-to-use templates from Solver, visit our web-site Marketplace page and download the free SaaS eBook.

Net Burn Rate Dashboard for Dynamics 365 Business Central - Pre-built SaaS Template from Solver
Why Choose Solver CPM
In a world where speed, accuracy, and seamless integration are key, Solver's CPM solution emerges as a beacon for SaaS companies. The Net Burn Rate Dashboard, alongside 150+ pre-built reports and templates, exemplifies the power and flexibility of the Solver solution. By automating and streamlining reporting, analysis, and budgeting, Solver equips SaaS leaders with the tools they need to navigate the complex financial terrain confidently. In conclusion, for CFOs and executives seeking to reduce errors, accelerate decision-making, and implement a unified cloud solution, Solver's CPM solution is a strategic choice. The Net Burn Rate Dashboard, with its user-friendly interface and comprehensive insights, is a testament to Solver's commitment to empowering SaaS companies to not only survive but thrive in today's competitive landscape.
Resources for Additional SaaS Reports, Dashboards and Budget Models
For more information about all the SaaS templates from Solver check out these resources:
- Solver SaaS model information and demonstration video
- Take a self-guided tour of the Solver FP&A suite
- Contact Solver for a personal demo or a quote
About Solver
Solver is a global leader in Corporate Performance Management (CPM) and comes with out-of-the-box integrations to Microsoft Dynamics 365 Business Central and the Subscription Billing Suite from Binary Stream. Solver includes more than 150 reports, dashboards and budget templates for SaaS companies that provide in-depth analysis of subscription revenues, financials, human capital/payroll and CRM pipeline.
TAGS: ERP, Dashboards, Industry
Global Headquarters
Solver, Inc.
Phone: +1 (310) 691-5300
