Related Posts
- Workforce Efficiency Dashboard for SaaS Companies using Dynamics 365 Business Central
- Subscription Billing Auto Forecast for SaaS Companies using Dynamics 365 Business Central
- Pipeline Win Loss Dashboard for SaaS Companies using Dynamics 365 Business Central
- Headcount Dashboard for SaaS Companies using Dynamics 365 Business Central
- Top 50 Opportunities Report for SaaS Companies using Dynamics 365 BC
Months to Recover CAC Dashboard for SaaS Companies using Dynamics 365 Business Central
Unlocking Strategic Insights: How Solver's MRCAC Dashboard Transforms SaaS Financial Management
In the dynamic landscape of Software as a Service (SaaS) companies, where agility and data-driven decisions are paramount, the role of a Chief Financial Officer (CFO) is increasingly challenging. Addressing the need for sharper financial analysis, Solver's Months to Recover Customer Acquisition Cost (MRCAC) Dashboard, integrated into their Corporate Performance Management (CPM) solution, emerges as a game-changer. This innovative dashboard provides CFOs and executives with an intuitive and comprehensive tool to navigate the complexities of MRCAC, aiding in more informed decision-making.The Pain Points of Manual MRCAC Analysis
- Lack of Self-Service Tools: Many SaaS companies grapple with the absence of user-friendly self-service MRCAC analysis. Traditional approaches often demand specialized expertise, slowing down the decision-making process.
- Excel Spreadsheet Overload: Manual tracking of MRCAC through Excel spreadsheets is not only time-consuming but prone to errors. The inefficiency in consolidating data from different sources can lead to delays and inaccuracies in decision-making.
- Complex KPI Drivers: Understanding the components of MRCAC, such as Gross Margin, Average Revenue Per Account (ARPA), and Customer Acquisition Cost (CAC), becomes cumbersome. This complexity hampers the ability to identify and address issues promptly.
Transformative Benefits of Solver's MRCAC Dashboard
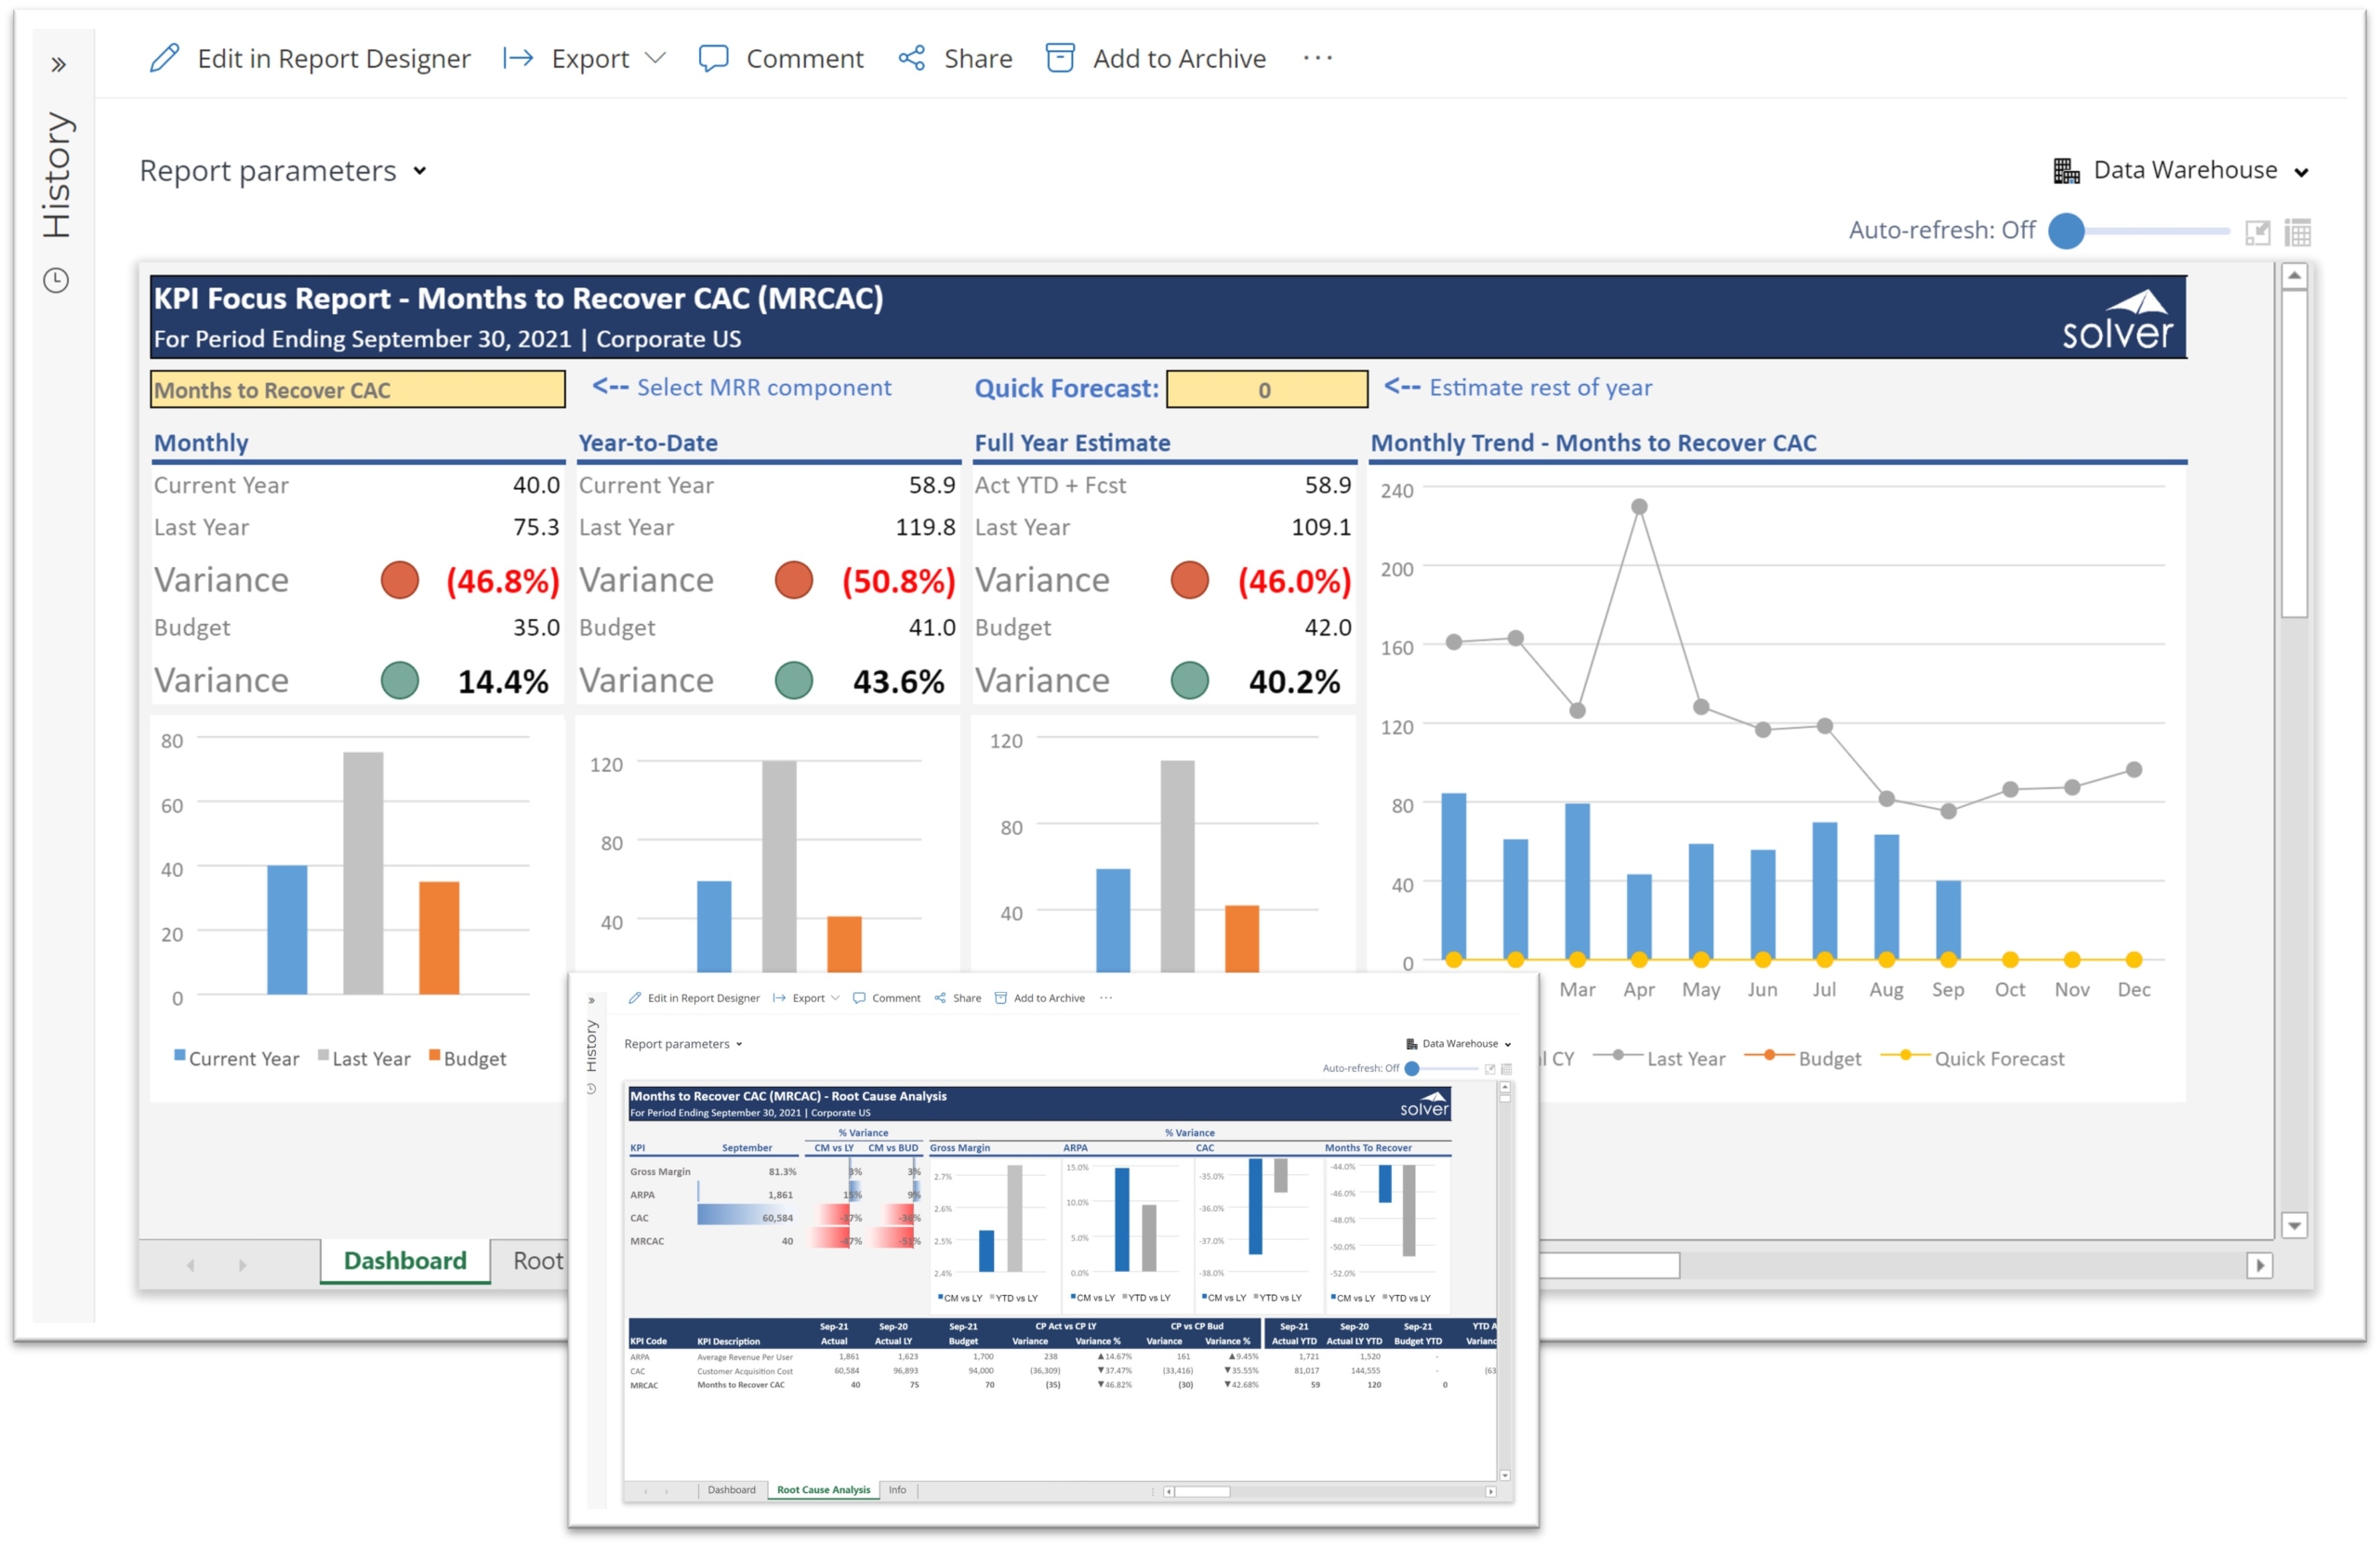
- Holistic Overview: Solver's MRCAC Dashboard offers a 360-degree view of the MRCAC ratio. With key figures and monthly, Year-to-Date (YTD), and trend charts, executives gain an immediate understanding of the health of this critical metric.
- Root-Cause Analysis: The dashboard goes beyond surface-level insights by providing a root-cause page. This breakdown into Gross Margin, ARPA, and CAC enables executives to pinpoint specific areas for improvement, facilitating strategic decision-making.
- Automation for Efficiency: By eliminating the reliance on manual spreadsheets, Solver's solution streamlines the entire MRCAC analysis process. This not only accelerates decision-making but also ensures accuracy in financial reporting.
About the Months to Recover CAC Dashboard
The Months to Recover CAC (MRCAC) report has 2 tabs: Tab 1 provides a dashboard where the user can analyze monthly and YTD variances as well as trends for MRCAC and its components (chosen from a drop-down list). Tab 2 shows root cause analysis for Gross Margin, ARPA, CAC and MRCAC with four variance charts as well as a detailed report.
For this and many other ready-to-use templates from Solver, visit our web-site Marketplace page and download the free SaaS eBook.

Months to Recover CAC Dashboard for Dynamics 365 Business Central - Pre-built SaaS Template from Solver
Why Choose Solver for Comprehensive Financial Management
In considering Solver for your financial reporting, analysis, and budgeting needs, you're not just adopting a tool; you're embracing a holistic solution. Solver's CPM platform, equipped with over 150 pre-built reports, dashboards, and budgeting templates, is designed to empower SaaS companies. The MRCAC Dashboard is a testament to Solver's commitment to providing actionable insights, allowing CFOs and executives to proactively manage sales, pricing, ROI, and liquidity. In conclusion, Solver's MRCAC Dashboard isn't merely a dashboard; it's a catalyst for strategic transformation. By addressing the pain points of manual MRCAC analysis and offering transformative benefits, Solver's CPM solution emerges as a reliable ally in navigating the complex financial landscape of SaaS companies. Embrace the power of informed decision-making, backed by Solver's intuitive and insightful tools.
Resources for Additional SaaS Reports, Dashboards and Budget Models
For more information about all the SaaS templates from Solver check out these resources:
- Solver SaaS model information and demonstration video
- Take a self-guided tour of the Solver FP&A suite
- Contact Solver for a personal demo or a quote
About Solver
Solver is a global leader in Corporate Performance Management (CPM) and comes with out-of-the-box integrations to Microsoft Dynamics 365 Business Central and the Subscription Billing Suite from Binary Stream. Solver includes more than 150 reports, dashboards and budget templates for SaaS companies that provide in-depth analysis of subscription revenues, financials, human capital/payroll and CRM pipeline.
TAGS: ERP, Dashboards, Industry
Global Headquarters
Solver, Inc.
Phone: +1 (310) 691-5300
