Written by Nils R. | Dec 23, 2020 8:00:00 AM
What is
a
Materials Usage Variance Report for a Manufacturing Company
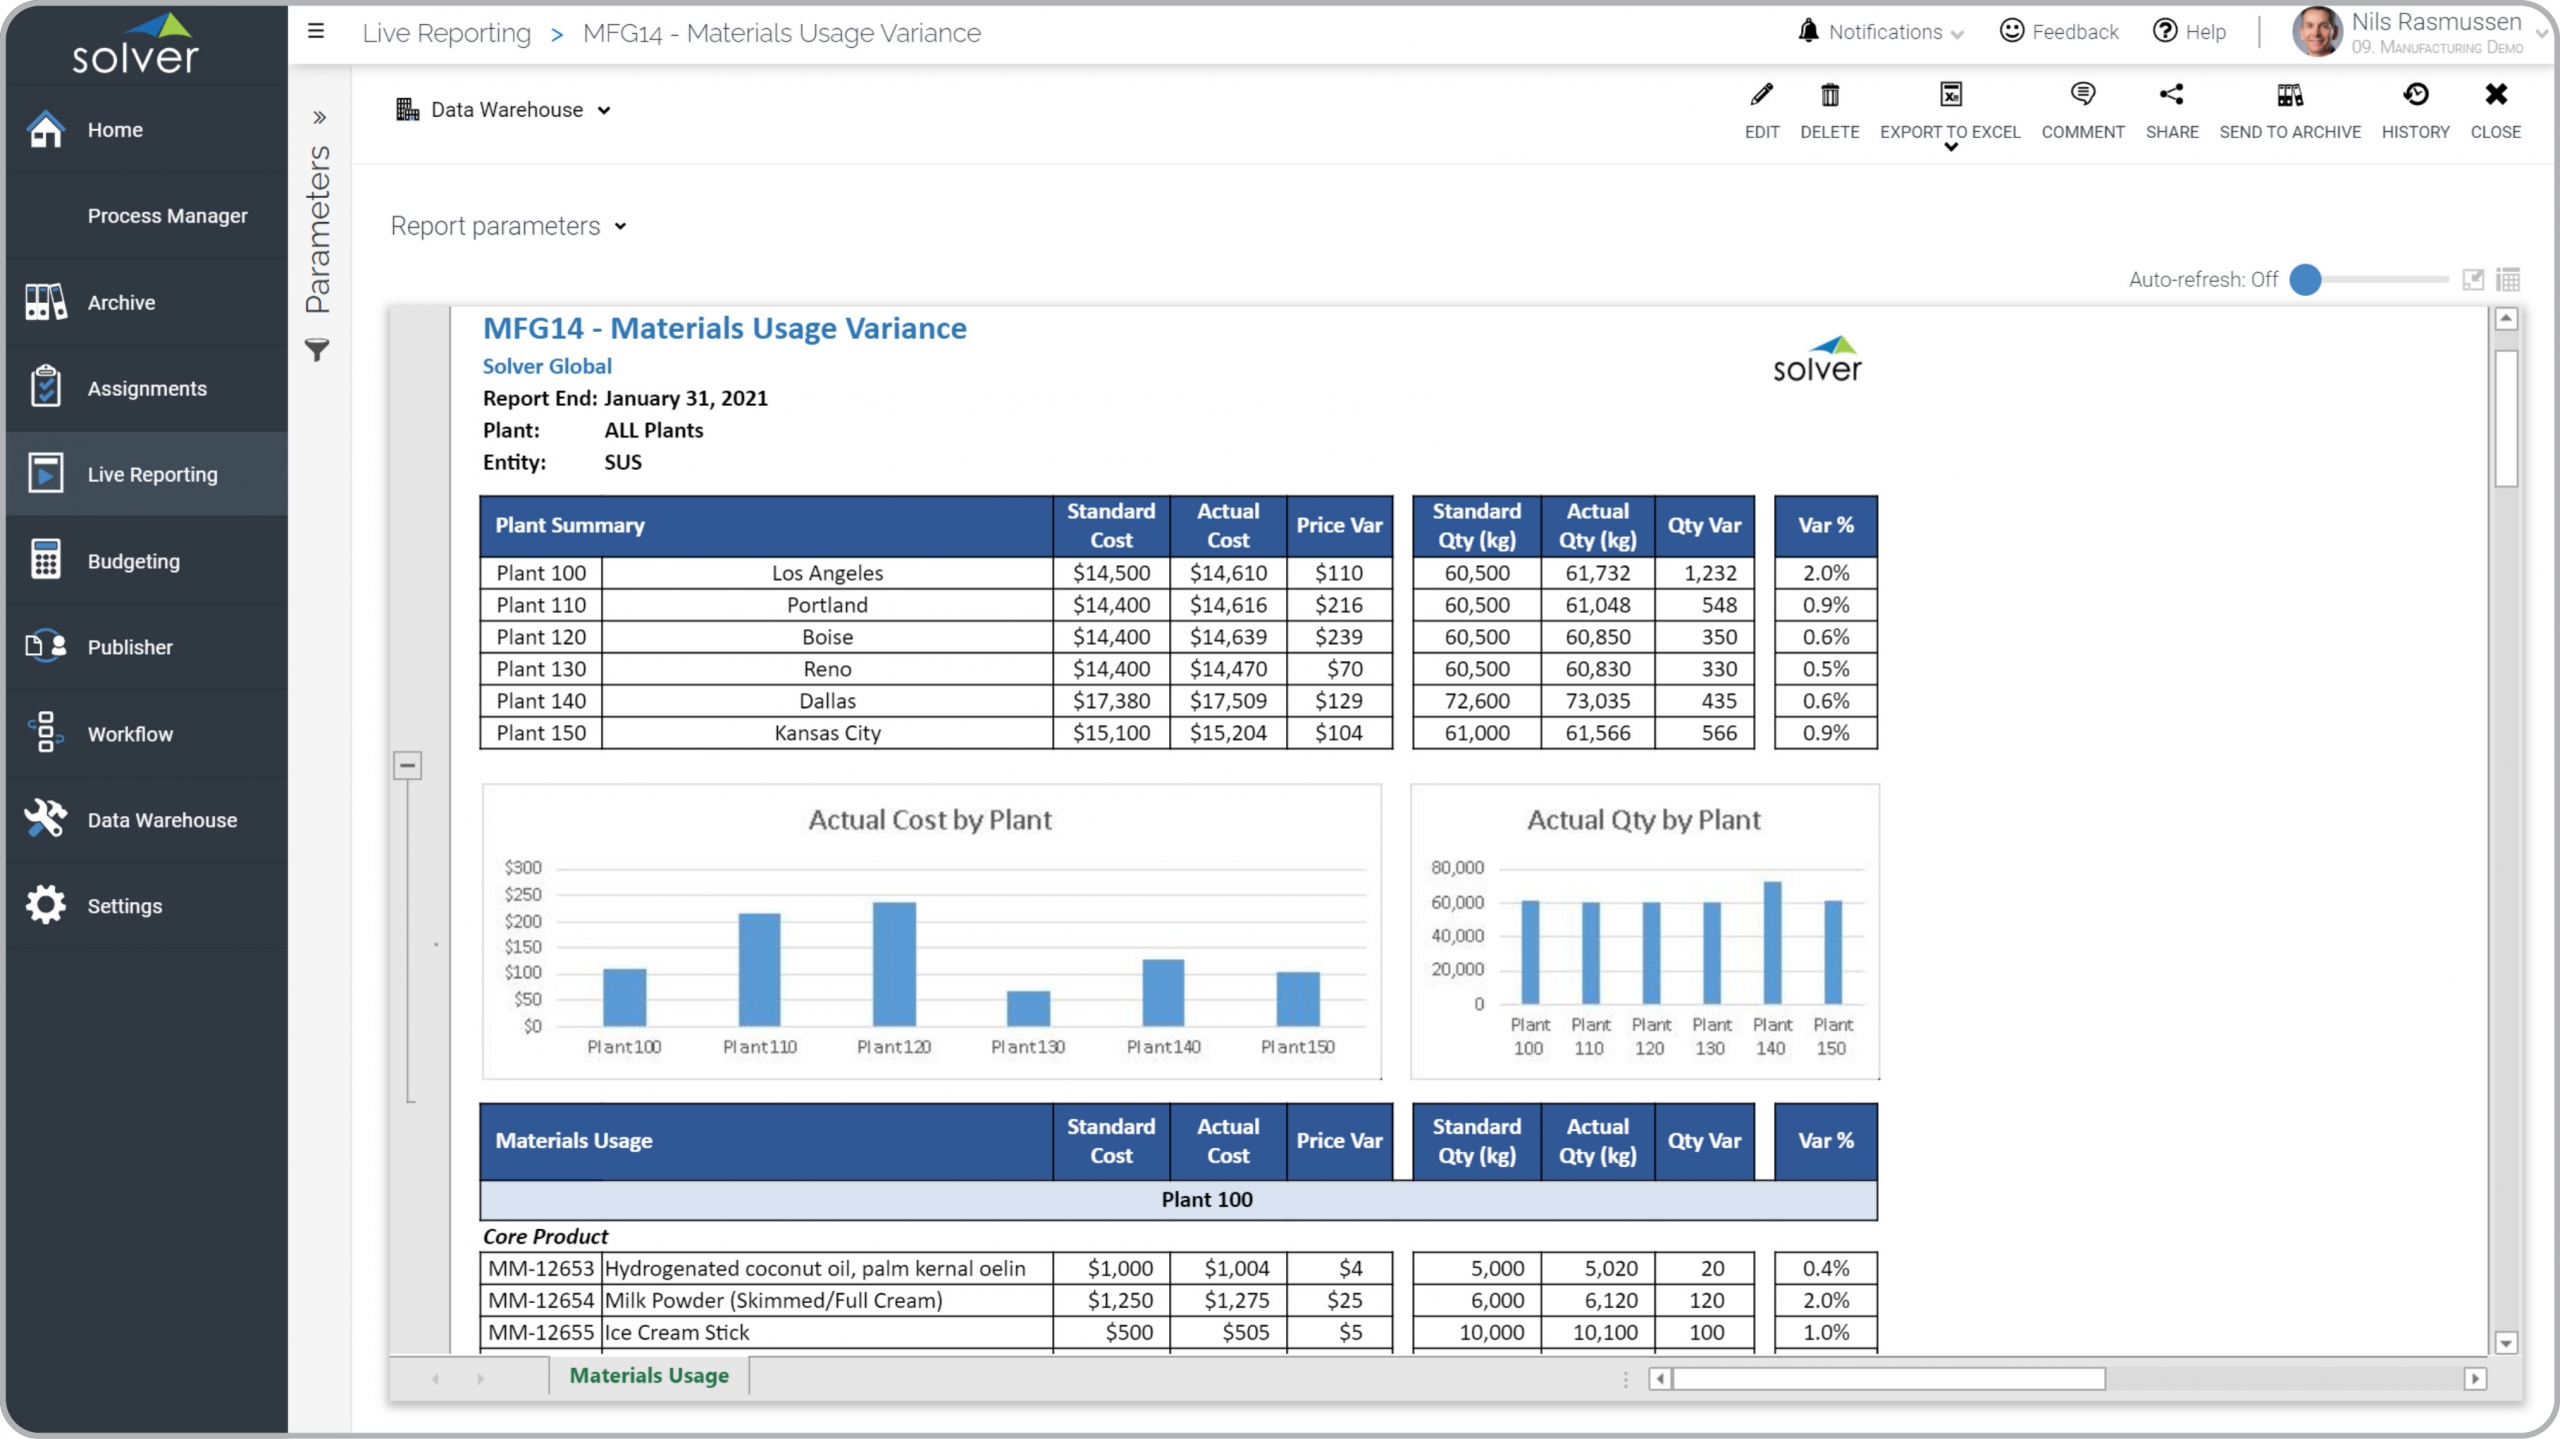
? Materials usage reports are considered production analysis reports and are used by production- and plant managers to review actual versus standard costs and quantities for core products that their plants produce. Some of the main functionality in this type of report is that it displays a summary with comparison charts for all plants on the top of the report and then it shows details by individual plant and core products below. The columns shows Standard Cost, Actual Cost and Variance. Following that you see Standard Quantity, Actual Quantity and Variance You find an example of this type of report below.
Purpose of
Materials Variance Reports Manufacturers use Materials Variance Reports to improve product decisions by easily analyzing and comparing actual and standard materials costs and quantities across products as well as plants. When used as part of good business practices in a Production department, an organization can improve its production efficiency and data collection as well as reduce the chances that a lack of benchmarking and analysis leads to competitive disadvantages.
Materials Variance Report
Example Here is an example of a Materials Variance Report with costing and quantity comparisons by product and plant. [caption id="" align="alignnone" width="2560"]
Example of a Materials Usage Variance Report for a Manufacturing Company[/caption] You can find hundreds of additional examples
here
Who Uses This Type of
Report
? The typical users of this type of report are: Production managers, product managers.
Other
Report
s Often Used in Conjunction with
Materials Variance Reports Progressive Production departments sometimes use several different Materials Variance Reports, along with production dashboards, inventory reports, costing reports, benchmark dashboards and other management and control tools.
Where Does the Data for Analysis Originate From? The Actual (historical transactions) data typically comes from enterprise resource planning (ERP) systems like: Microsoft Dynamics 365 (D365) Finance, Microsoft Dynamics 365 Business Central (D365 BC), Microsoft Dynamics AX, Microsoft Dynamics NAV, Microsoft Dynamics GP, Microsoft Dynamics SL, Sage Intacct, Sage 100, Sage 300, Sage 500, Sage X3, SAP Business One, SAP ByDesign, Acumatica, Netsuite and others. In analyses where budgets or forecasts are used, the planning data most often originates from in-house Excel spreadsheet models or from professional corporate performance management (CPM/EPM) solutions.
What Tools are Typically used for Reporting, Planning and Dashboards? Examples of business software used with the data and ERPs mentioned above are:
- Native ERP report writers and query tools
- Spreadsheets (for example Microsoft Excel)
- Corporate Performance Management (CPM) tools (for example Solver)
- Dashboards (for example Microsoft Power BI and Tableau)
Corporate Performance Management (CPM) Cloud Solutions and More Examples
Learn More About Solver CPM For Manufacturing