Written by Nils R. | Feb 13, 2021 8:00:00 AM
What is
a
n
Enrollment by School Analysis
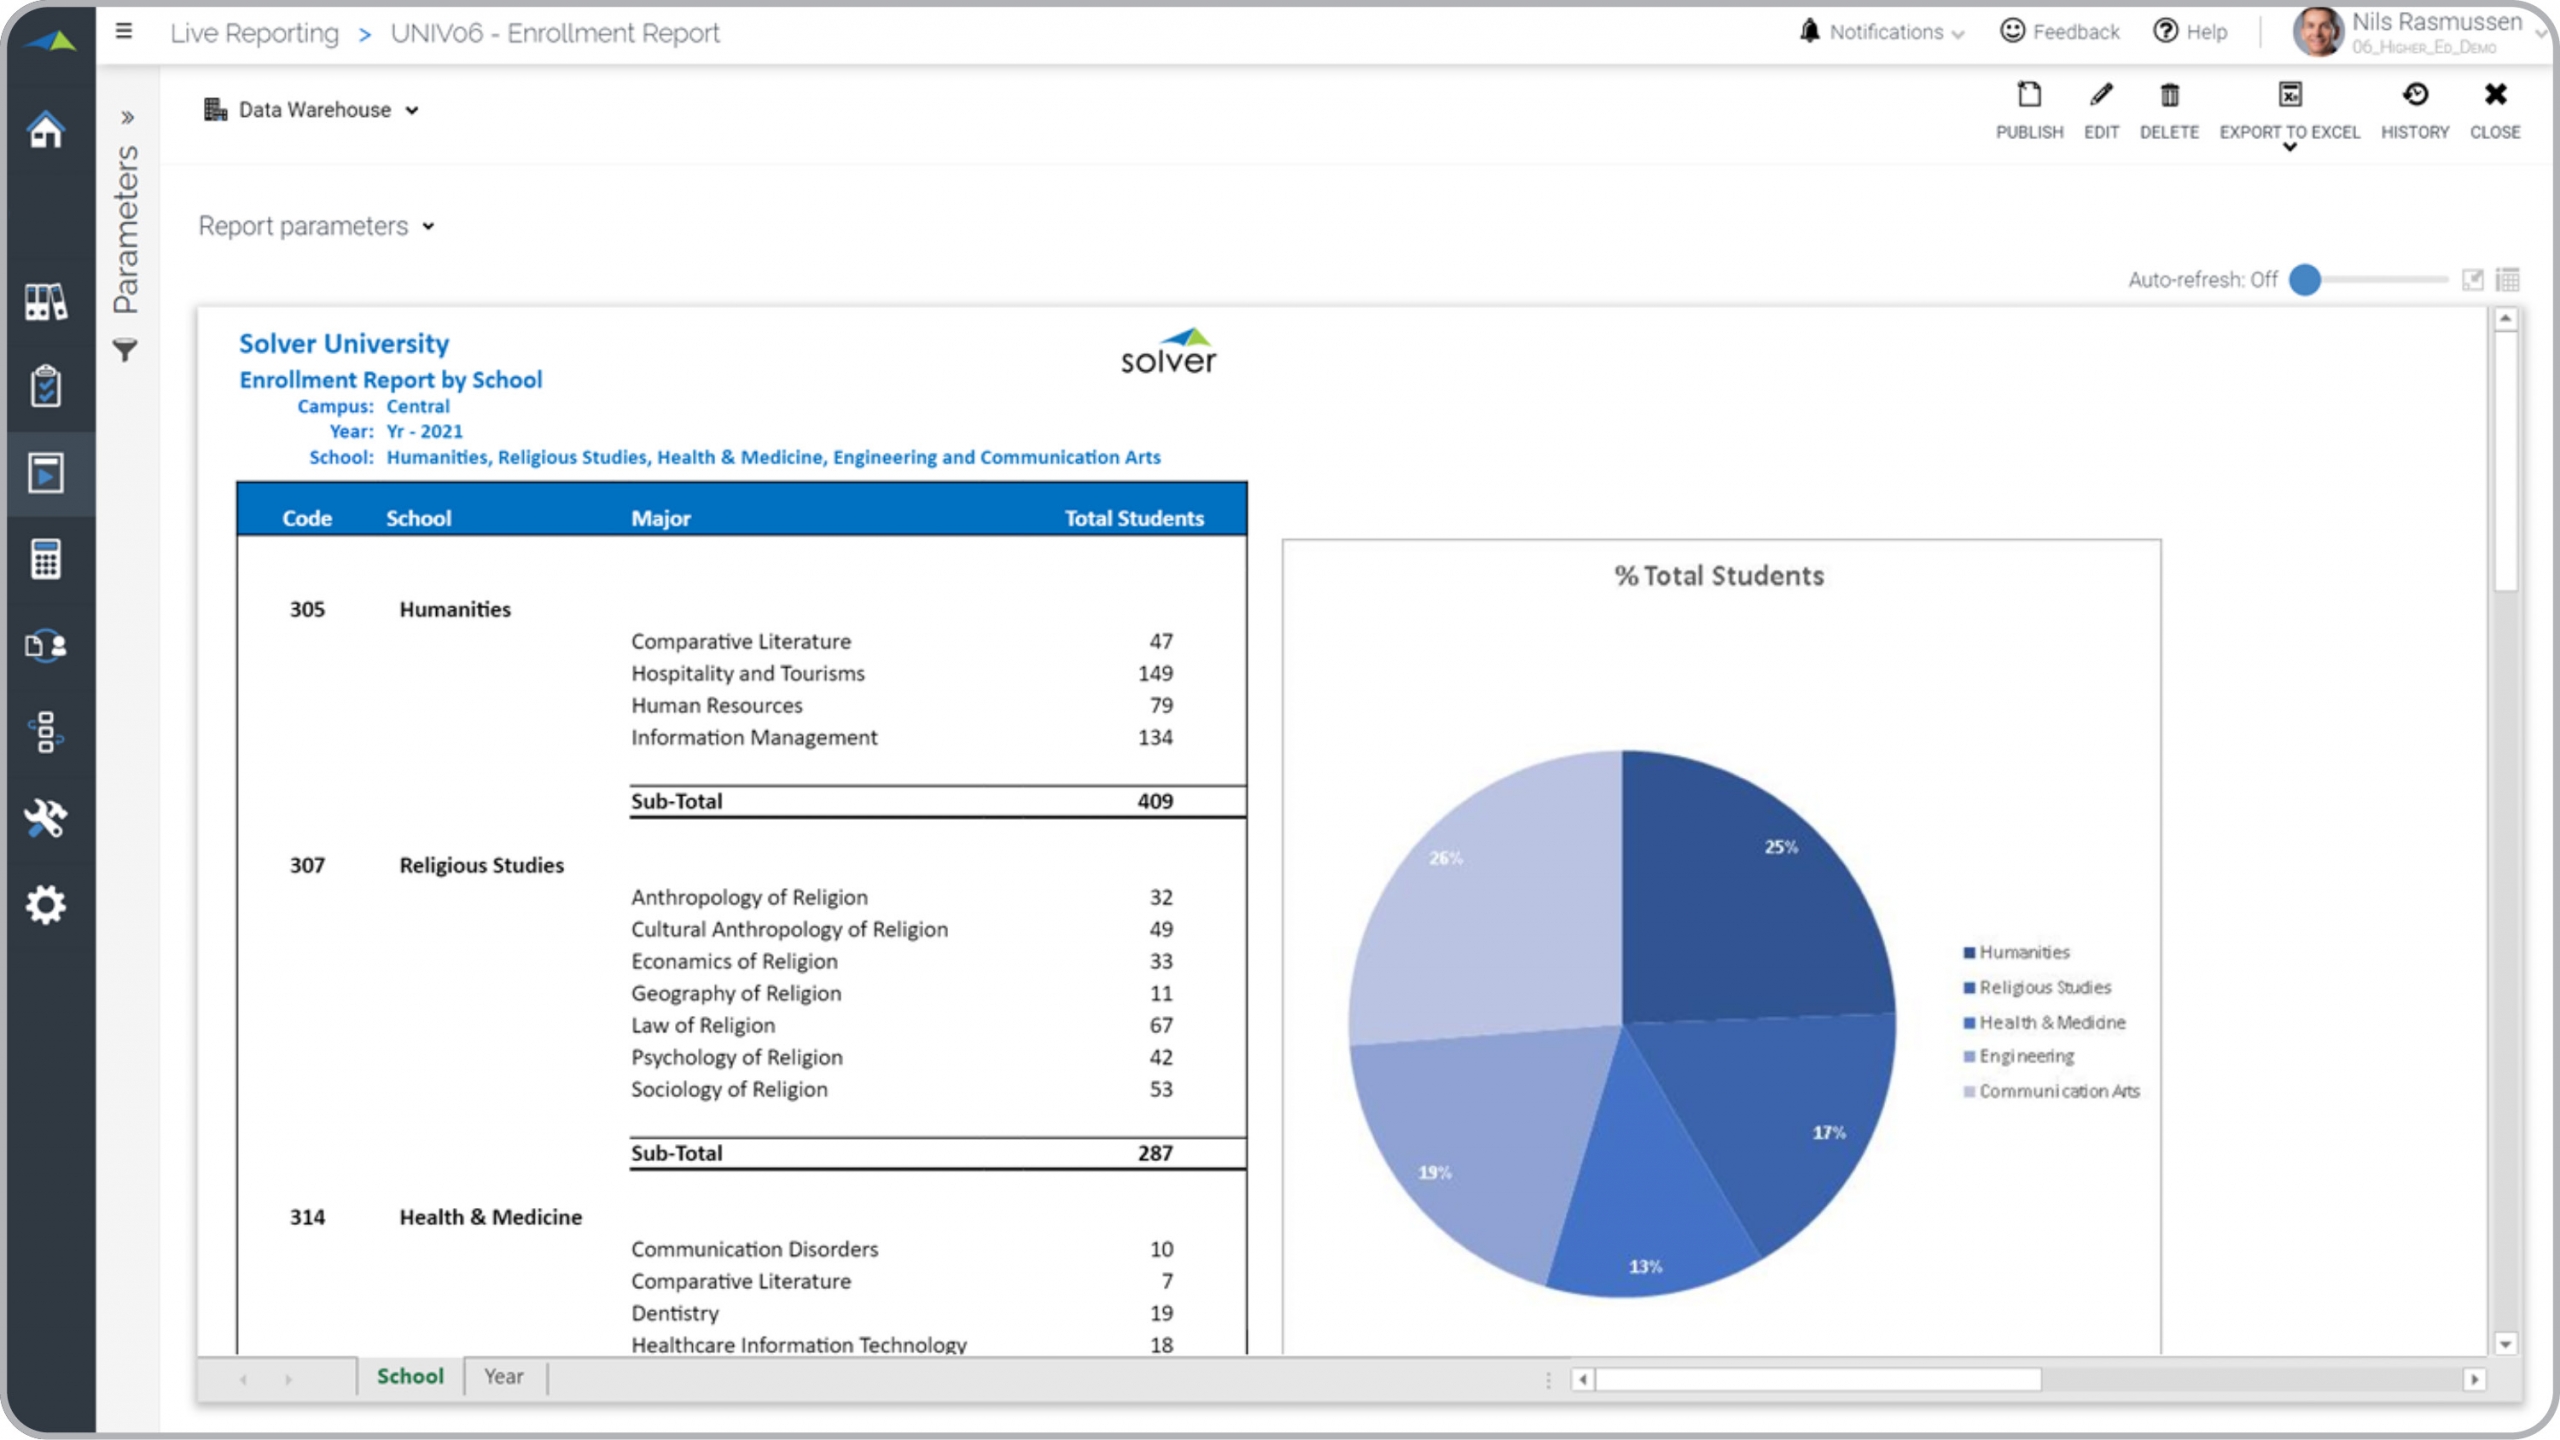
Report? Student Enrollment Reports are considered statistical analysis tools and are used by enrollment officers to monitor the enrolled student population by semester/quarter/year and by school. Some of the main functionality in this type of report is that it uses data from the student information system and can be filtered based on parameters such as school and semester (quarter). The example shows the number of enrolled students by school with sub-totals and a grand total. The pie chart helps compare each school's enrollment to each other. You find an example of this type of report below.
Purpose of
Student Enrollment Reports Universities and colleges use Student Enrollment Reports to provide officers and other staff with an easy, self-service method to analyze student enrolled during any given academic year. When used as part of good business practices in a Student Recruiting and Enrollment department, a higher education institution can improve its strategies and initiatives related to student recruiting, retention as well as associated financial planning, and it can reduce the chances that employees make inferior decisions because they lack quick and easy access to these key statistics.
Student Enrollment Report
Example Here is an example of a Student Enrollment Report with count by school and graphical analysis. [caption id="" align="alignnone" width="2560"]
Higher Education Reporting - Enrollment by School Example[/caption] You can find hundreds of additional examples
here
Who Uses This Type of
Report
? The typical users of this type of report are: University Board Members, Dean of Students, Enrollment Officers, Recruiting Managers, Planners.
Other
Report
s Often Used in Conjunction with
Student Enrollment Reports Progressive Student Recruiting and Enrollment departments sometimes use several different Student Enrollment Reports, along with student dashboards, KPI dashboards, tuition revenue budgets, recruiting dashboards and other management and control tools.
Where Does the Data for Analysis Originate From? The Actual (historical transactions) data typically comes from student information systems integrated with enterprise resource planning (ERP) systems like: Microsoft Dynamics 365 (D365) Finance, Microsoft Dynamics 365 Business Central (D365 BC), Microsoft Dynamics AX, Microsoft Dynamics NAV, Microsoft Dynamics GP, Microsoft Dynamics SL, Sage Intacct, Sage 100, Sage 300, Sage 500, Sage X3, SAP Business One, SAP ByDesign, Acumatica, Netsuite and others. In analyses where budgets or forecasts are used, the planning data most often originates from in-house Excel spreadsheet models or from professional corporate performance management (CPM/EPM) solutions.
What Tools are Typically used for Reporting, Planning and Dashboards? Examples of business software used with the data and ERPs mentioned above are:
- Native ERP report writers and query tools
- Spreadsheets (for example Microsoft Excel)
- Corporate Performance Management (CPM) tools (for example Solver)
- Dashboards (for example Microsoft Power BI and Tableau)
Corporate Performance Management (CPM) Cloud Solutions and More Examples