

What is a
Fund Budget Comparison Report
? Budget Reports with fund comparisons are considered budget review and analysis tools and are used by Financial Managers and Budget Officers to explore approved fund budgets. Some of the main functionality in this type of budget report is that it dynamically displays revenue and expense accounts (object codes) with sub-totals and it lists all selected funds across the columns with a consolidated total. Each column lists the budget for a specific fund. The report can be run for any budget version and set of funds. You find an example of this type of budget report below.
Purpose of
Budget Reports with Funds Listed Side-by-Side Public Sector organizations use Budget Reports with Funds Listed Side-by-Side to easily compare budgets across funds and analyze interesting differences. When used as part of good business practices in Planning and Accounting departments, a government entity can improve its budget accuracy as well as review consolidated totals, and it can reduce the chances that there are undetected issues or errors in individual fund budgets.
Example of a
Budget Reports with Funds Listed Side-by-Sid
e Here is an example of a Fund Budget Report with revenue and expenditures as well as consolidated budgets across all funds. [caption id="" align="alignnone" width="2560"]
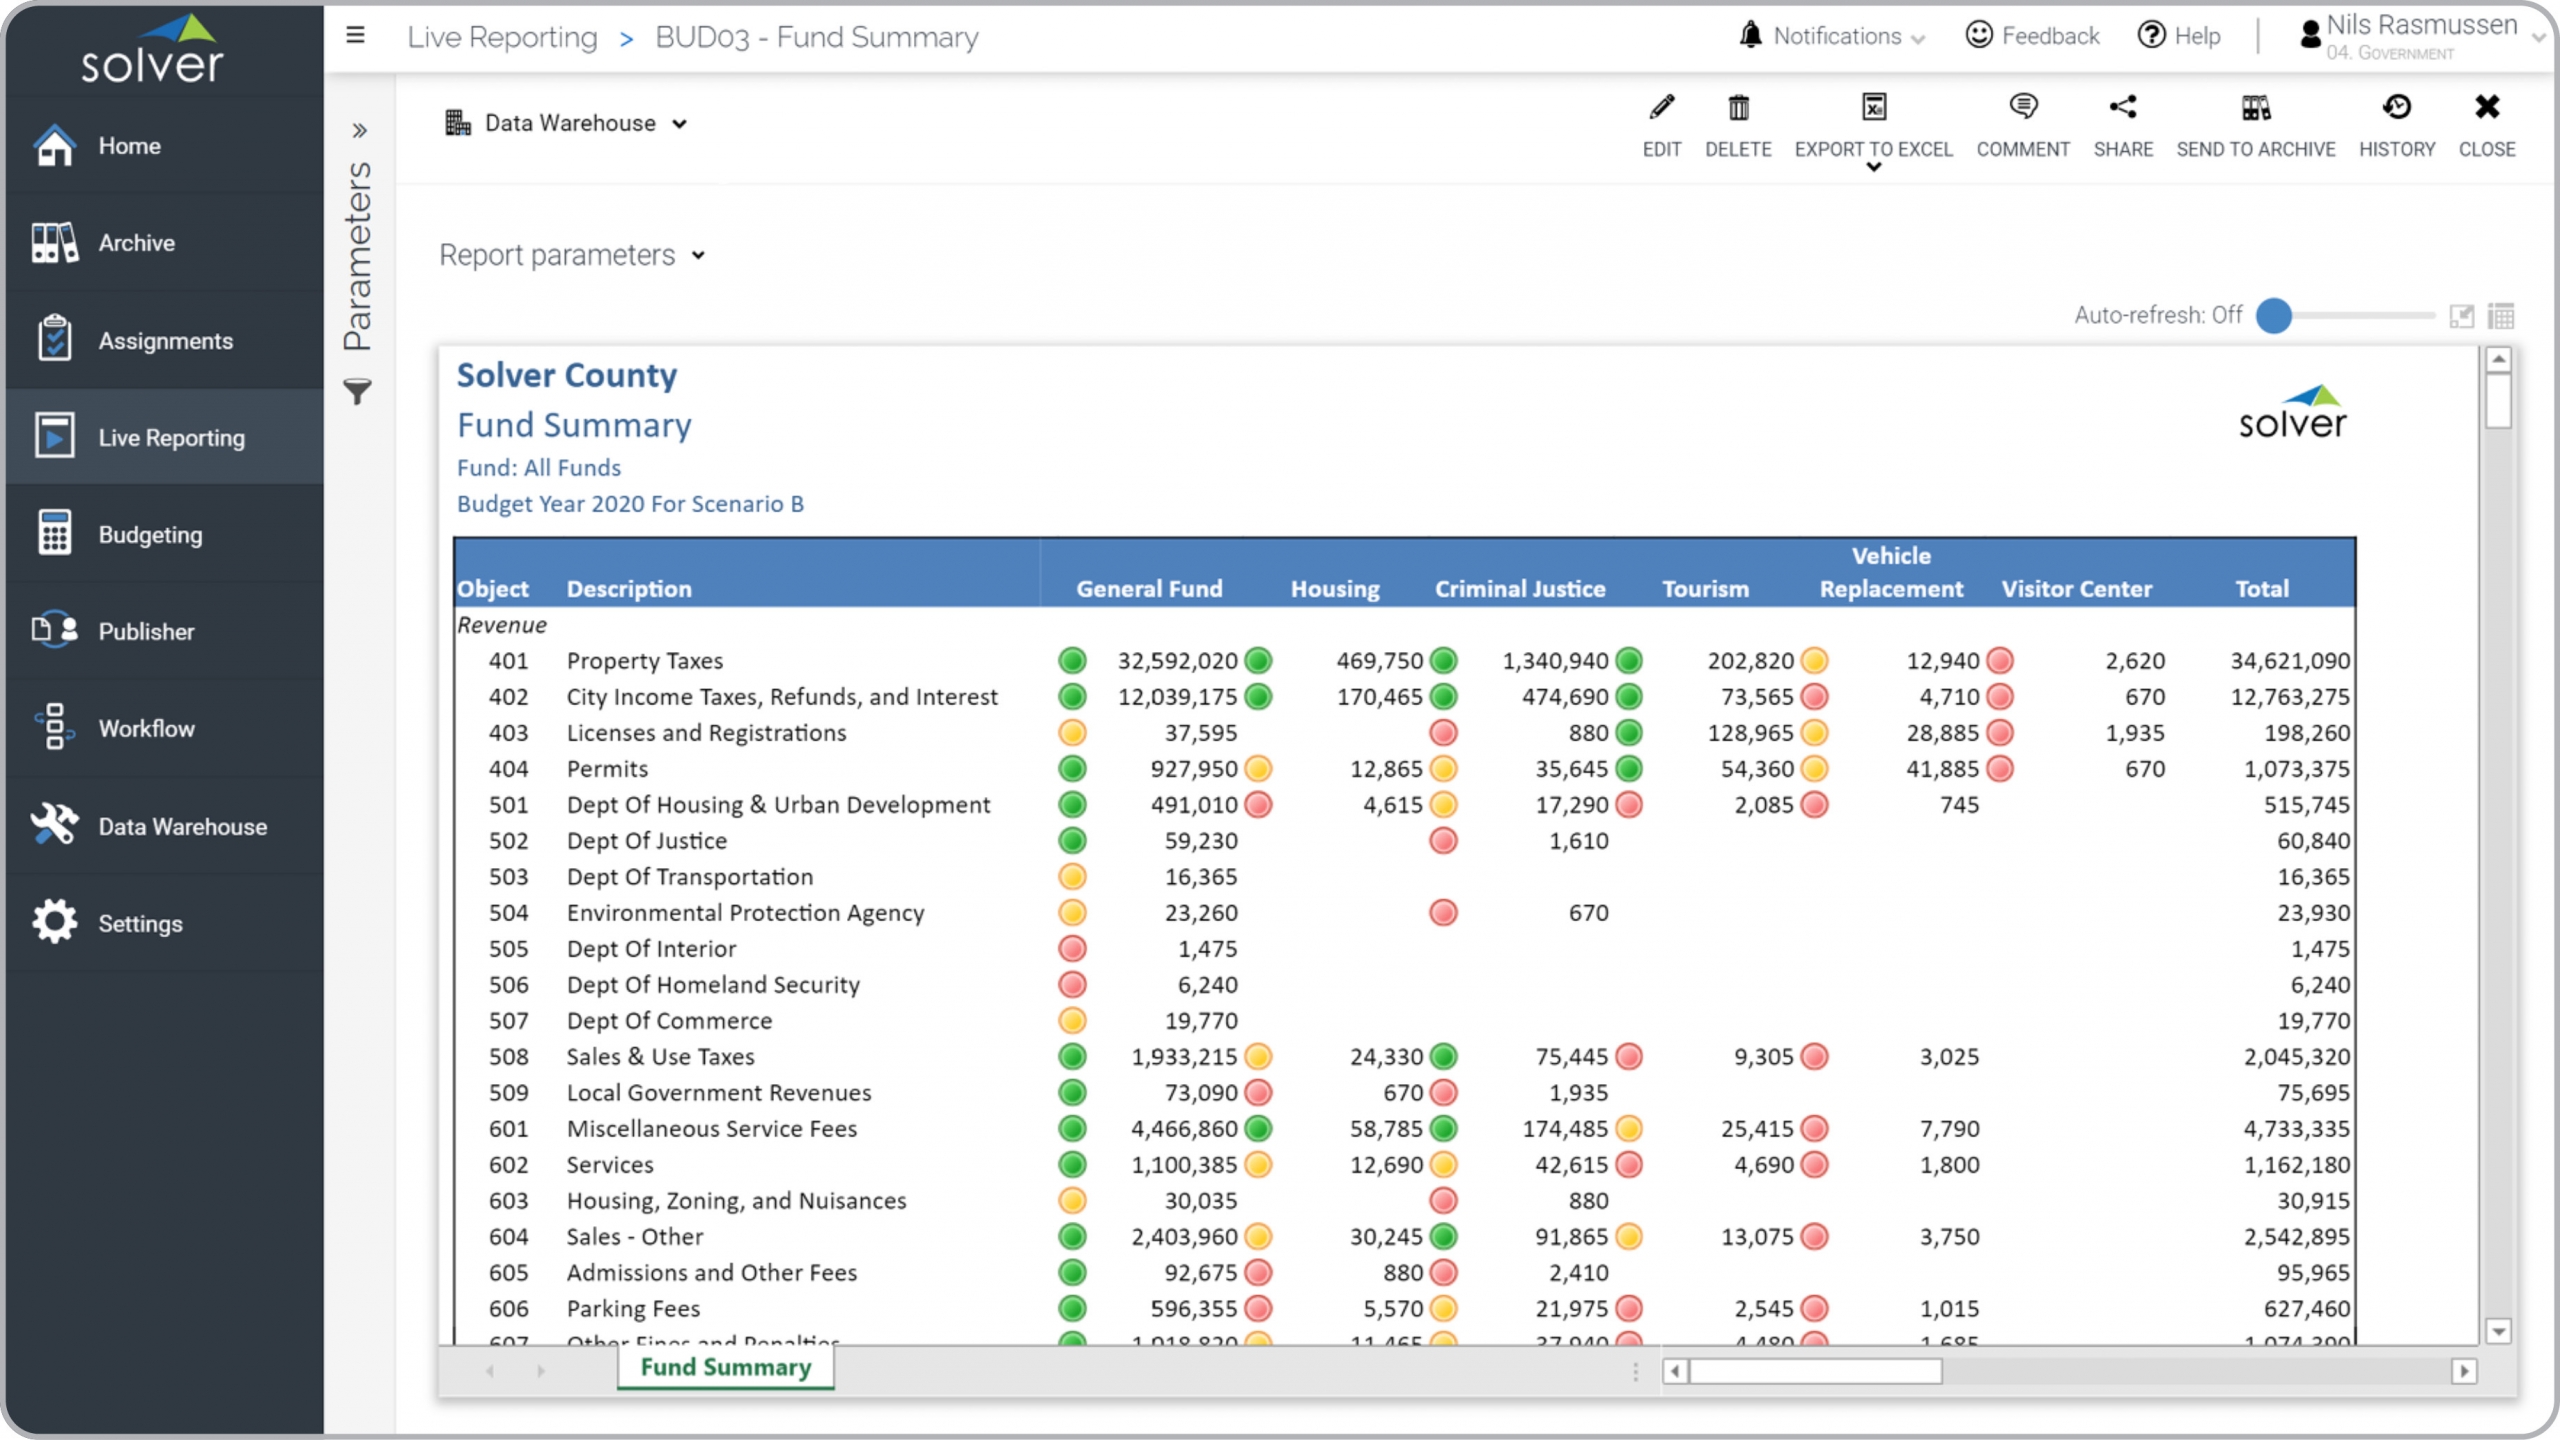 Example of a Fund Budget Comparison Report for Public Sector Organizations[/caption] You can find hundreds of additional examples
here
Who Uses This Type of
Budget report
? The typical users of this type of budget report are: CFOs, budget officers, controllers.
Other Reports Often Used in Conjunction with
Budget Reports with Funds Listed Side-by-Side Progressive Planning and Accounting departments sometimes use several different Budget Reports with Funds Listed Side-by-Side, along with employee budgets, capex budgets, line item detail for revenues and expenses, financial budget dashboards, annual budget report packages and other management and control tools.
Where Does the Data for Analysis Originate From? The Actual (historical transactions) data typically comes from enterprise resource planning (ERP) systems like: Microsoft Dynamics 365 (D365) Finance, Microsoft Dynamics 365 Business Central (D365 BC), Microsoft Dynamics AX, Microsoft Dynamics NAV, Microsoft Dynamics GP, Microsoft Dynamics SL, Sage Intacct, Sage 100, Sage 300, Sage 500, Sage X3, SAP Business One, SAP ByDesign, Acumatica, Netsuite and others. In analyses where budgets or forecasts are used, the planning data most often originates from in-house Excel spreadsheet models or from professional corporate performance management (CPM/EPM) solutions.
What Tools are Typically used for Reporting, Planning and Dashboards? Examples of business software used with the data and ERPs mentioned above are:
Example of a Fund Budget Comparison Report for Public Sector Organizations[/caption] You can find hundreds of additional examples
here
Who Uses This Type of
Budget report
? The typical users of this type of budget report are: CFOs, budget officers, controllers.
Other Reports Often Used in Conjunction with
Budget Reports with Funds Listed Side-by-Side Progressive Planning and Accounting departments sometimes use several different Budget Reports with Funds Listed Side-by-Side, along with employee budgets, capex budgets, line item detail for revenues and expenses, financial budget dashboards, annual budget report packages and other management and control tools.
Where Does the Data for Analysis Originate From? The Actual (historical transactions) data typically comes from enterprise resource planning (ERP) systems like: Microsoft Dynamics 365 (D365) Finance, Microsoft Dynamics 365 Business Central (D365 BC), Microsoft Dynamics AX, Microsoft Dynamics NAV, Microsoft Dynamics GP, Microsoft Dynamics SL, Sage Intacct, Sage 100, Sage 300, Sage 500, Sage X3, SAP Business One, SAP ByDesign, Acumatica, Netsuite and others. In analyses where budgets or forecasts are used, the planning data most often originates from in-house Excel spreadsheet models or from professional corporate performance management (CPM/EPM) solutions.
What Tools are Typically used for Reporting, Planning and Dashboards? Examples of business software used with the data and ERPs mentioned above are:
- Native ERP report writers and query tools
- Spreadsheets (for example Microsoft Excel)
- Corporate Performance Management (CPM) tools (for example Solver)
- Dashboards (for example Microsoft Power BI and Tableau)
- View 100’s of reporting, consolidations, planning, budgeting, forecasting and dashboard examples here
- View a Public Sector white paper and other industry-specific information here
- See how reports are designed in a modern report writer using a cloud-connected Excel add-in writer
- Discover how the Solver CPM solution delivers financial and operational reporting
- Discover how the Solver CPM solution delivers planning, budgeting and forecasting
- Watch demo videos of reporting, planning and dashboards
TAGS: Reporting, Planning, Forecasting, Budgeting, CPM, ERP, Financial Reporting, Template Library