Accounts Receivable Report with Dynamic Aging Buckets for Acumatica
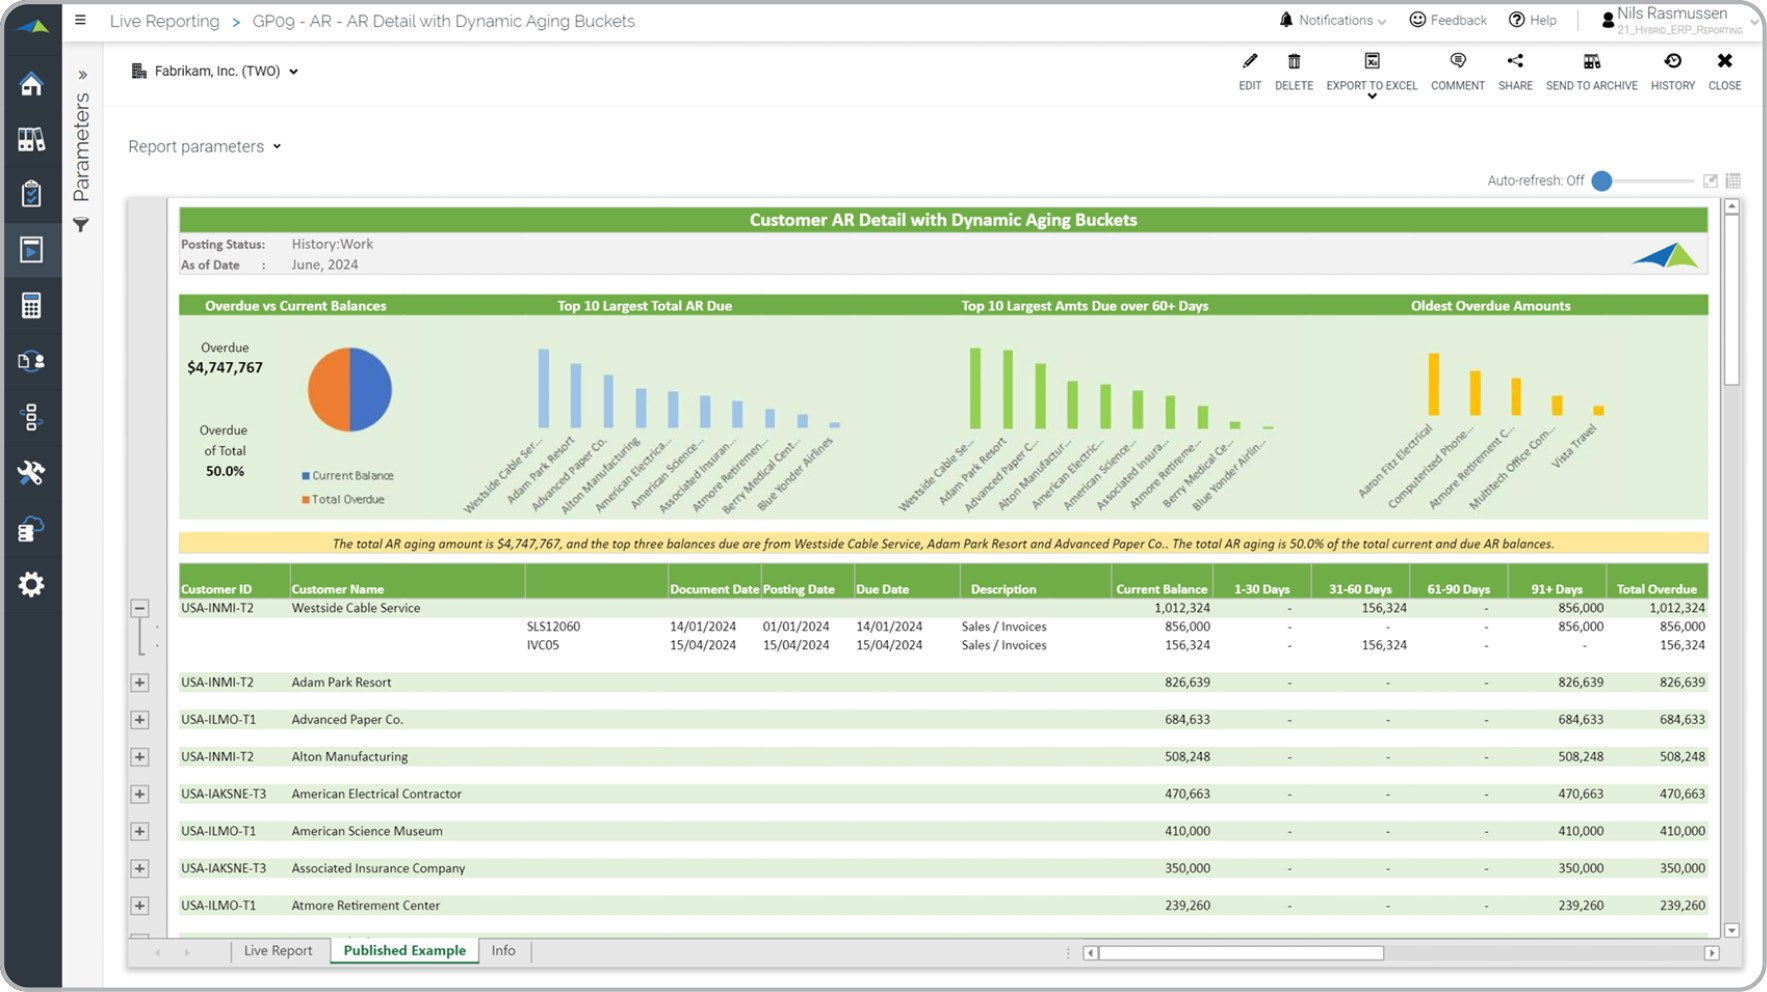
What does an Accounts Receivable Report with Dynamic Aging Buckets entail? An Accounts Receivable (AR) Aging report is a powerful operational tool that helps accountants identify past-due customer balances. This report is unique in that it dynamically calculates and displays outstanding amounts based on transaction dates falling within specific time ranges, such as 0-30 days, 31-60 days, and beyond. Since this report is dynamic, there's no need for users to run an aging process in their ERP system before accessing it. See below for an example of an Accounts Receivable Report with Dynamic Aging Buckets.
What is the Purpose of AR Aging Reports? Companies and organizations rely on AR Aging Reports to quickly identify customers with outstanding payments. Integrating this report into the Financial Planning & Analysis (FP&A) and Accounting Department's best practices improves liquidity and reduces the risk of customer defaults.
Benefits to Users Using an Accounts Receivable Report with Dynamic Aging Buckets, business users can make informed decisions and work more efficiently. This report enables users to easily identify past due customer balances and track outstanding amounts over time, giving them a clear picture of the company's financial health. With this information, business users can prioritize collections efforts and make decisions about how to allocate resources to ensure timely payments. In addition, the dynamic nature of this report saves users time and effort by eliminating the need to run an aging process in their ERP system. By streamlining the reporting process and providing real-time insights, this report helps users make better decisions and become more efficient in their daily tasks.
AR Aging Report
Example Here is an example of a modern AR Aging report with automatically calculated aging buckets.
You can find 100’s of additional examples
here
Who Uses This Type of
Report
? The typical users of this type of report are: CFOs, controllers and accountants.
Other
Report
s Often Used in Conjunction with
AR Aging Reports Most Financial Planning & Analysis (FP&A) and Accounting Departments use several different AR Aging Reports, along with sales transaction reports, accounts payable (AP) reports and other management and control tools.
Where Does the Data for Analysis Originate From? The Actual (historical transactions) data typically comes from enterprise resource planning (ERP) systems like: Microsoft Dynamics 365 (D365) Finance, Microsoft Dynamics 365 Business Central (D365 BC), Microsoft Dynamics AX, Microsoft Dynamics NAV, Microsoft Dynamics SL, Sage Intacct, Sage 100, Sage 300, Sage 500, Sage X3, SAP Business One, SAP ByDesign, Netsuite and others. In analysis where budgets or forecasts are used, the data most often originates from in-house Excel spreadsheet models or from professional corporate performance management (CPM/EPM) solutions.
What Tools are Typically used for Reporting, Planning and Dashboards? Examples of business software used with the data and ERPs mentioned above are:
- Native ERP report writers and query tools
- Spreadsheets (for example Microsoft Excel)
- Corporate Performance Management (CPM) tools (for example Solver)
- Dashboards (for example Microsoft Power BI and Tableau)
- View 100’s of reporting, consolidations, planning, budgeting, forecasting and dashboard examples here
- Discover how the Solver CPM solution delivers financial and operational reporting
- Discover how the Solver CPM solution delivers planning, budgeting and forecasting
- Watch demo videos of reporting, planning and dashboards
TAGS: Reporting, Analysis, ERP, Financial Reporting, Template Library
Global Headquarters
Solver, Inc.
Phone: +1 (310) 691-5300

